Deck 3: Using Supply and Demand to Analyze Markets
Full screen (f)
Question
Question
Question
Use the following to answer questions 11-12:
Figure 3.4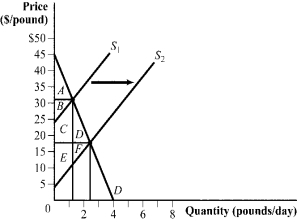
(Figure 3.4) The outward shift of the supply curve will cause consumer surplus to increase from area _____ to area _____.
A) A + B; C + D
B) A + B + C + D; D + F
C) B + C; F
D) A; A + B + C + D
Figure 3.4
(Figure 3.4) The outward shift of the supply curve will cause consumer surplus to increase from area _____ to area _____.
A) A + B; C + D
B) A + B + C + D; D + F
C) B + C; F
D) A; A + B + C + D
Question
Question
Use the following to answer question:
Figure 3.6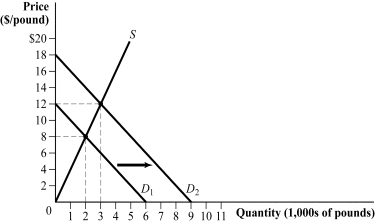
(Figure 3.6) An increase in demand caused consumer surplus to change from _____ to _____.
A) $16; $36
B) $8; $12
C) $8,000; $12,000
D) $4,000; $9,000
Figure 3.6
(Figure 3.6) An increase in demand caused consumer surplus to change from _____ to _____.
A) $16; $36
B) $8; $12
C) $8,000; $12,000
D) $4,000; $9,000
Question
Use the following to answer question:
Figure 3.3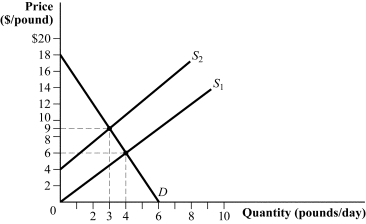
(Figure 3.3) The decrease in supply from S1 to S2 will cause consumer surplus to _____ and producer surplus to _____.
A) decrease by $10.50; decrease by $4.50
B) decrease by $5.50; increase by $3
C) increase by $6; decrease by $18
D) increase by $8.75; increase by $6.67
Figure 3.3
(Figure 3.3) The decrease in supply from S1 to S2 will cause consumer surplus to _____ and producer surplus to _____.
A) decrease by $10.50; decrease by $4.50
B) decrease by $5.50; increase by $3
C) increase by $6; decrease by $18
D) increase by $8.75; increase by $6.67
Question
Question
Question
Question
Use the following to answer question:
Figure 3.5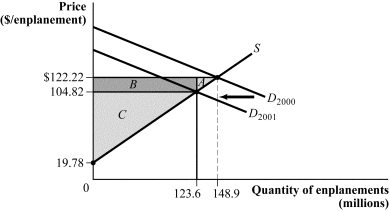
(Figure 3.5) After September 11, the demand curve for air travel shifted inward, from D2000 to D2001. In 2000 the equilibrium price and quantity were $122.22 and 148.9 million enplanements, respectively. After September 11, the equilibrium price and quantity fell to $104.82 and 123.6 million enplanements, respectively. The loss in producer surplus attributable to the decrease in demand is equal to area:
A) A.
B) A + B.
C) B + C.
D) B.
Question
Question
Question
Use the following to answer questions 11-12:
Figure 3.4
(Figure 3.4) The outward shift of the supply curve will cause producer surplus to increase from area _____ to area _____.
A) B; E + F
B) A + B; D + F
C) A + B + C; D + F
D) C; D
Figure 3.4
(Figure 3.4) The outward shift of the supply curve will cause producer surplus to increase from area _____ to area _____.
A) B; E + F
B) A + B; D + F
C) A + B + C; D + F
D) C; D
Question
Question
Use the following to answer question:
Figure 3.1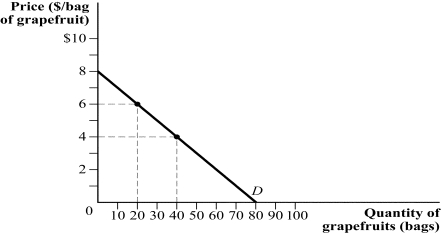
(Figure 3.1) At a market price of $4, what is total consumer surplus?
A) $120
B) $320
C) $160
D) $80
Figure 3.1
(Figure 3.1) At a market price of $4, what is total consumer surplus?
A) $120
B) $320
C) $160
D) $80
Question
Use the following to answer question:
Figure 3.2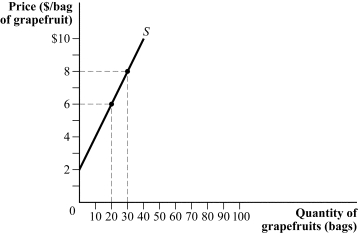
(Figure 3.2) If the price per bag of grapefruit increases from $6 to $8, producer surplus changes by:
A) $130.
B) $50.
C) $90.
D) $40.
Figure 3.2
(Figure 3.2) If the price per bag of grapefruit increases from $6 to $8, producer surplus changes by:
A) $130.
B) $50.
C) $90.
D) $40.
Question
Question
Use the following to answer questions 20-21:
Figure 3.7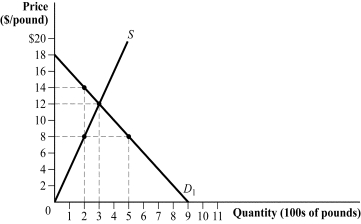
(Figure 3.7) At a price ceiling of $8, there is a shortage of _____ and a deadweight loss of _____.
A) 200 pounds; $1,200
B) 500 pounds; $400
C) 300 pounds; $600
D) 300 pounds; $300
Figure 3.7
(Figure 3.7) At a price ceiling of $8, there is a shortage of _____ and a deadweight loss of _____.
A) 200 pounds; $1,200
B) 500 pounds; $400
C) 300 pounds; $600
D) 300 pounds; $300
Question
Question
Question
Question
Question
Use the following to answer questions 22-23:
Figure 3.8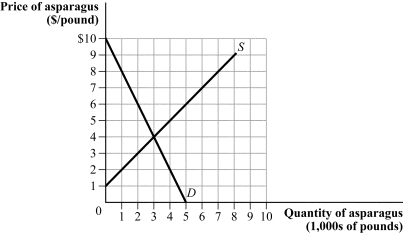
(Figure 3.8) Suppose the government mandates a price ceiling of $3 per pound. Producer surplus decreases from:
A) $1,500 to $800.
B) $2,200 to $1,400.
C) $4,500 to $2,000.
D) $3,000 to $2,700.
Figure 3.8
(Figure 3.8) Suppose the government mandates a price ceiling of $3 per pound. Producer surplus decreases from:
A) $1,500 to $800.
B) $2,200 to $1,400.
C) $4,500 to $2,000.
D) $3,000 to $2,700.
Question
Use the following to answer questions 29-31:
Figure 3.10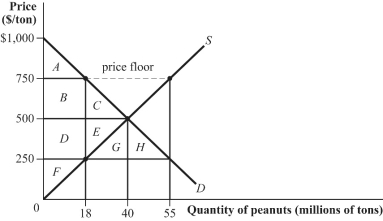
(Figure 3.10) At a price floor of $750, there is an excess supply of _____ tons of peanuts.
A) 18 million
B) 12 million
C) 15 million
D) 37 million
Figure 3.10
(Figure 3.10) At a price floor of $750, there is an excess supply of _____ tons of peanuts.
A) 18 million
B) 12 million
C) 15 million
D) 37 million
Question
Use the following to answer question:
Figure 3.9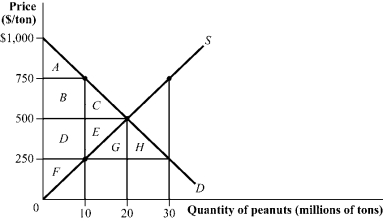
(Figure 3.9) Suppose the government enacts a price ceiling of $250 per ton. Which of the following statements are TRUE?
A) I, II, and IV
B) I and IV
C) II and III
D) II, III, and IV
Figure 3.9
(Figure 3.9) Suppose the government enacts a price ceiling of $250 per ton. Which of the following statements are TRUE?
A) I, II, and IV
B) I and IV
C) II and III
D) II, III, and IV
Question
Use the following to answer questions 29-31:
Figure 3.10
(Figure 3.10) If the government mandates a price floor of $750, the area of consumer surplus:
A) increases from A to A + B + C.
B) decreases from A + B + C to A.
C) increases from A to B + C.
D) decreases from B + C to A.
Figure 3.10
(Figure 3.10) If the government mandates a price floor of $750, the area of consumer surplus:
A) increases from A to A + B + C.
B) decreases from A + B + C to A.
C) increases from A to B + C.
D) decreases from B + C to A.
Question
Use the following to answer questions 29-31:
Figure 3.10
(Figure 3.10) If the government mandates a price floor of $750, the area of producer surplus changes from:
A) D + E + F to B + D + F.
B) F to B + C + D + F.
C) D + E + F to A + B + D + F.
D) B + C + D + F to B + D + F.
Figure 3.10
(Figure 3.10) If the government mandates a price floor of $750, the area of producer surplus changes from:
A) D + E + F to B + D + F.
B) F to B + C + D + F.
C) D + E + F to A + B + D + F.
D) B + C + D + F to B + D + F.
Question
Use the following to answer questions 22-23:
Figure 3.8
(Figure 3.8) At a price ceiling of $2, what is the amount of surplus transferred from producers to consumers?
A) $4,000
B) $2,000
C) $1,000
D) $500
Figure 3.8
(Figure 3.8) At a price ceiling of $2, what is the amount of surplus transferred from producers to consumers?
A) $4,000
B) $2,000
C) $1,000
D) $500
Question
Question
Use the following to answer question:
Figure 3.13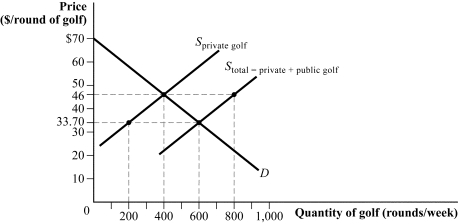
(Figure 3.13) The supply of private golf courses is Sprivate golf and the supply of private and public golf courses is Stotal. The government provision of public golf courses reduced the number of rounds per week played on private golf courses by:
A)400.
B)200.
C)100.
D) 50.
Figure 3.13
(Figure 3.13) The supply of private golf courses is Sprivate golf and the supply of private and public golf courses is Stotal. The government provision of public golf courses reduced the number of rounds per week played on private golf courses by:
A)400.
B)200.
C)100.
D) 50.
Question
Use the following to answer question:
Figure 3.11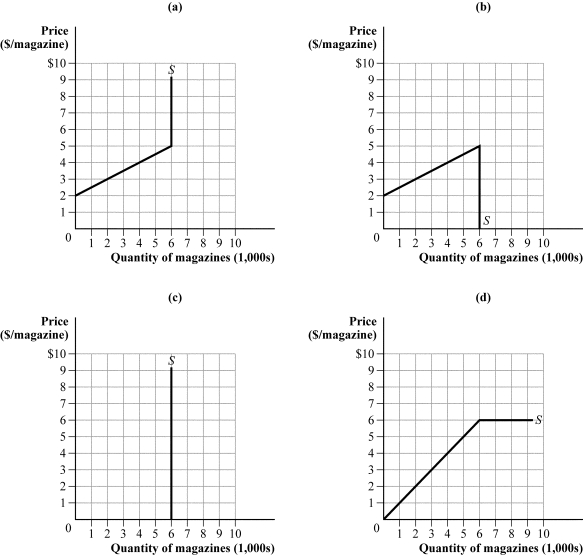
(Figure 3.11) The supply equation in the adult magazine market is given by QS = 2P - 4, where P is the price per magazine and Q measures the number of magazines in thousands. Which supply curve reflects a government quota of 6,000 magazines?
A) panel (a)
B) panel (b)
C) panel (c)
D) panel (d)
Question
Question
In a small country, the demand and supply of kidneys are represented by QD = 10,000 - 0.25P and QS = 0.5P + 4,000. Which of the following statements is (are) TRUE? 
A) I, II, and III
B) II and III (because the demand curve shifts out, pushing up the price)
C) I and II
D) III
A) I, II, and III
B) II and III (because the demand curve shifts out, pushing up the price)
C) I and II
D) III
Question
Use the following to answer questions 35-36:
Figure 3.12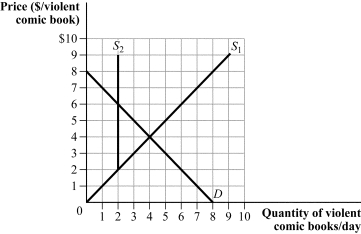
(Figure 3.12) The quota causes consumer surplus to:
A) increase from $8 to $16.
B) decrease from $8 to $2.
C) decrease from $16 to $12.
D) decrease from $12 to $4.
Figure 3.12
(Figure 3.12) The quota causes consumer surplus to:
A) increase from $8 to $16.
B) decrease from $8 to $2.
C) decrease from $16 to $12.
D) decrease from $12 to $4.
Question
Question
Use the following to answer questions 39-40:
Figure 3.14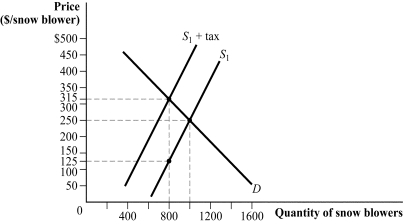
(Figure 3.14) Which of the following statements is (are) TRUE?
A) I and III
B) II and III
C) II
D) I, II, and III
Figure 3.14
(Figure 3.14) Which of the following statements is (are) TRUE?
A) I and III
B) II and III
C) II
D) I, II, and III
Question
Use the following to answer questions 20-21:
Figure 3.7
(Figure 3.7) Suppose the government mandates a price ceiling of $8 per pound. Consumer surplus:
A) increases from $900 to $1,600.
B) increases from $400 to $1,200.
C) increases from $1,800 to $2,100.
D) decreases from $600 to $450.
Figure 3.7
(Figure 3.7) Suppose the government mandates a price ceiling of $8 per pound. Consumer surplus:
A) increases from $900 to $1,600.
B) increases from $400 to $1,200.
C) increases from $1,800 to $2,100.
D) decreases from $600 to $450.
Question
Question
Use the following to answer questions 35-36:
Figure 3.12
(Figure 3.12) The quota causes consumer surplus to:
A) decrease from $12 to $2.
B) decrease from $16 to $2.
C) increase from $2 to $12.
D) increase from $8 to $10.
Figure 3.12
(Figure 3.12) The quota causes consumer surplus to:
A) decrease from $12 to $2.
B) decrease from $16 to $2.
C) increase from $2 to $12.
D) increase from $8 to $10.
Question
Use the following to answer questions 39-40:
Figure 3.14
(Figure 3.14) The size of the tax is:
A) $125.
B) $65.
C) $190.
D) $200.
Figure 3.14
(Figure 3.14) The size of the tax is:
A) $125.
B) $65.
C) $190.
D) $200.
Question
Question
Question
Use the following to answer question:
Figure 3.15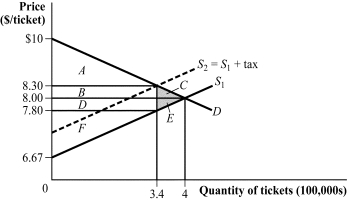
(Figure 3.15) Which of the following statements is (are) TRUE?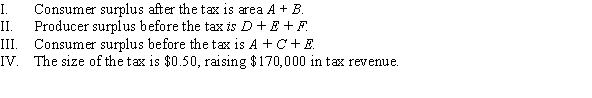
A) I and II
B) II, III, and IV
C) IV
D) II and IV
Figure 3.15
(Figure 3.15) Which of the following statements is (are) TRUE?
A) I and II
B) II, III, and IV
C) IV
D) II and IV
Question
Use the following to answer question:
Figure 3.17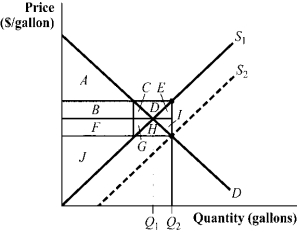
(Figure 3.17) Figure 3.17 shows the effect of a government subsidy. Which of the following statements is (are) TRUE?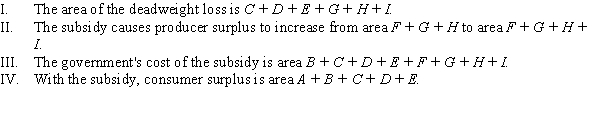
A) I and IV
B) I and III
C) III only.
D) II, III, and IV
Figure 3.17
(Figure 3.17) Figure 3.17 shows the effect of a government subsidy. Which of the following statements is (are) TRUE?
A) I and IV
B) I and III
C) III only.
D) II, III, and IV
Question
Use the following to answer question:
Figure 3.18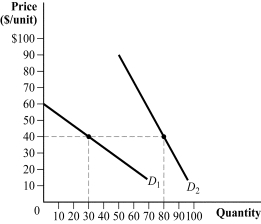
(Figure 3.18) Answer the following questions: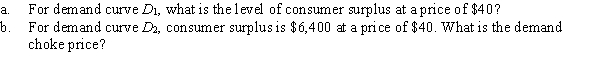
Figure 3.18
(Figure 3.18) Answer the following questions:
Question
Question
Question
The supply and demand for squash are given by QD = 200,000 - 50,000P and QS = 90,000P - 80,000, where P is price per pound and Q measures pounds of squash. 
Question
Question
Question
Question
Use the following to answer question:
Figure 3.19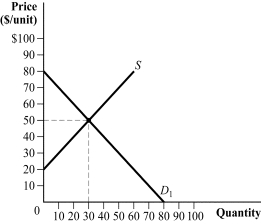
(Figure 3.19) Refer to Figure 3.19 to answer the following question: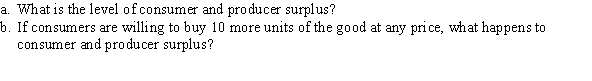
Figure 3.19
(Figure 3.19) Refer to Figure 3.19 to answer the following question:
Question
Question
Question
Question
Use the following to answer question:
Figure 3.20
(Figure 3.20) Refer to Figure 3.20 to answer the following questions:
Figure 3.20
(Figure 3.20) Refer to Figure 3.20 to answer the following questions:
Question
Question
The demand and supply of pickles are given by QD = 300 - 500P and QS = 400P - 150, where P is the price per pickle and Q measures the quantity of pickles in millions. Suppose the government creates a subsidy of $0.25 per pickle. Which of the following statements are TRUE? 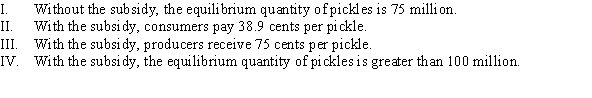
A) II, III, and IV
B) I and III
C) II and IV
D) I, III, and IV
A) II, III, and IV
B) I and III
C) II and IV
D) I, III, and IV
Question
Question
Use the following to answer question:
Figure 3.16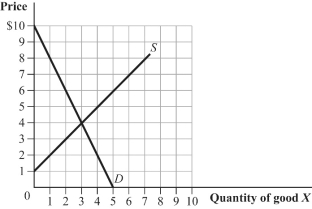
(Figure 3.16) Which of the following statements is (are) TRUE?
A) I, II, and III
B) I and III
C) II and III
D) I
Figure 3.16
(Figure 3.16) Which of the following statements is (are) TRUE?
A) I, II, and III
B) I and III
C) II and III
D) I
Question
The supply and demand for solar panels are given by QS = 5P - 5,000 and QD = 15,000 - 5P, where P is price per solar panel and Q measures the quantity of solar panels. Suppose the government provides a $500 subsidy per solar panel. 
Question
Answer the following questions regarding taxes. 
Question
Use the following to answer question:
Figure 3.23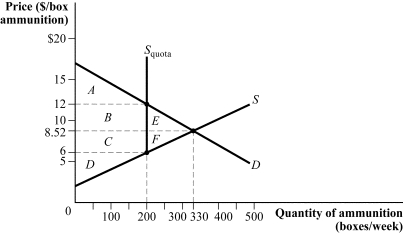
(Figure 3.23) Use Figure 3.23 to answer the following questions: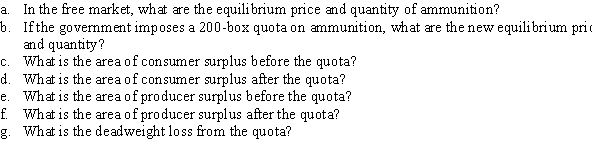
Figure 3.23
(Figure 3.23) Use Figure 3.23 to answer the following questions:
Question
Use the following to answer question:
Figure 3.21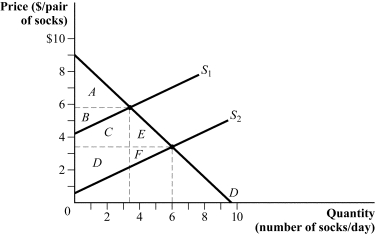
(Figure 3.21) Refer to Figure 3.21 to answer the following questions:
Figure 3.21
(Figure 3.21) Refer to Figure 3.21 to answer the following questions:
Question
Question
Question
Use the following to answer question:
Figure 3.26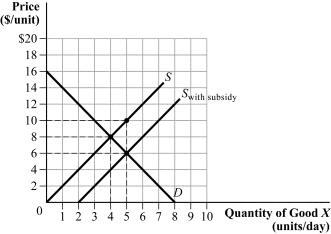
(Figure 3.26) Use Figure 3.26 to answer the following questions.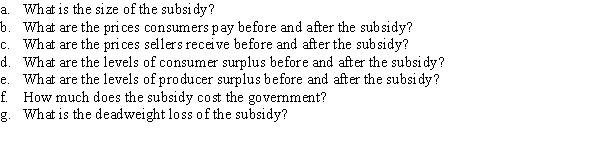
Figure 3.26
(Figure 3.26) Use Figure 3.26 to answer the following questions.
Question
Question
The market for cigars is characterized by QD = 10 - 0.25P and QS = 0.15P, where P is price per box of cigars and Q measures boxes per hour. 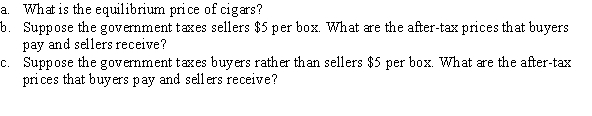
Question
The market for cookies is represented by the following supply and demand conditions:
QD = 1,000 - 200P and QS = 400P - 200, where P is price per box of cookies and Q measures boxes per day.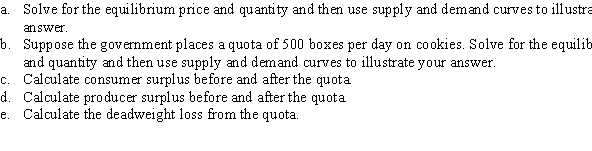
QD = 1,000 - 200P and QS = 400P - 200, where P is price per box of cookies and Q measures boxes per day.
Question
Use the following to answer question:
Figure 3.22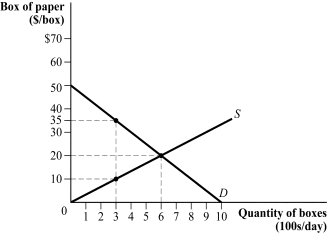
(Figure 3.22) Suppose the government sets a price ceiling of $10.
Figure 3.22
(Figure 3.22) Suppose the government sets a price ceiling of $10.
Question
Question
Use the following to answer question:
Figure 3.25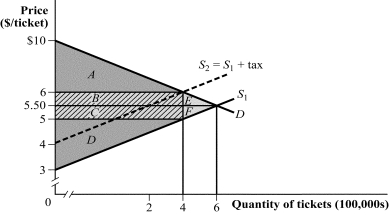
(Figure 3.25) Refer to Figure 3.25 to answer the following questions: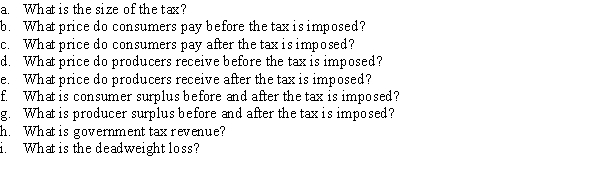
Figure 3.25
(Figure 3.25) Refer to Figure 3.25 to answer the following questions:
Question
In the market for cotton, the quantity demanded and quantity supplied are expressed mathematically as QD = 400 - 250P and QS = 250P - 100, where P is the price per pound of cotton and Q measures pounds of cotton. Suppose the government sets a price ceiling of $0.50 per pound of cotton. 
Question
Question
Use the following to answer question:
Figure 3.24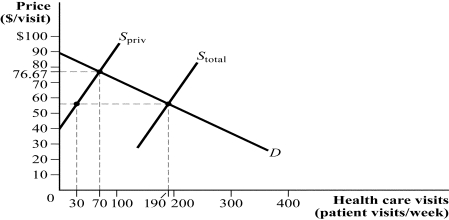
(Figure 3.24) In Figure 3.24, Spriv represents the supply of health care visits at private clinics and Stotal represents the total supply of health care visits at private and government-operated clinics.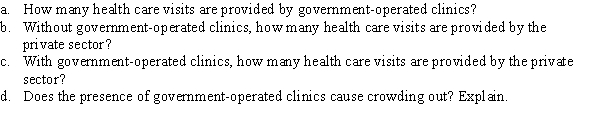
Figure 3.24
(Figure 3.24) In Figure 3.24, Spriv represents the supply of health care visits at private clinics and Stotal represents the total supply of health care visits at private and government-operated clinics.
Question
The supply and demand for almonds are QD = 80 - 10P and QS = 10P, where P is price per bag and Q measures hundreds of bags per day. 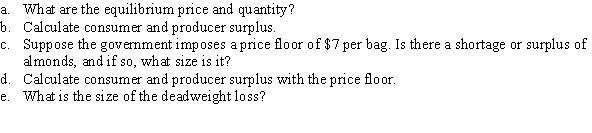
Question
The supply and demand for 9-volt batteries are given by QD = 230 - 10P and QS = 30P - 10, where P is the price per four-pack and Q measures the number of four-packs. 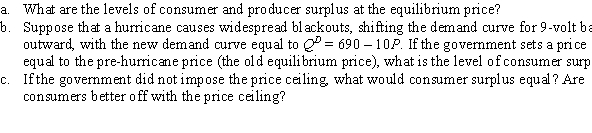
Question
Suppose the market for soda is represented by the following supply and demand equations:
QS = 35P - 39.75 and QD = 10.25 - 5P, where P is price per bottle and Q measures bottles per second.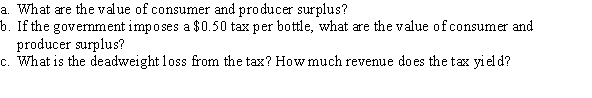
QS = 35P - 39.75 and QD = 10.25 - 5P, where P is price per bottle and Q measures bottles per second.
Question

Unlock Deck
Sign up to unlock the cards in this deck!
Unlock Deck
Unlock Deck
1/104
Play
Full screen (f)
Deck 3: Using Supply and Demand to Analyze Markets
1
All else equal, a negative supply shock:
A) causes consumer surplus to increase and producer surplus to decrease.
B) causes consumer surplus to decrease and producer surplus to increase.
C) causes both consumer and producer surplus to increase.
D) causes both consumer and producer surplus to decrease.
A) causes consumer surplus to increase and producer surplus to decrease.
B) causes consumer surplus to decrease and producer surplus to increase.
C) causes both consumer and producer surplus to increase.
D) causes both consumer and producer surplus to decrease.
D
2
Suppose that last year the equilibrium price and the quantity of good X were $10 and 5 million pounds, respectively. Because of strong demand this year, the equilibrium price and the quantity of good X are $12 and 7 million pounds, respectively. Assuming that the supply curve of good X is linear, producer surplus:
A) decreased from $8 million to $6 million.
B) increased from $12.5 million to $24.5 million.
C) increased from $3 million to $7 million.
D) increased from $4.2 million to $5.6 million.
A) decreased from $8 million to $6 million.
B) increased from $12.5 million to $24.5 million.
C) increased from $3 million to $7 million.
D) increased from $4.2 million to $5.6 million.
B
3
Use the following to answer questions 11-12:
Figure 3.4
(Figure 3.4) The outward shift of the supply curve will cause consumer surplus to increase from area _____ to area _____.
A) A + B; C + D
B) A + B + C + D; D + F
C) B + C; F
D) A; A + B + C + D
Figure 3.4
(Figure 3.4) The outward shift of the supply curve will cause consumer surplus to increase from area _____ to area _____.
A) A + B; C + D
B) A + B + C + D; D + F
C) B + C; F
D) A; A + B + C + D
D
4
Nancy paid $55 for car mats but was willing to pay $80. What is Nancy's consumer surplus?
A) $105
B) $15
C) $25
D) $135
A) $105
B) $15
C) $25
D) $135
Unlock Deck
Unlock for access to all 104 flashcards in this deck.
Unlock Deck
k this deck
5
Use the following to answer question:
Figure 3.6
(Figure 3.6) An increase in demand caused consumer surplus to change from _____ to _____.
A) $16; $36
B) $8; $12
C) $8,000; $12,000
D) $4,000; $9,000
Figure 3.6
(Figure 3.6) An increase in demand caused consumer surplus to change from _____ to _____.
A) $16; $36
B) $8; $12
C) $8,000; $12,000
D) $4,000; $9,000
Unlock Deck
Unlock for access to all 104 flashcards in this deck.
Unlock Deck
k this deck
6
Use the following to answer question:
Figure 3.3
(Figure 3.3) The decrease in supply from S1 to S2 will cause consumer surplus to _____ and producer surplus to _____.
A) decrease by $10.50; decrease by $4.50
B) decrease by $5.50; increase by $3
C) increase by $6; decrease by $18
D) increase by $8.75; increase by $6.67
Figure 3.3
(Figure 3.3) The decrease in supply from S1 to S2 will cause consumer surplus to _____ and producer surplus to _____.
A) decrease by $10.50; decrease by $4.50
B) decrease by $5.50; increase by $3
C) increase by $6; decrease by $18
D) increase by $8.75; increase by $6.67
Unlock Deck
Unlock for access to all 104 flashcards in this deck.
Unlock Deck
k this deck
7
The demand for a good is given by QD = 750 - 0.4P. What is consumer surplus at a price of $80?
A) $644,405
B) $57,440
C) $1,875
D) $71,800
A) $644,405
B) $57,440
C) $1,875
D) $71,800
Unlock Deck
Unlock for access to all 104 flashcards in this deck.
Unlock Deck
k this deck
8
The demand and supply curves for Fuji apples are given by QD = 50 - 6P and QS = 4P - 2, where P is price per bag and Q is in thousands of bags. What are consumer surplus and producer surplus at the equilibrium price?
A) CS = $450; PS = $375
B) CS = $856,000; PS = $1,126,113
C) CS = $15,006; PS = $7,657
D) CS = $29,422; PS = $44,180
A) CS = $450; PS = $375
B) CS = $856,000; PS = $1,126,113
C) CS = $15,006; PS = $7,657
D) CS = $29,422; PS = $44,180
Unlock Deck
Unlock for access to all 104 flashcards in this deck.
Unlock Deck
k this deck
9
Which of the following supply curves (where P is price per bushel and QS measures number of bushels) generates $64 of producer surplus at a market price of $10 per bushel?
A) QS = 7.5P - 1.5
B) QS = 10P - 3
C) QS = 2P - 4
D) QS = 6P - 8
A) QS = 7.5P - 1.5
B) QS = 10P - 3
C) QS = 2P - 4
D) QS = 6P - 8
Unlock Deck
Unlock for access to all 104 flashcards in this deck.
Unlock Deck
k this deck
10
Use the following to answer question:
Figure 3.5
(Figure 3.5) After September 11, the demand curve for air travel shifted inward, from D2000 to D2001. In 2000 the equilibrium price and quantity were $122.22 and 148.9 million enplanements, respectively. After September 11, the equilibrium price and quantity fell to $104.82 and 123.6 million enplanements, respectively. The loss in producer surplus attributable to the decrease in demand is equal to area:
A) A.
B) A + B.
C) B + C.
D) B.
Unlock Deck
Unlock for access to all 104 flashcards in this deck.
Unlock Deck
k this deck
11
When demand and supply are linear, consumer surplus is equal to:
A) the area between the demand curve and the price, out to the quantity that is exchanged.
B) the area between the supply curve and the price, out to the quantity that is exchanged.
C) the entire area between the demand curve and the price. See Section 3.1.
D) the entire area between the supply curve and the price.
Unlock Deck
Unlock for access to all 104 flashcards in this deck.
Unlock Deck
k this deck
12
All else equal, a demand increase:
A) causes consumer surplus to increase and producer surplus to decrease.
B) causes consumer surplus to decrease and producer surplus to increase.
C) causes both consumer and producer surplus to increase.
D) causes both consumer and producer surplus to decrease.
A) causes consumer surplus to increase and producer surplus to decrease.
B) causes consumer surplus to decrease and producer surplus to increase.
C) causes both consumer and producer surplus to increase.
D) causes both consumer and producer surplus to decrease.
Unlock Deck
Unlock for access to all 104 flashcards in this deck.
Unlock Deck
k this deck
13
Use the following to answer questions 11-12:
Figure 3.4
(Figure 3.4) The outward shift of the supply curve will cause producer surplus to increase from area _____ to area _____.
A) B; E + F
B) A + B; D + F
C) A + B + C; D + F
D) C; D
Figure 3.4
(Figure 3.4) The outward shift of the supply curve will cause producer surplus to increase from area _____ to area _____.
A) B; E + F
B) A + B; D + F
C) A + B + C; D + F
D) C; D
Unlock Deck
Unlock for access to all 104 flashcards in this deck.
Unlock Deck
k this deck
14
The market for organic cabbage is represented by QD = 1,200 - 75P and QS = 425P - 300, where P is the price per head of cabbage and Q measures the number of heads of cabbage per week. Suppose the price of organic fertilizer falls, making sellers willing to sell 100 more heads of cabbage per week at every price. What happens to producer and consumer surplus as a result of this change?
A) Consumer surplus increases from $6,337.50 to $6,534, and producer surplus increases from $1,116.38 to $1,153.35.
B) Consumer surplus increases from $15,000 to $16,200, and producer surplus increases from $4,600 to $7,700.
C) Consumer surplus remains unchanged, but producer surplus increases from $351.22 to $454.15.
D) Consumer surplus increases from $1,899 to $2,300.25, and producer surplus increases from $1,500.40 to $1,910.05.
Unlock Deck
Unlock for access to all 104 flashcards in this deck.
Unlock Deck
k this deck
15
Use the following to answer question:
Figure 3.1
(Figure 3.1) At a market price of $4, what is total consumer surplus?
A) $120
B) $320
C) $160
D) $80
Figure 3.1
(Figure 3.1) At a market price of $4, what is total consumer surplus?
A) $120
B) $320
C) $160
D) $80
Unlock Deck
Unlock for access to all 104 flashcards in this deck.
Unlock Deck
k this deck
16
Use the following to answer question:
Figure 3.2
(Figure 3.2) If the price per bag of grapefruit increases from $6 to $8, producer surplus changes by:
A) $130.
B) $50.
C) $90.
D) $40.
Figure 3.2
(Figure 3.2) If the price per bag of grapefruit increases from $6 to $8, producer surplus changes by:
A) $130.
B) $50.
C) $90.
D) $40.
Unlock Deck
Unlock for access to all 104 flashcards in this deck.
Unlock Deck
k this deck
17
Suppose that technological breakthroughs make jet packs affordable, convenient, and safe for personal transportation. The demand for automobiles would become _____ the consumer surplus from automobiles.
A) more price elastic, decreasing
B) more price inelastic, increasing
C) more price inelastic, decreasing
D) perfectly inelastic, increasing
A) more price elastic, decreasing
B) more price inelastic, increasing
C) more price inelastic, decreasing
D) perfectly inelastic, increasing
Unlock Deck
Unlock for access to all 104 flashcards in this deck.
Unlock Deck
k this deck
18
Use the following to answer questions 20-21:
Figure 3.7
(Figure 3.7) At a price ceiling of $8, there is a shortage of _____ and a deadweight loss of _____.
A) 200 pounds; $1,200
B) 500 pounds; $400
C) 300 pounds; $600
D) 300 pounds; $300
Figure 3.7
(Figure 3.7) At a price ceiling of $8, there is a shortage of _____ and a deadweight loss of _____.
A) 200 pounds; $1,200
B) 500 pounds; $400
C) 300 pounds; $600
D) 300 pounds; $300
Unlock Deck
Unlock for access to all 104 flashcards in this deck.
Unlock Deck
k this deck
19
Tavist allergy pills sell for $25 a box. Steve, Brian, and Toby are willing to pay $33, $27, and $19, respectively, for a box of Tavist. What is the total consumer surplus for Steve, Brian, and Toby?
A) $16
B) $10
C) $4
D) $60
A) $16
B) $10
C) $4
D) $60
Unlock Deck
Unlock for access to all 104 flashcards in this deck.
Unlock Deck
k this deck
20
Justin purchased a Polar Express train set from Lionel Trains. He paid $240 for the set and received consumer surplus of $125. What was Justin's willingness to pay for the train set?
A) $115
B) $240
C) $250
D) $365
A) $115
B) $240
C) $250
D) $365
Unlock Deck
Unlock for access to all 104 flashcards in this deck.
Unlock Deck
k this deck
21
The market for plywood is characterized by the following demand and supply equations: QD = 800 - 10P and QS = 50P - 1,000, where P is the price per sheet of plywood and Q measures the quantity of plywood. What is the size of the deadweight loss if the government imposes a price ceiling of $25 per sheet of plywood?
A) $3,750
B) $4,418
C) $6,000
D) $8,900
A) $3,750
B) $4,418
C) $6,000
D) $8,900
Unlock Deck
Unlock for access to all 104 flashcards in this deck.
Unlock Deck
k this deck
22
The market for plywood is characterized by the following demand and supply equations: QD = 800 - 10P and QS = 50P - 1,000, where P is the price per sheet of plywood and Q measures the quantity of plywood. If the government imposes a price ceiling of $25 per sheet of plywood, producer surplus:
A) increases from $3,333 to $4,225.
B) decreases from $5,000 to $1,250.
C) decreases from $1,875 to $1,240.
D) decreases from $2,500 to $625.
A) increases from $3,333 to $4,225.
B) decreases from $5,000 to $1,250.
C) decreases from $1,875 to $1,240.
D) decreases from $2,500 to $625.
Unlock Deck
Unlock for access to all 104 flashcards in this deck.
Unlock Deck
k this deck
23
Use the following to answer questions 22-23:
Figure 3.8
(Figure 3.8) Suppose the government mandates a price ceiling of $3 per pound. Producer surplus decreases from:
A) $1,500 to $800.
B) $2,200 to $1,400.
C) $4,500 to $2,000.
D) $3,000 to $2,700.
Figure 3.8
(Figure 3.8) Suppose the government mandates a price ceiling of $3 per pound. Producer surplus decreases from:
A) $1,500 to $800.
B) $2,200 to $1,400.
C) $4,500 to $2,000.
D) $3,000 to $2,700.
Unlock Deck
Unlock for access to all 104 flashcards in this deck.
Unlock Deck
k this deck
24
Use the following to answer questions 29-31:
Figure 3.10
(Figure 3.10) At a price floor of $750, there is an excess supply of _____ tons of peanuts.
A) 18 million
B) 12 million
C) 15 million
D) 37 million
Figure 3.10
(Figure 3.10) At a price floor of $750, there is an excess supply of _____ tons of peanuts.
A) 18 million
B) 12 million
C) 15 million
D) 37 million
Unlock Deck
Unlock for access to all 104 flashcards in this deck.
Unlock Deck
k this deck
25
Use the following to answer question:
Figure 3.9
(Figure 3.9) Suppose the government enacts a price ceiling of $250 per ton. Which of the following statements are TRUE?
A) I, II, and IV
B) I and IV
C) II and III
D) II, III, and IV
Figure 3.9
(Figure 3.9) Suppose the government enacts a price ceiling of $250 per ton. Which of the following statements are TRUE?
A) I, II, and IV
B) I and IV
C) II and III
D) II, III, and IV
Unlock Deck
Unlock for access to all 104 flashcards in this deck.
Unlock Deck
k this deck
26
Use the following to answer questions 29-31:
Figure 3.10
(Figure 3.10) If the government mandates a price floor of $750, the area of consumer surplus:
A) increases from A to A + B + C.
B) decreases from A + B + C to A.
C) increases from A to B + C.
D) decreases from B + C to A.
Figure 3.10
(Figure 3.10) If the government mandates a price floor of $750, the area of consumer surplus:
A) increases from A to A + B + C.
B) decreases from A + B + C to A.
C) increases from A to B + C.
D) decreases from B + C to A.
Unlock Deck
Unlock for access to all 104 flashcards in this deck.
Unlock Deck
k this deck
27
Use the following to answer questions 29-31:
Figure 3.10
(Figure 3.10) If the government mandates a price floor of $750, the area of producer surplus changes from:
A) D + E + F to B + D + F.
B) F to B + C + D + F.
C) D + E + F to A + B + D + F.
D) B + C + D + F to B + D + F.
Figure 3.10
(Figure 3.10) If the government mandates a price floor of $750, the area of producer surplus changes from:
A) D + E + F to B + D + F.
B) F to B + C + D + F.
C) D + E + F to A + B + D + F.
D) B + C + D + F to B + D + F.
Unlock Deck
Unlock for access to all 104 flashcards in this deck.
Unlock Deck
k this deck
28
Use the following to answer questions 22-23:
Figure 3.8
(Figure 3.8) At a price ceiling of $2, what is the amount of surplus transferred from producers to consumers?
A) $4,000
B) $2,000
C) $1,000
D) $500
Figure 3.8
(Figure 3.8) At a price ceiling of $2, what is the amount of surplus transferred from producers to consumers?
A) $4,000
B) $2,000
C) $1,000
D) $500
Unlock Deck
Unlock for access to all 104 flashcards in this deck.
Unlock Deck
k this deck
29
In the market for used cars, the demand and supply equations are given by QD = 12,000 - 0.4P and QS = 0.1P + 5,000, where P is the price per car and Q measures the quantity of cars. What is the size of the deadweight loss at a price floor of $15,000?
A) $250,000
B) $500,000
C) $750,000
D) $1 million
A) $250,000
B) $500,000
C) $750,000
D) $1 million
Unlock Deck
Unlock for access to all 104 flashcards in this deck.
Unlock Deck
k this deck
30
Use the following to answer question:
Figure 3.13
(Figure 3.13) The supply of private golf courses is Sprivate golf and the supply of private and public golf courses is Stotal. The government provision of public golf courses reduced the number of rounds per week played on private golf courses by:
A)400.
B)200.
C)100.
D) 50.
Figure 3.13
(Figure 3.13) The supply of private golf courses is Sprivate golf and the supply of private and public golf courses is Stotal. The government provision of public golf courses reduced the number of rounds per week played on private golf courses by:
A)400.
B)200.
C)100.
D) 50.
Unlock Deck
Unlock for access to all 104 flashcards in this deck.
Unlock Deck
k this deck
31
Use the following to answer question:
Figure 3.11
(Figure 3.11) The supply equation in the adult magazine market is given by QS = 2P - 4, where P is the price per magazine and Q measures the number of magazines in thousands. Which supply curve reflects a government quota of 6,000 magazines?
A) panel (a)
B) panel (b)
C) panel (c)
D) panel (d)
Unlock Deck
Unlock for access to all 104 flashcards in this deck.
Unlock Deck
k this deck
32
In the market for used cars, the demand and supply equations are given by QD = 12,000 - 0.4P and QS = 0.1P + 5,000, where P is the price per car and Q measures the quantity of cars. What happens at a price floor of $20,000?
A) There is a surplus of 7,000 cars.
B) There is a surplus of 3,000 cars.
C) Consumers want to buy 3,000 cars.
D) Consumers want to buy 7,000 cars.
A) There is a surplus of 7,000 cars.
B) There is a surplus of 3,000 cars.
C) Consumers want to buy 3,000 cars.
D) Consumers want to buy 7,000 cars.
Unlock Deck
Unlock for access to all 104 flashcards in this deck.
Unlock Deck
k this deck
33
In a small country, the demand and supply of kidneys are represented by QD = 10,000 - 0.25P and QS = 0.5P + 4,000. Which of the following statements is (are) TRUE?
A) I, II, and III
B) II and III (because the demand curve shifts out, pushing up the price)
C) I and II
D) III
A) I, II, and III
B) II and III (because the demand curve shifts out, pushing up the price)
C) I and II
D) III
Unlock Deck
Unlock for access to all 104 flashcards in this deck.
Unlock Deck
k this deck
34
Use the following to answer questions 35-36:
Figure 3.12
(Figure 3.12) The quota causes consumer surplus to:
A) increase from $8 to $16.
B) decrease from $8 to $2.
C) decrease from $16 to $12.
D) decrease from $12 to $4.
Figure 3.12
(Figure 3.12) The quota causes consumer surplus to:
A) increase from $8 to $16.
B) decrease from $8 to $2.
C) decrease from $16 to $12.
D) decrease from $12 to $4.
Unlock Deck
Unlock for access to all 104 flashcards in this deck.
Unlock Deck
k this deck
35
The deadweight loss (owing to a price ceiling) increases as demand becomes more _____ and supply becomes more _____.
A) inelastic; inelastic
B) elastic; inelastic
C) elastic; elastic
D) inelastic; elastic
A) inelastic; inelastic
B) elastic; inelastic
C) elastic; elastic
D) inelastic; elastic
Unlock Deck
Unlock for access to all 104 flashcards in this deck.
Unlock Deck
k this deck
36
Use the following to answer questions 39-40:
Figure 3.14
(Figure 3.14) Which of the following statements is (are) TRUE?
A) I and III
B) II and III
C) II
D) I, II, and III
Figure 3.14
(Figure 3.14) Which of the following statements is (are) TRUE?
A) I and III
B) II and III
C) II
D) I, II, and III
Unlock Deck
Unlock for access to all 104 flashcards in this deck.
Unlock Deck
k this deck
37
Use the following to answer questions 20-21:
Figure 3.7
(Figure 3.7) Suppose the government mandates a price ceiling of $8 per pound. Consumer surplus:
A) increases from $900 to $1,600.
B) increases from $400 to $1,200.
C) increases from $1,800 to $2,100.
D) decreases from $600 to $450.
Figure 3.7
(Figure 3.7) Suppose the government mandates a price ceiling of $8 per pound. Consumer surplus:
A) increases from $900 to $1,600.
B) increases from $400 to $1,200.
C) increases from $1,800 to $2,100.
D) decreases from $600 to $450.
Unlock Deck
Unlock for access to all 104 flashcards in this deck.
Unlock Deck
k this deck
38
In 2007, Hawaii began providing universal health care coverage to all children, but the Hawaiian government ended the program in just 7 months. Government officials claimed that most of the children who received government coverage dropped their private insurance to become eligible for the program. As a government official stated, "People who were already able to afford health care began to stop paying for it so they could get it for free." In this example, Hawaii's universal health care coverage caused:
A) crowding out.
B) expansion drift.
C) impure prevalence.
D) supplier-induced demand.
A) crowding out.
B) expansion drift.
C) impure prevalence.
D) supplier-induced demand.
Unlock Deck
Unlock for access to all 104 flashcards in this deck.
Unlock Deck
k this deck
39
Use the following to answer questions 35-36:
Figure 3.12
(Figure 3.12) The quota causes consumer surplus to:
A) decrease from $12 to $2.
B) decrease from $16 to $2.
C) increase from $2 to $12.
D) increase from $8 to $10.
Figure 3.12
(Figure 3.12) The quota causes consumer surplus to:
A) decrease from $12 to $2.
B) decrease from $16 to $2.
C) increase from $2 to $12.
D) increase from $8 to $10.
Unlock Deck
Unlock for access to all 104 flashcards in this deck.
Unlock Deck
k this deck
40
Use the following to answer questions 39-40:
Figure 3.14
(Figure 3.14) The size of the tax is:
A) $125.
B) $65.
C) $190.
D) $200.
Figure 3.14
(Figure 3.14) The size of the tax is:
A) $125.
B) $65.
C) $190.
D) $200.
Unlock Deck
Unlock for access to all 104 flashcards in this deck.
Unlock Deck
k this deck
41
If the government subsidizes the production of a good:
A) deadweight loss results because not enough of the good is exchanged.
B) deadweight loss results because too much of the good is exchanged.
C) consumer surplus and producer surplus both fall.
D) total surplus is higher than it would have been without the subsidy.
A) deadweight loss results because not enough of the good is exchanged.
B) deadweight loss results because too much of the good is exchanged.
C) consumer surplus and producer surplus both fall.
D) total surplus is higher than it would have been without the subsidy.
Unlock Deck
Unlock for access to all 104 flashcards in this deck.
Unlock Deck
k this deck
42
If the government quit subsidizing a product, consumer surplus would _____ and producer surplus would _____.
A) increase; decrease
B) decrease; decrease
C) increase; increase
D) decrease; increase
A) increase; decrease
B) decrease; decrease
C) increase; increase
D) decrease; increase
Unlock Deck
Unlock for access to all 104 flashcards in this deck.
Unlock Deck
k this deck
43
Use the following to answer question:
Figure 3.15
(Figure 3.15) Which of the following statements is (are) TRUE?
A) I and II
B) II, III, and IV
C) IV
D) II and IV
Figure 3.15
(Figure 3.15) Which of the following statements is (are) TRUE?
A) I and II
B) II, III, and IV
C) IV
D) II and IV
Unlock Deck
Unlock for access to all 104 flashcards in this deck.
Unlock Deck
k this deck
44
Use the following to answer question:
Figure 3.17
(Figure 3.17) Figure 3.17 shows the effect of a government subsidy. Which of the following statements is (are) TRUE?
A) I and IV
B) I and III
C) III only.
D) II, III, and IV
Figure 3.17
(Figure 3.17) Figure 3.17 shows the effect of a government subsidy. Which of the following statements is (are) TRUE?
A) I and IV
B) I and III
C) III only.
D) II, III, and IV
Unlock Deck
Unlock for access to all 104 flashcards in this deck.
Unlock Deck
k this deck
45
Use the following to answer question:
Figure 3.18
(Figure 3.18) Answer the following questions:
Figure 3.18
(Figure 3.18) Answer the following questions:
Unlock Deck
Unlock for access to all 104 flashcards in this deck.
Unlock Deck
k this deck
46
The demand and supply of ethanol are given by QD = 8,000 - 2,000P and QS = 1,000P - 1,000, where P is price per gallon and Q measures gallons per minute. If the government subsidizes ethanol at $0.30 per gallon, what is the deadweight loss?
A) $30
B) $7,800
C) $440
D) $119
A) $30
B) $7,800
C) $440
D) $119
Unlock Deck
Unlock for access to all 104 flashcards in this deck.
Unlock Deck
k this deck
47
Which of the following payroll taxes would be most beneficial for workers (e.g., provide the highest after-tax wage)?
A) 5% on workers and 10% on employers
B) 9% on workers and 6% on employers
C) 12% on workers and 1% on employers
D) 2% on workers and 14% on employers
A) 5% on workers and 10% on employers
B) 9% on workers and 6% on employers
C) 12% on workers and 1% on employers
D) 2% on workers and 14% on employers
Unlock Deck
Unlock for access to all 104 flashcards in this deck.
Unlock Deck
k this deck
48
The supply and demand for squash are given by QD = 200,000 - 50,000P and QS = 90,000P - 80,000, where P is price per pound and Q measures pounds of squash.
Unlock Deck
Unlock for access to all 104 flashcards in this deck.
Unlock Deck
k this deck
49
The demand and supply curves for a product are QD = 50 - 0.5P and QS = 2.5P + 5, where P is the price per unit and Q measures millions of units. If the government levies a $1.20 per unit tax on buyers, what is the size of the deadweight loss?
A) $300,000
B) $500,000
C) $800,000
D) $1.2 million
A) $300,000
B) $500,000
C) $800,000
D) $1.2 million
Unlock Deck
Unlock for access to all 104 flashcards in this deck.
Unlock Deck
k this deck
50
At the equilibrium price of $10, the elasticity of demand and supply are -0.9 and 1.10. If the government institutes a tax of $1 per unit, sellers will receive _____ and consumers will pay _____.
A) $9.55; $10.55
B) $10.25; $11.25
C) $9.80; $10.80
D) $9.75; $10.75
A) $9.55; $10.55
B) $10.25; $11.25
C) $9.80; $10.80
D) $9.75; $10.75
Unlock Deck
Unlock for access to all 104 flashcards in this deck.
Unlock Deck
k this deck
51
The demand and supply of ethanol are given by QD = 8,000 - 2,000P and QS = 1,000P - 1,000, where P is price per gallon and Q measures gallons per minute. What does it cost the government to subsidize ethanol at $0.30 a gallon?
A) $660 per minute
B) $14,000 per minute
C) $150 per minute
D) $2,000 per minute
A) $660 per minute
B) $14,000 per minute
C) $150 per minute
D) $2,000 per minute
Unlock Deck
Unlock for access to all 104 flashcards in this deck.
Unlock Deck
k this deck
52
Use the following to answer question:
Figure 3.19
(Figure 3.19) Refer to Figure 3.19 to answer the following question:
Figure 3.19
(Figure 3.19) Refer to Figure 3.19 to answer the following question:
Unlock Deck
Unlock for access to all 104 flashcards in this deck.
Unlock Deck
k this deck
53
The price elasticity of demand is -1.25, and the share of the tax borne by consumers is 0.80. What is the price elasticity of supply?
A) 6
B) 5
C) 1.56
D) 1.
A) 6
B) 5
C) 1.56
D) 1.
Unlock Deck
Unlock for access to all 104 flashcards in this deck.
Unlock Deck
k this deck
54
If the legal burden of a tax is passed from sellers to buyers:
A) the price paid by buyers will rise.
B) the price paid by sellers will fall.
C) the equilibrium quantity falls.
D) deadweight loss is unchanged.
A) the price paid by buyers will rise.
B) the price paid by sellers will fall.
C) the equilibrium quantity falls.
D) deadweight loss is unchanged.
Unlock Deck
Unlock for access to all 104 flashcards in this deck.
Unlock Deck
k this deck
55
The demand and supply of movie tickets are given by QD = 30 - 3P and QS = 4P - 19, where P is the price per ticket and Q is in thousands of tickets. If the government places a $1 tax on each ticket, the prices that consumers pay with and without the tax are _____ and _____, respectively.
A) $8; $7
B) $7.57; $7
C) $7.50; $6.80
D) $4.30; $3.80
A) $8; $7
B) $7.57; $7
C) $7.50; $6.80
D) $4.30; $3.80
Unlock Deck
Unlock for access to all 104 flashcards in this deck.
Unlock Deck
k this deck
56
Use the following to answer question:
Figure 3.20
(Figure 3.20) Refer to Figure 3.20 to answer the following questions:
Figure 3.20
(Figure 3.20) Refer to Figure 3.20 to answer the following questions:
Unlock Deck
Unlock for access to all 104 flashcards in this deck.
Unlock Deck
k this deck
57
The government wants to transfer welfare from buyers to sellers by collecting a $1 tax on a good from buyers and subsidizing sellers $1 for each unit of the good sold. This policy will:
A) decrease the equilibrium price.
B) increase the equilibrium price.
C) decrease the equilibrium quantity.
D) increase the equilibrium quantity.
A) decrease the equilibrium price.
B) increase the equilibrium price.
C) decrease the equilibrium quantity.
D) increase the equilibrium quantity.
Unlock Deck
Unlock for access to all 104 flashcards in this deck.
Unlock Deck
k this deck
58
The demand and supply of pickles are given by QD = 300 - 500P and QS = 400P - 150, where P is the price per pickle and Q measures the quantity of pickles in millions. Suppose the government creates a subsidy of $0.25 per pickle. Which of the following statements are TRUE?
A) II, III, and IV
B) I and III
C) II and IV
D) I, III, and IV
A) II, III, and IV
B) I and III
C) II and IV
D) I, III, and IV
Unlock Deck
Unlock for access to all 104 flashcards in this deck.
Unlock Deck
k this deck
59
If the government subsidizes a product, what is the relationship between the price that buyers pay (PB) and the price that sellers receive (PS)?
A) PB + subsidy = PS
B) PB + PS = subsidy
C) PB = PS + subsidy
D) PB (1 + subsidy) = PS
A) PB + subsidy = PS
B) PB + PS = subsidy
C) PB = PS + subsidy
D) PB (1 + subsidy) = PS
Unlock Deck
Unlock for access to all 104 flashcards in this deck.
Unlock Deck
k this deck
60
Use the following to answer question:
Figure 3.16
(Figure 3.16) Which of the following statements is (are) TRUE?
A) I, II, and III
B) I and III
C) II and III
D) I
Figure 3.16
(Figure 3.16) Which of the following statements is (are) TRUE?
A) I, II, and III
B) I and III
C) II and III
D) I
Unlock Deck
Unlock for access to all 104 flashcards in this deck.
Unlock Deck
k this deck
61
The supply and demand for solar panels are given by QS = 5P - 5,000 and QD = 15,000 - 5P, where P is price per solar panel and Q measures the quantity of solar panels. Suppose the government provides a $500 subsidy per solar panel.
Unlock Deck
Unlock for access to all 104 flashcards in this deck.
Unlock Deck
k this deck
62
Answer the following questions regarding taxes.
Unlock Deck
Unlock for access to all 104 flashcards in this deck.
Unlock Deck
k this deck
63
Use the following to answer question:
Figure 3.23
(Figure 3.23) Use Figure 3.23 to answer the following questions:
Figure 3.23
(Figure 3.23) Use Figure 3.23 to answer the following questions:
Unlock Deck
Unlock for access to all 104 flashcards in this deck.
Unlock Deck
k this deck
64
Use the following to answer question:
Figure 3.21
(Figure 3.21) Refer to Figure 3.21 to answer the following questions:
Figure 3.21
(Figure 3.21) Refer to Figure 3.21 to answer the following questions:
Unlock Deck
Unlock for access to all 104 flashcards in this deck.
Unlock Deck
k this deck
65
The supply curve for pizza on the local college campus is represented by QS = -2,500 + 210P. At a price of $14, the total producer surplus for the college campus would be $_____.
Unlock Deck
Unlock for access to all 104 flashcards in this deck.
Unlock Deck
k this deck
66
Many U.S. states have minimum price laws for cigarettes. Assume that the demand equation for cigarettes is QD = 4,000 - 300P and the supply equation is QS = -1,000 + 200P, with quantity in thousands of packs. The number of cigarette packs actually sold when a binding price floor of $12 is applied to this market will be _____.
Unlock Deck
Unlock for access to all 104 flashcards in this deck.
Unlock Deck
k this deck
67
Use the following to answer question:
Figure 3.26
(Figure 3.26) Use Figure 3.26 to answer the following questions.
Figure 3.26
(Figure 3.26) Use Figure 3.26 to answer the following questions.
Unlock Deck
Unlock for access to all 104 flashcards in this deck.
Unlock Deck
k this deck
68
The demand curve for pizza on the college campus is represented by QD = 1,000 - 40P. At a price of $14, the total consumer surplus for the college campus would be $_____.
Unlock Deck
Unlock for access to all 104 flashcards in this deck.
Unlock Deck
k this deck
69
The market for cigars is characterized by QD = 10 - 0.25P and QS = 0.15P, where P is price per box of cigars and Q measures boxes per hour.
Unlock Deck
Unlock for access to all 104 flashcards in this deck.
Unlock Deck
k this deck
70
The market for cookies is represented by the following supply and demand conditions:
QD = 1,000 - 200P and QS = 400P - 200, where P is price per box of cookies and Q measures boxes per day.
QD = 1,000 - 200P and QS = 400P - 200, where P is price per box of cookies and Q measures boxes per day.
Unlock Deck
Unlock for access to all 104 flashcards in this deck.
Unlock Deck
k this deck
71
Use the following to answer question:
Figure 3.22
(Figure 3.22) Suppose the government sets a price ceiling of $10.
Figure 3.22
(Figure 3.22) Suppose the government sets a price ceiling of $10.
Unlock Deck
Unlock for access to all 104 flashcards in this deck.
Unlock Deck
k this deck
72
The supply and demand for organic peanut butter are QD = 70 - 5P and QS = 5P, where P is price per jar and Q is in hundreds of jars per day. The government decides to impose either a $1 supply subsidy or a price floor equal to $7.50. The producer surplus associated with the price floor would be _____. (Round your answer to the nearest cent.)
Unlock Deck
Unlock for access to all 104 flashcards in this deck.
Unlock Deck
k this deck
73
Use the following to answer question:
Figure 3.25
(Figure 3.25) Refer to Figure 3.25 to answer the following questions:
Figure 3.25
(Figure 3.25) Refer to Figure 3.25 to answer the following questions:
Unlock Deck
Unlock for access to all 104 flashcards in this deck.
Unlock Deck
k this deck
74
In the market for cotton, the quantity demanded and quantity supplied are expressed mathematically as QD = 400 - 250P and QS = 250P - 100, where P is the price per pound of cotton and Q measures pounds of cotton. Suppose the government sets a price ceiling of $0.50 per pound of cotton.
Unlock Deck
Unlock for access to all 104 flashcards in this deck.
Unlock Deck
k this deck
75
Explain why taxes cause deadweight losses.
Unlock Deck
Unlock for access to all 104 flashcards in this deck.
Unlock Deck
k this deck
76
Use the following to answer question:
Figure 3.24
(Figure 3.24) In Figure 3.24, Spriv represents the supply of health care visits at private clinics and Stotal represents the total supply of health care visits at private and government-operated clinics.
Figure 3.24
(Figure 3.24) In Figure 3.24, Spriv represents the supply of health care visits at private clinics and Stotal represents the total supply of health care visits at private and government-operated clinics.
Unlock Deck
Unlock for access to all 104 flashcards in this deck.
Unlock Deck
k this deck
77
The supply and demand for almonds are QD = 80 - 10P and QS = 10P, where P is price per bag and Q measures hundreds of bags per day.
Unlock Deck
Unlock for access to all 104 flashcards in this deck.
Unlock Deck
k this deck
78
The supply and demand for 9-volt batteries are given by QD = 230 - 10P and QS = 30P - 10, where P is the price per four-pack and Q measures the number of four-packs.
Unlock Deck
Unlock for access to all 104 flashcards in this deck.
Unlock Deck
k this deck
79
Suppose the market for soda is represented by the following supply and demand equations:
QS = 35P - 39.75 and QD = 10.25 - 5P, where P is price per bottle and Q measures bottles per second.
QS = 35P - 39.75 and QD = 10.25 - 5P, where P is price per bottle and Q measures bottles per second.
Unlock Deck
Unlock for access to all 104 flashcards in this deck.
Unlock Deck
k this deck
80
The first snow blower was sold in 1927. How did the sale of the snow blower affect on the demand curve and the consumer surplus for snow shovels?
Unlock Deck
Unlock for access to all 104 flashcards in this deck.
Unlock Deck
k this deck
Unlock Deck
Unlock for access to all 104 flashcards in this deck.


