Deck 3: Graphical Methods for Describing Data
Full screen (f)
Question
Question
One of the "media messages" sent by television is that appearance is a very important aspect of one's being. These messages are thought to spur young women to have unrealistic expectations about beauty, thus spending billions of dollars on cosmetics and toiletries. Some of these messages were studied during the 1999-2000 prime-time television season, when investigators kept track of the "appearance" comments. Some of their data, comments by males, classified by gender of recipient and type of appearance comment, is reproduced in the table below. 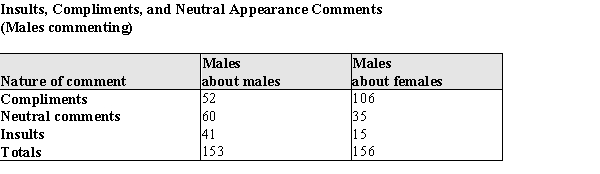 (a) Construct two pie charts, one for comments about males, one for comments about females, to summarize the data above. (b) Using the information in the table above and the pie charts in part (a), display the given information in a comparative bar chart. In the same study of appearance comments mentioned, comments by females were tabulated. That data appears below:
 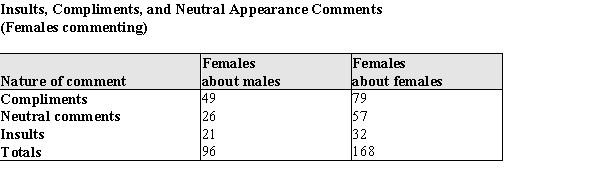 (c) Display these data in a segmented bar chart to compare the distribution of comments in these two samples. (d) Based on the information from the graphs in parts (a) - (c), how do the distributions differ when men rather than women are making the comments, and how do they differ when men rather than women are the recipients of the comments?
(a) Construct two pie charts, one for comments about males, one for comments about females, to summarize the data above. (b) Using the information in the table above and the pie charts in part (a), display the given information in a comparative bar chart. In the same study of appearance comments mentioned, comments by females were tabulated. That data appears below: (c) Display these data in a segmented bar chart to compare the distribution of comments in these two samples. (d) Based on the information from the graphs in parts (a) - (c), how do the distributions differ when men rather than women are making the comments, and how do they differ when men rather than women are the recipients of the comments? Question
Would you say that most lawyers in this country are really interested in the public good, or are most lawyers just out to make a lot of money? The following table summarizes the responses to the lawyer question when these questions were asked in different orders. 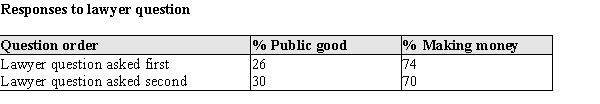 (a) Construct a comparative bar chart for these response percentages. (b) Interpret the results of the 1974 survey. Do you think the order of the questions made a difference in the responses? Explain.
(a) Construct a comparative bar chart for these response percentages. (b) Interpret the results of the 1974 survey. Do you think the order of the questions made a difference in the responses? Explain. Question
In recent years there has been a change in the grocery shopping habits of shoppers. "Non-traditional" stores such as gas stations and Wal-Marts are now selling groceries. The stacked bar chart below shows the percentages of market share for Traditional, Non-traditional, and Convenience stores for 1988 and 2005. 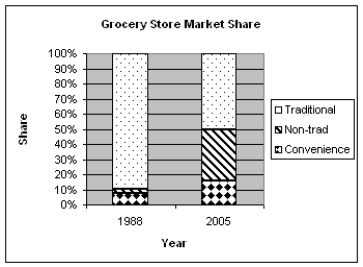 (a) In a few sentences describe how the proportions of market share have changed for traditional grocery stores from 1988 to 2005. (b) The market share for which type of store has grown the most, compared to their market share in 1988. What aspect of the chart shows this?
(a) In a few sentences describe how the proportions of market share have changed for traditional grocery stores from 1988 to 2005. (b) The market share for which type of store has grown the most, compared to their market share in 1988. What aspect of the chart shows this? Question
In 1986 marine biologists reported the discovery of a new species of fish in the Western North Atlantic. Data on the head length (n = 41) and pelvic fin length (n = 30) are shown below. 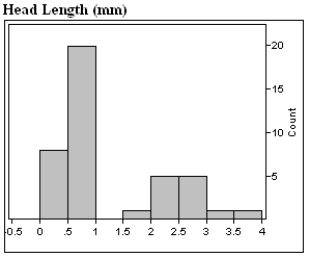
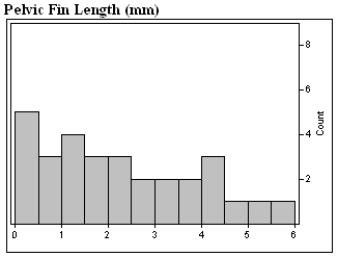 a) Describe in appropriate statistical terms, the distributions of these two variables. b) The distribution of head lengths certainly appears to be rather strange. What do you think might account for the shape of this distribution?
a) Describe in appropriate statistical terms, the distributions of these two variables. b) The distribution of head lengths certainly appears to be rather strange. What do you think might account for the shape of this distribution? Question
Ruminants are hoofed animals such as cattle and sheep. Two categories of ruminants are browsers (leaf eaters) and grazers (grass eaters). Some biologists believe that the incisor arcade, that part of the mouth between the incisors, is shaped differently for browsers and grazers, and that might explain their food selection. The "curvature" of an incisor arcade is a measure of its shape, with large values indicating a long, thin mouth, and small values a shorter, wider mouth. The back-to-back stem plot below compares the curvatures of incisor arcades of a sample of species of browsers and grazers in the ruminant family. 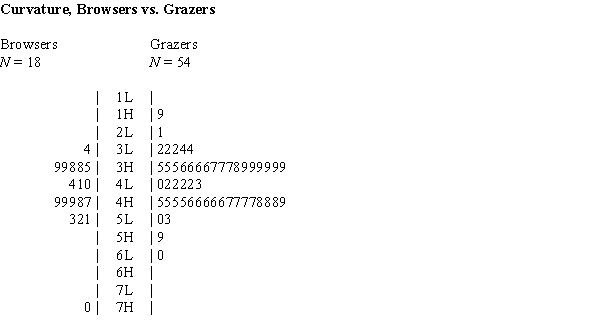 (a) Briefly describe each of the two curvature distributions, browsers and grazers, noting any unusual features of the data. (b) The theory of some biologists is that browsers have thinner mouths because the browse plants frequently have thorns and spines; browsers have evolved to have thinner mouths to get beyond the thorns and spines to the food part of the plant. Is the data in the back-to-back stem plot consistent with this theory? What aspect of the data would you consider when answering this question?
(a) Briefly describe each of the two curvature distributions, browsers and grazers, noting any unusual features of the data. (b) The theory of some biologists is that browsers have thinner mouths because the browse plants frequently have thorns and spines; browsers have evolved to have thinner mouths to get beyond the thorns and spines to the food part of the plant. Is the data in the back-to-back stem plot consistent with this theory? What aspect of the data would you consider when answering this question? Question
The stem plot below displays the weights (in ounces) of a random sample of tomatoes grown on a local farm 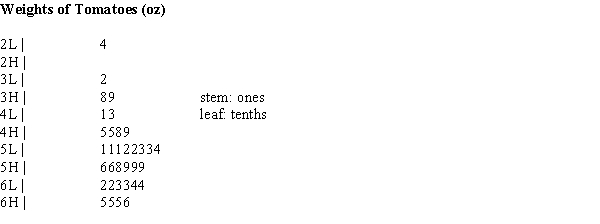 (a) Briefly describe the distribution of tomato weights. (b) What is the weight of the heaviest tomato in the sample?
(a) Briefly describe the distribution of tomato weights. (b) What is the weight of the heaviest tomato in the sample? Question
Question
Question
Each person in a sample of 800 students who identified themselves as Democrats was asked about his or her mother's political party. The responses are summarized in the following table:  Construct and sketch a pie chart for these data.
Construct and sketch a pie chart for these data. Question
Investigators writing in the Journal of Early Adolescence were interested in the communication about sex and related topics between parents and 12-14 year olds. The investigators asked students and parents whether or not they had communicated with their child/parent about topics such as pregnancy, how to say "no," and methods of contraception. A scatter plot of their data is presented below. Each point represents one topic listed by the investigators. For example, 72.4% of parents and 57.6% of adolescents said the parents had discussed childbirth. This would be recorded as the point (57.6, 72.4). 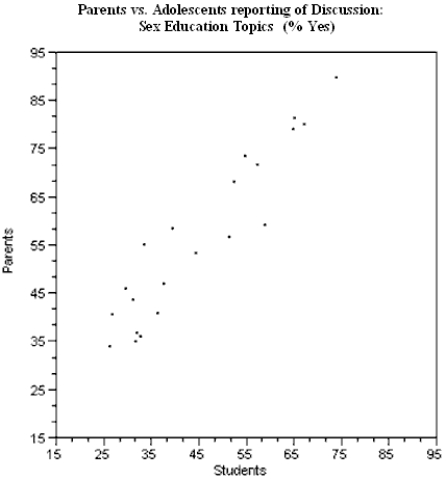 (a) On the graph above, sketch the line y = x, representing a line of "perfect agreement" between the parents and adolescents. (b) What explanation do you have for the placement of the points in the scatter plot relative to the line you sketched in part (a)?
(a) On the graph above, sketch the line y = x, representing a line of "perfect agreement" between the parents and adolescents. (b) What explanation do you have for the placement of the points in the scatter plot relative to the line you sketched in part (a)? Question
Question
A statewide survey released by the University of Iowa Injury Prevention Research Center was designed to assess compliance with Iowa seatbelt law. The table below shows the results for 5 Iowa cities. 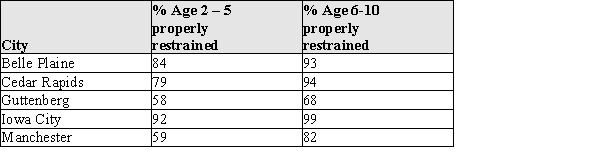 (a) Display these data in a comparative bar chart so that the different ages can be compared for the different cities. (b) Write a brief description of the differences and similarities in the patterns you observe in your bar chart for part (a).
(a) Display these data in a comparative bar chart so that the different ages can be compared for the different cities. (b) Write a brief description of the differences and similarities in the patterns you observe in your bar chart for part (a). Question
An experiment was performed to determine which brand of comparably priced light bulbs, A or B, lasts longer on average. Ten bulbs of each brand were tested, and their lifetimes recorded in hours. The data are shown below:  (a) Display these data using a comparative (back-to-back) stemplot. (b) What are the differences and similarities in the lifetime distributions for the two samples? (c) If your preference for brand A or B must be determined from the information in parts (a) and (b), which brand would you buy? Explain your choice using appropriate statistical terminology.
(a) Display these data using a comparative (back-to-back) stemplot. (b) What are the differences and similarities in the lifetime distributions for the two samples? (c) If your preference for brand A or B must be determined from the information in parts (a) and (b), which brand would you buy? Explain your choice using appropriate statistical terminology. Question
The quantity 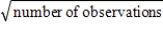 often gives a rough estimate of the appropriate number of intervals in a histogram.
often gives a rough estimate of the appropriate number of intervals in a histogram. Question
Question
Question
Question
Exhibit 3-4 There has been a recent increase in the popularity of caffeine-containing "energy drinks" or "functional beverages"--substances that are considered to be food that may provide some health benefit. However, caffeine in these drinks presents an important health concern, especially for women of childbearing age. Studies have shown an increased risk of spontaneous abortion and low birth weight children to women consuming more than 150 mg/day of caffeine. In a recent study, eighteen 12-oz servings of different brands of carbonated sodas were analyzed to ascertain their caffeine content, with the results presented below. The data are in mg/12-oz serving; if no caffeine was detected, this is reported as "* mg/serving."
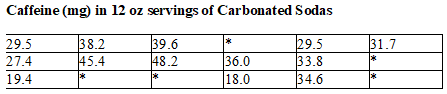
In the study referenced in Exhibit 3-4, the caffeine content of one popular brand of carbonated soda sold in fountain form at nine fast-food chains was also analyzed. The caffeine levels (expressed as mg / 12 oz serving) of the soda in fountain form are listed in the table below.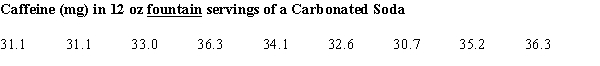 a) Construct a comparative (back to back) stem & leaf plot for the container vs. fountain amounts of caffeine. (Do not use the data for carbonated sodas where caffeine was not detected.) Describe how the two distributions compare. (b) What do you think might explain the differences between the two distributions?
In the study referenced in Exhibit 3-4, the caffeine content of one popular brand of carbonated soda sold in fountain form at nine fast-food chains was also analyzed. The caffeine levels (expressed as mg / 12 oz serving) of the soda in fountain form are listed in the table below.
a) Construct a comparative (back to back) stem & leaf plot for the container vs. fountain amounts of caffeine. (Do not use the data for carbonated sodas where caffeine was not detected.) Describe how the two distributions compare. (b) What do you think might explain the differences between the two distributions? Question
Question
Consider the time series plot. Determine what is incorrect on the plot. 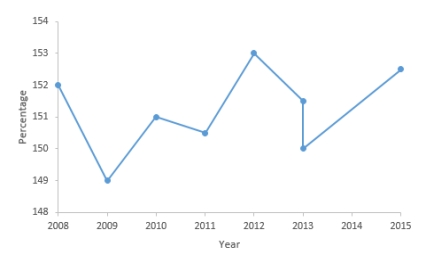
A) There are two different observations for the same year.
B) Incorrect percentage values on the vertical axis.
C) The variables have different value ranges.
D) The axes do not intersect at the point (0, 0).
A) There are two different observations for the same year.
B) Incorrect percentage values on the vertical axis.
C) The variables have different value ranges.
D) The axes do not intersect at the point (0, 0).
Question
Each year Anna conducts a poll among the children in a school in which she asks how many countries in Eastern Europe they know. The information from one poll has been used to estimate that during the first half of 2013, on average 5.25% of respondents could name at least 5 countries in Eastern Europe. Estimates for the years 2004 to 2017 are also provided, as shown in the accompanying table. 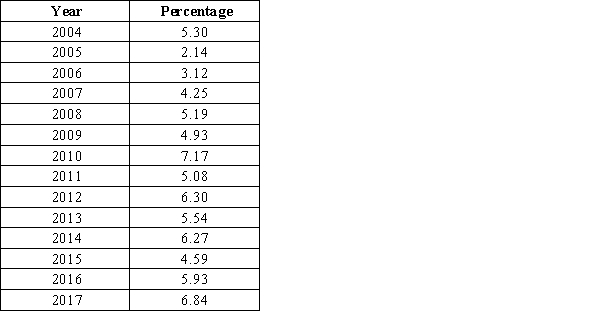 Having constructed a time series plot for these data, describe the trend in the percent of children who could name at least 5 countries in Eastern Europe over time.
A) The time series plot shows that the percentage has steadily increased year to year.
B) The time series plot shows that the percentage has not steadily increased year to year, although there does appear to be a general upward trend following the drop that occurred in 2005.
C) The time series plot shows that the percentage has not steadily decreased year to year, although there does appear to be a general downward trend following the rise that occurred in 2010.
D) The time series plot shows that the percentage has steadily decreased year to year.
Having constructed a time series plot for these data, describe the trend in the percent of children who could name at least 5 countries in Eastern Europe over time. A) The time series plot shows that the percentage has steadily increased year to year.
B) The time series plot shows that the percentage has not steadily increased year to year, although there does appear to be a general upward trend following the drop that occurred in 2005.
C) The time series plot shows that the percentage has not steadily decreased year to year, although there does appear to be a general downward trend following the rise that occurred in 2010.
D) The time series plot shows that the percentage has steadily decreased year to year.
Question
A student conducted a survey among different groups of people in his town in which he asked how many times per year they visit the theater. 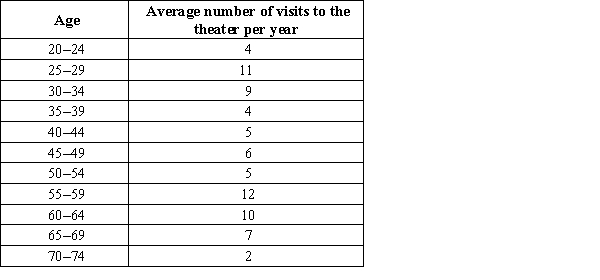 The accompanying table provides data on the age and average number of visits to the theater per year. Construct a scatterplot of x = age and y = number of visits to the theater per year. Does age appear to be related to the average number of visits to the theater per year?
A) There appears to be no tendency for the number of visits to the theater to increase or decrease as age increases.
B) There appears to be a strong tendency for the number of visits to the theater to increase as age increases.
C) There appears to be a strong tendency for the number of visits to the theater to decrease as age increases.
The accompanying table provides data on the age and average number of visits to the theater per year. Construct a scatterplot of x = age and y = number of visits to the theater per year. Does age appear to be related to the average number of visits to the theater per year? A) There appears to be no tendency for the number of visits to the theater to increase or decrease as age increases.
B) There appears to be a strong tendency for the number of visits to the theater to increase as age increases.
C) There appears to be a strong tendency for the number of visits to the theater to decrease as age increases.
Question
As part of the United States Census, data is also collected on the number of persons in each household. The census data for four decades is summarized below. 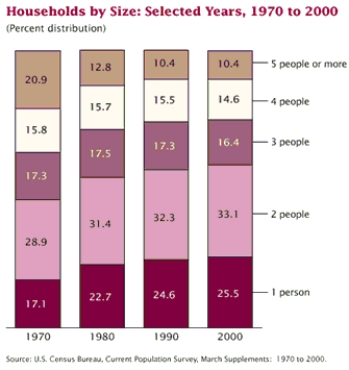 (a) In a few sentences describe how the proportion of households with 4 people has changed from 1970 to 2000. (b) What size of household appears to have decreased the most from 1970 to 2000?
(a) In a few sentences describe how the proportion of households with 4 people has changed from 1970 to 2000. (b) What size of household appears to have decreased the most from 1970 to 2000? Question
Exhibit 3-5 In birds, the muscles that pull the wing down, and thus cause the actual flight, are the "large pectorals." In the article, "Dimensional Relationships for Flying Animals," the author reports the following pectoral muscle weight in grams for birds of prey (Rapaces diurnes voiliers.) 
In the article referenced in Exhibit 3-5, the wing areas in square centimeters of gliding birds of prey are reported. Night hunters are distinguished from the birds that hunt during the daylight hours, and the wing areas for samples of each type of bird are displayed in the following table: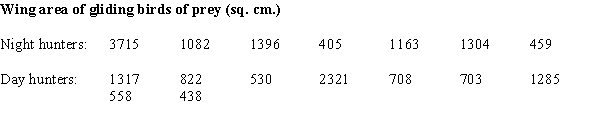 a) Construct a comparative (back to back) stem & leaf plot for the wing area for the two types of birds. (b) Biologists speculate that since birds could be detected at a distance by their prey during the day, the species that hunt during the day should be smaller on average than those that hunt at night. Are the data as displayed in part (a) consistent with this theory? What specific aspects of the plot in part (a) support your answer?
In the article referenced in Exhibit 3-5, the wing areas in square centimeters of gliding birds of prey are reported. Night hunters are distinguished from the birds that hunt during the daylight hours, and the wing areas for samples of each type of bird are displayed in the following table:
a) Construct a comparative (back to back) stem & leaf plot for the wing area for the two types of birds. (b) Biologists speculate that since birds could be detected at a distance by their prey during the day, the species that hunt during the day should be smaller on average than those that hunt at night. Are the data as displayed in part (a) consistent with this theory? What specific aspects of the plot in part (a) support your answer?
Unlock Deck
Sign up to unlock the cards in this deck!
Unlock Deck
Unlock Deck
1/25
Play
Full screen (f)
Deck 3: Graphical Methods for Describing Data
1
One advantage of histograms is that they may be used for large data sets.
True
2
One of the "media messages" sent by television is that appearance is a very important aspect of one's being. These messages are thought to spur young women to have unrealistic expectations about beauty, thus spending billions of dollars on cosmetics and toiletries. Some of these messages were studied during the 1999-2000 prime-time television season, when investigators kept track of the "appearance" comments. Some of their data, comments by males, classified by gender of recipient and type of appearance comment, is reproduced in the table below. (a) Construct two pie charts, one for comments about males, one for comments about females, to summarize the data above. (b) Using the information in the table above and the pie charts in part (a), display the given information in a comparative bar chart. In the same study of appearance comments mentioned, comments by females were tabulated. That data appears below: (c) Display these data in a segmented bar chart to compare the distribution of comments in these two samples. (d) Based on the information from the graphs in parts (a) - (c), how do the distributions differ when men rather than women are making the comments, and how do they differ when men rather than women are the recipients of the comments?
(a) Construct two pie charts, one for comments about males, one for comments about females, to summarize the data above. (b) Using the information in the table above and the pie charts in part (a), display the given information in a comparative bar chart. In the same study of appearance comments mentioned, comments by females were tabulated. That data appears below: (c) Display these data in a segmented bar chart to compare the distribution of comments in these two samples. (d) Based on the information from the graphs in parts (a) - (c), how do the distributions differ when men rather than women are making the comments, and how do they differ when men rather than women are the recipients of the comments?a) Comparative pie charts for comments about males and females: 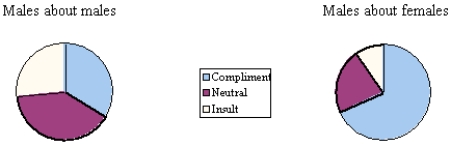
b) Comparative bar chart for comments about males and females: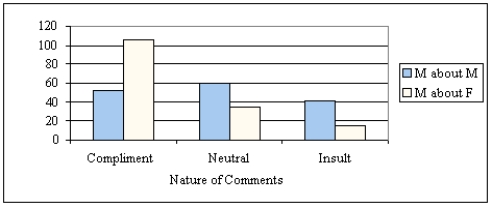
c)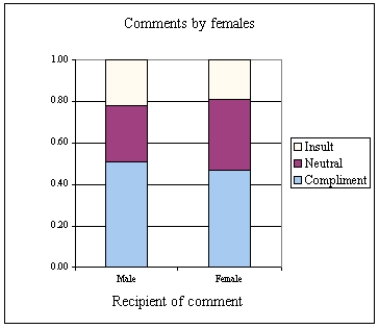
d) For the gender of the maker of the comments: Men's comments differ sharply depending upon the gender of the recipient. Men making comments are much more likely to be complimentary to a female, and rarely offer insulting comments, whereas men are much more likely to be critical of other men. Women who make comments do so with about the same pattern whether the recipient is male or female. For the gender of the recipient of the comments: Women recipients are much more likely to get compliments than an insult. For male recipients, the three categories are about evenly distributed, meaning a male can expect an insult about as frequently as a compliment.
3
Would you say that most lawyers in this country are really interested in the public good, or are most lawyers just out to make a lot of money? The following table summarizes the responses to the lawyer question when these questions were asked in different orders. (a) Construct a comparative bar chart for these response percentages. (b) Interpret the results of the 1974 survey. Do you think the order of the questions made a difference in the responses? Explain.
(a) Construct a comparative bar chart for these response percentages. (b) Interpret the results of the 1974 survey. Do you think the order of the questions made a difference in the responses? Explain.a) Comparative bar chart: 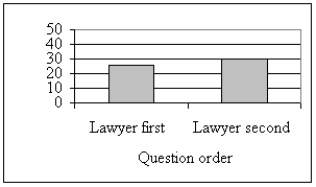 b) There is only a small difference that is shown in this data, from 26% to 30%. The order of the questions has not made much of a difference in the responses to the question in this case.
b) There is only a small difference that is shown in this data, from 26% to 30%. The order of the questions has not made much of a difference in the responses to the question in this case. 4
In recent years there has been a change in the grocery shopping habits of shoppers. "Non-traditional" stores such as gas stations and Wal-Marts are now selling groceries. The stacked bar chart below shows the percentages of market share for Traditional, Non-traditional, and Convenience stores for 1988 and 2005. (a) In a few sentences describe how the proportions of market share have changed for traditional grocery stores from 1988 to 2005. (b) The market share for which type of store has grown the most, compared to their market share in 1988. What aspect of the chart shows this?
(a) In a few sentences describe how the proportions of market share have changed for traditional grocery stores from 1988 to 2005. (b) The market share for which type of store has grown the most, compared to their market share in 1988. What aspect of the chart shows this? Unlock Deck
Unlock for access to all 25 flashcards in this deck.
Unlock Deck
k this deck
5
In 1986 marine biologists reported the discovery of a new species of fish in the Western North Atlantic. Data on the head length (n = 41) and pelvic fin length (n = 30) are shown below. a) Describe in appropriate statistical terms, the distributions of these two variables. b) The distribution of head lengths certainly appears to be rather strange. What do you think might account for the shape of this distribution?
a) Describe in appropriate statistical terms, the distributions of these two variables. b) The distribution of head lengths certainly appears to be rather strange. What do you think might account for the shape of this distribution? Unlock Deck
Unlock for access to all 25 flashcards in this deck.
Unlock Deck
k this deck
6
Ruminants are hoofed animals such as cattle and sheep. Two categories of ruminants are browsers (leaf eaters) and grazers (grass eaters). Some biologists believe that the incisor arcade, that part of the mouth between the incisors, is shaped differently for browsers and grazers, and that might explain their food selection. The "curvature" of an incisor arcade is a measure of its shape, with large values indicating a long, thin mouth, and small values a shorter, wider mouth. The back-to-back stem plot below compares the curvatures of incisor arcades of a sample of species of browsers and grazers in the ruminant family. (a) Briefly describe each of the two curvature distributions, browsers and grazers, noting any unusual features of the data. (b) The theory of some biologists is that browsers have thinner mouths because the browse plants frequently have thorns and spines; browsers have evolved to have thinner mouths to get beyond the thorns and spines to the food part of the plant. Is the data in the back-to-back stem plot consistent with this theory? What aspect of the data would you consider when answering this question?
(a) Briefly describe each of the two curvature distributions, browsers and grazers, noting any unusual features of the data. (b) The theory of some biologists is that browsers have thinner mouths because the browse plants frequently have thorns and spines; browsers have evolved to have thinner mouths to get beyond the thorns and spines to the food part of the plant. Is the data in the back-to-back stem plot consistent with this theory? What aspect of the data would you consider when answering this question? Unlock Deck
Unlock for access to all 25 flashcards in this deck.
Unlock Deck
k this deck
7
The stem plot below displays the weights (in ounces) of a random sample of tomatoes grown on a local farm (a) Briefly describe the distribution of tomato weights. (b) What is the weight of the heaviest tomato in the sample?
(a) Briefly describe the distribution of tomato weights. (b) What is the weight of the heaviest tomato in the sample? Unlock Deck
Unlock for access to all 25 flashcards in this deck.
Unlock Deck
k this deck
8
If the upper tail of a distribution stretches out farther than the lower tail, the distribution is negatively skewed.
Unlock Deck
Unlock for access to all 25 flashcards in this deck.
Unlock Deck
k this deck
9
An outlier is an unusually small or large data value.
Unlock Deck
Unlock for access to all 25 flashcards in this deck.
Unlock Deck
k this deck
10
Each person in a sample of 800 students who identified themselves as Democrats was asked about his or her mother's political party. The responses are summarized in the following table: Construct and sketch a pie chart for these data.
Construct and sketch a pie chart for these data. Unlock Deck
Unlock for access to all 25 flashcards in this deck.
Unlock Deck
k this deck
11
Investigators writing in the Journal of Early Adolescence were interested in the communication about sex and related topics between parents and 12-14 year olds. The investigators asked students and parents whether or not they had communicated with their child/parent about topics such as pregnancy, how to say "no," and methods of contraception. A scatter plot of their data is presented below. Each point represents one topic listed by the investigators. For example, 72.4% of parents and 57.6% of adolescents said the parents had discussed childbirth. This would be recorded as the point (57.6, 72.4). (a) On the graph above, sketch the line y = x, representing a line of "perfect agreement" between the parents and adolescents. (b) What explanation do you have for the placement of the points in the scatter plot relative to the line you sketched in part (a)?
(a) On the graph above, sketch the line y = x, representing a line of "perfect agreement" between the parents and adolescents. (b) What explanation do you have for the placement of the points in the scatter plot relative to the line you sketched in part (a)? Unlock Deck
Unlock for access to all 25 flashcards in this deck.
Unlock Deck
k this deck
12
A pie chart is most useful for numeric data.
Unlock Deck
Unlock for access to all 25 flashcards in this deck.
Unlock Deck
k this deck
13
A statewide survey released by the University of Iowa Injury Prevention Research Center was designed to assess compliance with Iowa seatbelt law. The table below shows the results for 5 Iowa cities. (a) Display these data in a comparative bar chart so that the different ages can be compared for the different cities. (b) Write a brief description of the differences and similarities in the patterns you observe in your bar chart for part (a).
(a) Display these data in a comparative bar chart so that the different ages can be compared for the different cities. (b) Write a brief description of the differences and similarities in the patterns you observe in your bar chart for part (a). Unlock Deck
Unlock for access to all 25 flashcards in this deck.
Unlock Deck
k this deck
14
An experiment was performed to determine which brand of comparably priced light bulbs, A or B, lasts longer on average. Ten bulbs of each brand were tested, and their lifetimes recorded in hours. The data are shown below: (a) Display these data using a comparative (back-to-back) stemplot. (b) What are the differences and similarities in the lifetime distributions for the two samples? (c) If your preference for brand A or B must be determined from the information in parts (a) and (b), which brand would you buy? Explain your choice using appropriate statistical terminology.
(a) Display these data using a comparative (back-to-back) stemplot. (b) What are the differences and similarities in the lifetime distributions for the two samples? (c) If your preference for brand A or B must be determined from the information in parts (a) and (b), which brand would you buy? Explain your choice using appropriate statistical terminology. Unlock Deck
Unlock for access to all 25 flashcards in this deck.
Unlock Deck
k this deck
15
The quantity often gives a rough estimate of the appropriate number of intervals in a histogram.
often gives a rough estimate of the appropriate number of intervals in a histogram. Unlock Deck
Unlock for access to all 25 flashcards in this deck.
Unlock Deck
k this deck
16
In a scatter plot, both the horizontal and vertical axes must be set at zero.
Unlock Deck
Unlock for access to all 25 flashcards in this deck.
Unlock Deck
k this deck
17
For stem and leaf plots with single-digit leaves, commas must be used to separate the leaves.
Unlock Deck
Unlock for access to all 25 flashcards in this deck.
Unlock Deck
k this deck
18
A curve with tails that decline more rapidly than the tails of a normal curve is called a heavy-tailed distribution.
Unlock Deck
Unlock for access to all 25 flashcards in this deck.
Unlock Deck
k this deck
19
Exhibit 3-4 There has been a recent increase in the popularity of caffeine-containing "energy drinks" or "functional beverages"--substances that are considered to be food that may provide some health benefit. However, caffeine in these drinks presents an important health concern, especially for women of childbearing age. Studies have shown an increased risk of spontaneous abortion and low birth weight children to women consuming more than 150 mg/day of caffeine. In a recent study, eighteen 12-oz servings of different brands of carbonated sodas were analyzed to ascertain their caffeine content, with the results presented below. The data are in mg/12-oz serving; if no caffeine was detected, this is reported as "* mg/serving."
In the study referenced in Exhibit 3-4, the caffeine content of one popular brand of carbonated soda sold in fountain form at nine fast-food chains was also analyzed. The caffeine levels (expressed as mg / 12 oz serving) of the soda in fountain form are listed in the table below. a) Construct a comparative (back to back) stem & leaf plot for the container vs. fountain amounts of caffeine. (Do not use the data for carbonated sodas where caffeine was not detected.) Describe how the two distributions compare. (b) What do you think might explain the differences between the two distributions?
In the study referenced in Exhibit 3-4, the caffeine content of one popular brand of carbonated soda sold in fountain form at nine fast-food chains was also analyzed. The caffeine levels (expressed as mg / 12 oz serving) of the soda in fountain form are listed in the table below.
a) Construct a comparative (back to back) stem & leaf plot for the container vs. fountain amounts of caffeine. (Do not use the data for carbonated sodas where caffeine was not detected.) Describe how the two distributions compare. (b) What do you think might explain the differences between the two distributions? Unlock Deck
Unlock for access to all 25 flashcards in this deck.
Unlock Deck
k this deck
20
The density of a class can be calculated by multiplying the relative frequency of the class times the class width.
Unlock Deck
Unlock for access to all 25 flashcards in this deck.
Unlock Deck
k this deck
21
Consider the time series plot. Determine what is incorrect on the plot.
A) There are two different observations for the same year.
B) Incorrect percentage values on the vertical axis.
C) The variables have different value ranges.
D) The axes do not intersect at the point (0, 0).
A) There are two different observations for the same year.
B) Incorrect percentage values on the vertical axis.
C) The variables have different value ranges.
D) The axes do not intersect at the point (0, 0).
Unlock Deck
Unlock for access to all 25 flashcards in this deck.
Unlock Deck
k this deck
22
Each year Anna conducts a poll among the children in a school in which she asks how many countries in Eastern Europe they know. The information from one poll has been used to estimate that during the first half of 2013, on average 5.25% of respondents could name at least 5 countries in Eastern Europe. Estimates for the years 2004 to 2017 are also provided, as shown in the accompanying table. Having constructed a time series plot for these data, describe the trend in the percent of children who could name at least 5 countries in Eastern Europe over time.
A) The time series plot shows that the percentage has steadily increased year to year.
B) The time series plot shows that the percentage has not steadily increased year to year, although there does appear to be a general upward trend following the drop that occurred in 2005.
C) The time series plot shows that the percentage has not steadily decreased year to year, although there does appear to be a general downward trend following the rise that occurred in 2010.
D) The time series plot shows that the percentage has steadily decreased year to year.
Having constructed a time series plot for these data, describe the trend in the percent of children who could name at least 5 countries in Eastern Europe over time. A) The time series plot shows that the percentage has steadily increased year to year.
B) The time series plot shows that the percentage has not steadily increased year to year, although there does appear to be a general upward trend following the drop that occurred in 2005.
C) The time series plot shows that the percentage has not steadily decreased year to year, although there does appear to be a general downward trend following the rise that occurred in 2010.
D) The time series plot shows that the percentage has steadily decreased year to year.
Unlock Deck
Unlock for access to all 25 flashcards in this deck.
Unlock Deck
k this deck
23
A student conducted a survey among different groups of people in his town in which he asked how many times per year they visit the theater. The accompanying table provides data on the age and average number of visits to the theater per year. Construct a scatterplot of x = age and y = number of visits to the theater per year. Does age appear to be related to the average number of visits to the theater per year?
A) There appears to be no tendency for the number of visits to the theater to increase or decrease as age increases.
B) There appears to be a strong tendency for the number of visits to the theater to increase as age increases.
C) There appears to be a strong tendency for the number of visits to the theater to decrease as age increases.
The accompanying table provides data on the age and average number of visits to the theater per year. Construct a scatterplot of x = age and y = number of visits to the theater per year. Does age appear to be related to the average number of visits to the theater per year? A) There appears to be no tendency for the number of visits to the theater to increase or decrease as age increases.
B) There appears to be a strong tendency for the number of visits to the theater to increase as age increases.
C) There appears to be a strong tendency for the number of visits to the theater to decrease as age increases.
Unlock Deck
Unlock for access to all 25 flashcards in this deck.
Unlock Deck
k this deck
24
As part of the United States Census, data is also collected on the number of persons in each household. The census data for four decades is summarized below. (a) In a few sentences describe how the proportion of households with 4 people has changed from 1970 to 2000. (b) What size of household appears to have decreased the most from 1970 to 2000?
(a) In a few sentences describe how the proportion of households with 4 people has changed from 1970 to 2000. (b) What size of household appears to have decreased the most from 1970 to 2000? Unlock Deck
Unlock for access to all 25 flashcards in this deck.
Unlock Deck
k this deck
25
Exhibit 3-5 In birds, the muscles that pull the wing down, and thus cause the actual flight, are the "large pectorals." In the article, "Dimensional Relationships for Flying Animals," the author reports the following pectoral muscle weight in grams for birds of prey (Rapaces diurnes voiliers.)
In the article referenced in Exhibit 3-5, the wing areas in square centimeters of gliding birds of prey are reported. Night hunters are distinguished from the birds that hunt during the daylight hours, and the wing areas for samples of each type of bird are displayed in the following table: a) Construct a comparative (back to back) stem & leaf plot for the wing area for the two types of birds. (b) Biologists speculate that since birds could be detected at a distance by their prey during the day, the species that hunt during the day should be smaller on average than those that hunt at night. Are the data as displayed in part (a) consistent with this theory? What specific aspects of the plot in part (a) support your answer?
In the article referenced in Exhibit 3-5, the wing areas in square centimeters of gliding birds of prey are reported. Night hunters are distinguished from the birds that hunt during the daylight hours, and the wing areas for samples of each type of bird are displayed in the following table:
a) Construct a comparative (back to back) stem & leaf plot for the wing area for the two types of birds. (b) Biologists speculate that since birds could be detected at a distance by their prey during the day, the species that hunt during the day should be smaller on average than those that hunt at night. Are the data as displayed in part (a) consistent with this theory? What specific aspects of the plot in part (a) support your answer? Unlock Deck
Unlock for access to all 25 flashcards in this deck.
Unlock Deck
k this deck
Unlock Deck
Unlock for access to all 25 flashcards in this deck.


