Deck 1: The Role of Statistics and the Data Analysis Process
Full screen (f)
Question
The most important right and responsibility of citizens in a democratic society is voting. The bar chart below shows, for different age groups in the 2000 presidential election in the United States, the percentage of individuals in that age group who are registered to vote. 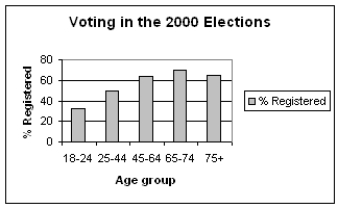 (a) Describe in a few sentences the registration pattern that you see in the data above. (b) Some individuals argue that the reason for the current level of registration in the 18-24 year-old group is that many of them are college students and would have to vote absentee. In your opinion, would that explain the registration level for the 18 - 24 age-group? Why or why not?
(a) Describe in a few sentences the registration pattern that you see in the data above. (b) Some individuals argue that the reason for the current level of registration in the 18-24 year-old group is that many of them are college students and would have to vote absentee. In your opinion, would that explain the registration level for the 18 - 24 age-group? Why or why not? Question
Question
Question
Question
Question
Question
Bird-plane collisions Collisions between birds and airplanes are a major problem, threatening passenger safety and resulting in costly repairs. During the years 1990 - 1994, researchers gathered bird remains from runways at Lihue Airport on the island of Kauai, Hawaii. The data below are counts of birds found on the runway used for takeoffs and the runway used for landings from the 4 most frequently involved species: 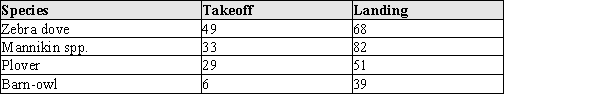 (a) Construct a bar chart to display the bird species data for the landing runway. (b) Construct a relative frequency distribution (table) representing the bird species data for the takeoff runway.
(a) Construct a bar chart to display the bird species data for the landing runway. (b) Construct a relative frequency distribution (table) representing the bird species data for the takeoff runway. Question
Question
Question
The most important right and responsibility of citizens in a democratic society is voting. The bar chart below shows, for different age groups in the 2000 presidential election in the United States, the percentage of individuals in that age group who actually voted. 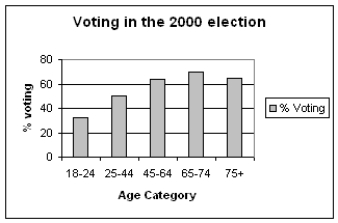 (a) Describe in a few sentences the voting pattern that you see in the data above. (b) Some individuals argue that the reason for the current level of voting in the 18-24 year-old group is that many of them are college students and have to vote absentee. In your opinion, why would that affect the voting percentage for the 18 - 24 age-group?
(a) Describe in a few sentences the voting pattern that you see in the data above. (b) Some individuals argue that the reason for the current level of voting in the 18-24 year-old group is that many of them are college students and have to vote absentee. In your opinion, why would that affect the voting percentage for the 18 - 24 age-group? Question
Artificial nest have often been used when biologists study predation on birds. It is usually assumed that predators will respond to artificial nests in the same way they do to real birds' nests. A recent experiment was performed to check this assumption for predators of the American robin (Turdus migratorius) by comparing the egg loss in three experimental treatments: (1) natural robin's nests, (2) artificial wicker-basket nests placed 30 meters in a random direction from natural robin's nests, and (3) artificial wicker-basket nests placed in a 180 m by 240 m grid around robin's nests. The data below are cumulative counts of eggs predated (stolen or broken and eaten) at 5, 10, and 15 day points of the experiment. 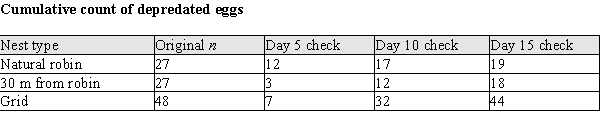 (a) Construct a bar chart to display the cumulative counts for the natural robin nests at their 5-, 10-, and 15-day checks. (b) Fill in the relative frequency distribution (table) representing the cumulative counts for the artificial nests in the grid. (Do not convert the table to a graph.)
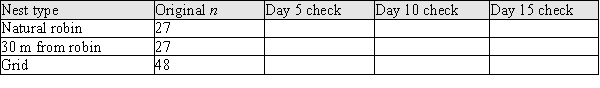
(a) Construct a bar chart to display the cumulative counts for the natural robin nests at their 5-, 10-, and 15-day checks. (b) Fill in the relative frequency distribution (table) representing the cumulative counts for the artificial nests in the grid. (Do not convert the table to a graph.) Question
Question
Bat characteristics Biologists know that bats have different flight characteristics. Some bats exhibit fast, straight, and long flights; others are moderately slow, and highly maneuverable. The flight capabilities of bats are presumably a function of (a) the characteristics of the bat wings, and (b) the laws of physics. The data presented below are wing spans in centimeters for certain species of bats from Nicaragua and Costa Rica. Two categories of bat species are represented: fruit-eaters and insect-eaters. 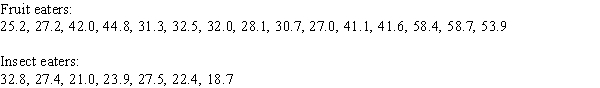 (a) Construct two dot plots that will allow you to easily compare the distributions of the wing spans for the two categories of bats, fruit-eaters and insect-eaters. (b) Write a short paragraph describing the features of the two plots; what do these plots tell you about the differences in wing span for fruit- and insect-eaters?
(a) Construct two dot plots that will allow you to easily compare the distributions of the wing spans for the two categories of bats, fruit-eaters and insect-eaters. (b) Write a short paragraph describing the features of the two plots; what do these plots tell you about the differences in wing span for fruit- and insect-eaters? Question
Question
Question
Biologists know that bats have different flight characteristics. Some bats exhibit fast, straight, and long flights; others are moderately slow, and highly maneuverable. The flight capabilities of bats are presumably a function of (a) the characteristics of the bat wings, and (b) the laws of physics. The data presented below are wing weights in grams for certain species of bats from Nicaragua and Costa Rica. Two categories of bat species are represented: fruit-eaters and insect-eaters. 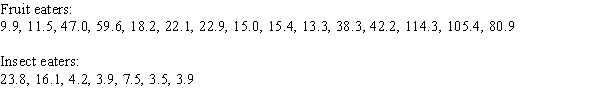 (a) Construct two dot plots that will allow you to easily compare the distributions of the wing weights for the two categories of bats, fruit-eaters and insect-eaters. (b) Write a short paragraph describing the features of the two plots; what do these plots tell you about the differences in wing weight for fruit- and insect-eaters?
(a) Construct two dot plots that will allow you to easily compare the distributions of the wing weights for the two categories of bats, fruit-eaters and insect-eaters. (b) Write a short paragraph describing the features of the two plots; what do these plots tell you about the differences in wing weight for fruit- and insect-eaters? Question

Unlock Deck
Sign up to unlock the cards in this deck!
Unlock Deck
Unlock Deck
1/17
Play
Full screen (f)
Deck 1: The Role of Statistics and the Data Analysis Process
1
The most important right and responsibility of citizens in a democratic society is voting. The bar chart below shows, for different age groups in the 2000 presidential election in the United States, the percentage of individuals in that age group who are registered to vote. (a) Describe in a few sentences the registration pattern that you see in the data above. (b) Some individuals argue that the reason for the current level of registration in the 18-24 year-old group is that many of them are college students and would have to vote absentee. In your opinion, would that explain the registration level for the 18 - 24 age-group? Why or why not?
(a) Describe in a few sentences the registration pattern that you see in the data above. (b) Some individuals argue that the reason for the current level of registration in the 18-24 year-old group is that many of them are college students and would have to vote absentee. In your opinion, would that explain the registration level for the 18 - 24 age-group? Why or why not?a) The proportion of people registering is smallest for the 18-24 year-old group, and gets larger with age, until finally declining in the 75+ year-old group.
b) Voting by absentee ballot may be more of a hassle b/c you have to get the ballot, but actual registration could be done at home before going to college. It would seem that unless the 18-24 year-olds decide for some reason they will not vote in their college years because of expected hassle of voting, the future voting would not be affecting the registration level.
b) Voting by absentee ballot may be more of a hassle b/c you have to get the ballot, but actual registration could be done at home before going to college. It would seem that unless the 18-24 year-olds decide for some reason they will not vote in their college years because of expected hassle of voting, the future voting would not be affecting the registration level.
2
A data set consisting of many observations of a single characteristic is a categorical data set.
False
3
In a psychological study of distance perception, introductory psychology class volunteers were given 5, 10, or 15 extra credit points depending on their level of participation in the experiment. They walked along paths laid out along hallways in the psychology building, and were asked to judge the distance they had walked. Each path distance was between 100 and 200 feet in length, and contained from two to seven 90 degree turns. The investigators also kept track of class standing (freshman, sophomore, junior, or senior). For each of the variables in this study, determine whether it is categorical or numerical. For each numerical variable, determine whether it is discrete or continuous: (a) The true length of the path (b) The amount of credit given to the volunteers (c) The length of the path as judged by the students (d) The number of 90 degree turns (e) Class standing
a) Numerical, continuous
b) Numerical, discrete
c) Numerical, continuous
d) Numerical, discrete
e) Categorical
b) Numerical, discrete
c) Numerical, continuous
d) Numerical, discrete
e) Categorical
4
A data set is multivariate if it consists only of numeric variables.
Unlock Deck
Unlock for access to all 17 flashcards in this deck.
Unlock Deck
k this deck
5
A primary use of inferential statistics is to make generalizations from a sample to a population.
Unlock Deck
Unlock for access to all 17 flashcards in this deck.
Unlock Deck
k this deck
6
Frequency distributions can only be used with categorical data.
Unlock Deck
Unlock for access to all 17 flashcards in this deck.
Unlock Deck
k this deck
7
Bird-plane collisions Collisions between birds and airplanes are a major problem, threatening passenger safety and resulting in costly repairs. During the years 1990 - 1994, researchers gathered bird remains from runways at Lihue Airport on the island of Kauai, Hawaii. The data below are counts of birds found on the runway used for takeoffs and the runway used for landings from the 4 most frequently involved species: (a) Construct a bar chart to display the bird species data for the landing runway. (b) Construct a relative frequency distribution (table) representing the bird species data for the takeoff runway.
(a) Construct a bar chart to display the bird species data for the landing runway. (b) Construct a relative frequency distribution (table) representing the bird species data for the takeoff runway. Unlock Deck
Unlock for access to all 17 flashcards in this deck.
Unlock Deck
k this deck
8
The relative frequency for a particular category is the number of times the category appears in the data.
Unlock Deck
Unlock for access to all 17 flashcards in this deck.
Unlock Deck
k this deck
9
Bar charts should be used with categorical data.
Unlock Deck
Unlock for access to all 17 flashcards in this deck.
Unlock Deck
k this deck
10
The most important right and responsibility of citizens in a democratic society is voting. The bar chart below shows, for different age groups in the 2000 presidential election in the United States, the percentage of individuals in that age group who actually voted. (a) Describe in a few sentences the voting pattern that you see in the data above. (b) Some individuals argue that the reason for the current level of voting in the 18-24 year-old group is that many of them are college students and have to vote absentee. In your opinion, why would that affect the voting percentage for the 18 - 24 age-group?
(a) Describe in a few sentences the voting pattern that you see in the data above. (b) Some individuals argue that the reason for the current level of voting in the 18-24 year-old group is that many of them are college students and have to vote absentee. In your opinion, why would that affect the voting percentage for the 18 - 24 age-group? Unlock Deck
Unlock for access to all 17 flashcards in this deck.
Unlock Deck
k this deck
11
Artificial nest have often been used when biologists study predation on birds. It is usually assumed that predators will respond to artificial nests in the same way they do to real birds' nests. A recent experiment was performed to check this assumption for predators of the American robin (Turdus migratorius) by comparing the egg loss in three experimental treatments: (1) natural robin's nests, (2) artificial wicker-basket nests placed 30 meters in a random direction from natural robin's nests, and (3) artificial wicker-basket nests placed in a 180 m by 240 m grid around robin's nests. The data below are cumulative counts of eggs predated (stolen or broken and eaten) at 5, 10, and 15 day points of the experiment. (a) Construct a bar chart to display the cumulative counts for the natural robin nests at their 5-, 10-, and 15-day checks. (b) Fill in the relative frequency distribution (table) representing the cumulative counts for the artificial nests in the grid. (Do not convert the table to a graph.)
(a) Construct a bar chart to display the cumulative counts for the natural robin nests at their 5-, 10-, and 15-day checks. (b) Fill in the relative frequency distribution (table) representing the cumulative counts for the artificial nests in the grid. (Do not convert the table to a graph.) Unlock Deck
Unlock for access to all 17 flashcards in this deck.
Unlock Deck
k this deck
12
Dotplots work best for small and moderate sized numerical data sets.
Unlock Deck
Unlock for access to all 17 flashcards in this deck.
Unlock Deck
k this deck
13
Bat characteristics Biologists know that bats have different flight characteristics. Some bats exhibit fast, straight, and long flights; others are moderately slow, and highly maneuverable. The flight capabilities of bats are presumably a function of (a) the characteristics of the bat wings, and (b) the laws of physics. The data presented below are wing spans in centimeters for certain species of bats from Nicaragua and Costa Rica. Two categories of bat species are represented: fruit-eaters and insect-eaters. (a) Construct two dot plots that will allow you to easily compare the distributions of the wing spans for the two categories of bats, fruit-eaters and insect-eaters. (b) Write a short paragraph describing the features of the two plots; what do these plots tell you about the differences in wing span for fruit- and insect-eaters?
(a) Construct two dot plots that will allow you to easily compare the distributions of the wing spans for the two categories of bats, fruit-eaters and insect-eaters. (b) Write a short paragraph describing the features of the two plots; what do these plots tell you about the differences in wing span for fruit- and insect-eaters? Unlock Deck
Unlock for access to all 17 flashcards in this deck.
Unlock Deck
k this deck
14
The entire collection of individuals or objects about which information is desired is called a sample.
Unlock Deck
Unlock for access to all 17 flashcards in this deck.
Unlock Deck
k this deck
15
A data set is discrete if the possible values are isolated points on the number line.
Unlock Deck
Unlock for access to all 17 flashcards in this deck.
Unlock Deck
k this deck
16
Biologists know that bats have different flight characteristics. Some bats exhibit fast, straight, and long flights; others are moderately slow, and highly maneuverable. The flight capabilities of bats are presumably a function of (a) the characteristics of the bat wings, and (b) the laws of physics. The data presented below are wing weights in grams for certain species of bats from Nicaragua and Costa Rica. Two categories of bat species are represented: fruit-eaters and insect-eaters. (a) Construct two dot plots that will allow you to easily compare the distributions of the wing weights for the two categories of bats, fruit-eaters and insect-eaters. (b) Write a short paragraph describing the features of the two plots; what do these plots tell you about the differences in wing weight for fruit- and insect-eaters?
(a) Construct two dot plots that will allow you to easily compare the distributions of the wing weights for the two categories of bats, fruit-eaters and insect-eaters. (b) Write a short paragraph describing the features of the two plots; what do these plots tell you about the differences in wing weight for fruit- and insect-eaters? Unlock Deck
Unlock for access to all 17 flashcards in this deck.
Unlock Deck
k this deck
17
Methods for summarizing data make up the branch of statistics called inferential statistics.
Unlock Deck
Unlock for access to all 17 flashcards in this deck.
Unlock Deck
k this deck
Unlock Deck
Unlock for access to all 17 flashcards in this deck.


