Deck 12: Financial Statement Analysis
Full screen (f)
Question
Question
Question
Question
Question
Question
Question
Question
Question
Question
Question
Question
Question
Question
Question
Question
Question
Question
Question
Question
Question
Question
Question
Question
Question
Question
Question
Question
Question
Question
Question
Question
Question
Question
Question
Question
Question
Question
Question
Question
Question
Question
Question
Question
Consider the following income statement data for Odem Inc.: 
Based on common-size analysis, which of the following statements is correct?
A) The increase in sales revenue in 2016 was caused by higher selling and administrative expenses.
B) The company's cost to sales ratio improved in 2016.
C) The increase in gross profit in 2016 was due to increased sales.
D) Net income as a percent of sales declined in 2016.
Question
How are prepaid accounts used in each of the following ratios? 
Question
Question
Question
Question
Question
Question
Question
Question
Question
Consider the following income statement data for Odem Inc.:
The common-size percentage for selling and administration costs in 2016 was
A) 21.2%.
B) 23.1%.
C) 43.5%.
D) 77.0%.
The common-size percentage for selling and administration costs in 2016 was
A) 21.2%.
B) 23.1%.
C) 43.5%.
D) 77.0%.
Question
Question
Question
Question
Question
Question
Question
Question
Question
Question
Question
Question
Question
Question
Question
Question
Question
Use the following information for questions 80-81.
The following data was taken from the accounting records of Whalen Corporation: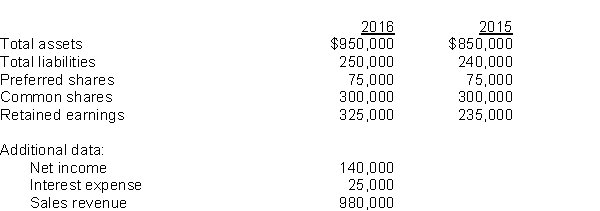
The return on equity for 2016 is
A) 20.0%.
B) 21.4%.
C) 26.7%.
D) 46.7%.
The following data was taken from the accounting records of Whalen Corporation:
The return on equity for 2016 is
A) 20.0%.
B) 21.4%.
C) 26.7%.
D) 46.7%.
Question
Question
Question
Use the following information for questions 80-81.
The following data was taken from the accounting records of Whalen Corporation:
The return on assets for 2016 is
A) 15.6%.
B) 16.5%.
C) 17.4%.
D) 18.5%.
The following data was taken from the accounting records of Whalen Corporation:
The return on assets for 2016 is
A) 15.6%.
B) 16.5%.
C) 17.4%.
D) 18.5%.
Question
Question
Use the following information for questions 83-85.
Luminus Corporation's books revealed the following for 2016 and 2015: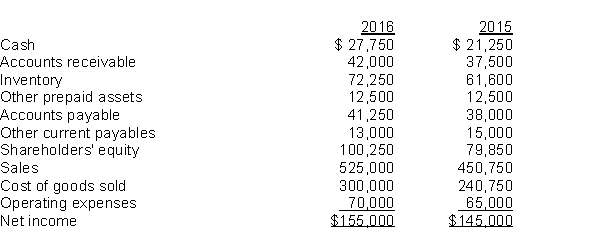
The current ratio for the 2016 year-end is
A) 2.85.
B) 2.62.
C) 1.29.
D) 1.02.
Luminus Corporation's books revealed the following for 2016 and 2015:
The current ratio for the 2016 year-end is
A) 2.85.
B) 2.62.
C) 1.29.
D) 1.02.
Question
Question
Use the following information for questions 83-85.
Luminus Corporation's books revealed the following for 2016 and 2015:
The quick ratio for the 2016 year-end is
A) 1.99.
B) 1.69.
C) 1.52.
D) 1.29.
Luminus Corporation's books revealed the following for 2016 and 2015:
The quick ratio for the 2016 year-end is
A) 1.99.
B) 1.69.
C) 1.52.
D) 1.29.
Question
Consider the following income statement data for Odem Inc.: 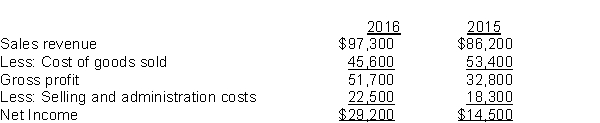 What was the 2016 net profit margin before income tax closest to?
A) 16.8%
B) 23.1%
C) 30.0%
D) 53.1%
What was the 2016 net profit margin before income tax closest to?A) 16.8%
B) 23.1%
C) 30.0%
D) 53.1%
Question
Use the following information for questions 83-85.
Luminus Corporation's books revealed the following for 2016 and 2015:
The number of days to collect the average receivable in 2016 was
A) 28 days.
B) 29 days.
C) 30 days.
D) 31 days.
Luminus Corporation's books revealed the following for 2016 and 2015:
The number of days to collect the average receivable in 2016 was
A) 28 days.
B) 29 days.
C) 30 days.
D) 31 days.

Unlock Deck
Sign up to unlock the cards in this deck!
Unlock Deck
Unlock Deck
1/90
Play
Full screen (f)
Deck 12: Financial Statement Analysis
1
A banker assessing a loan application and an equity analyst making an investment decision would perform the same type of analysis of a company.
True
2
When analyzing companies that have diverse business activities, analysts should NOT rely on segmented information.
True
3
Retrospective analysis is using the past to predict future trends.
False
4
An investment analyst will analyze the company's results relative to other companies.
Unlock Deck
Unlock for access to all 90 flashcards in this deck.
Unlock Deck
k this deck
5
Trend analysis is used to examine one period of a company's information.
Unlock Deck
Unlock for access to all 90 flashcards in this deck.
Unlock Deck
k this deck
6
Times series analysis compares the data from one company with the data from another company.
Unlock Deck
Unlock for access to all 90 flashcards in this deck.
Unlock Deck
k this deck
7
The objective of MD&A is to allow the user to see the company through the eyes of management.
Unlock Deck
Unlock for access to all 90 flashcards in this deck.
Unlock Deck
k this deck
8
Historical results CANNOT be used as a foundation for predicting future outcomes.
Unlock Deck
Unlock for access to all 90 flashcards in this deck.
Unlock Deck
k this deck
9
Financial statement users value the auditors' opinion as the auditor is an independent third party.
Unlock Deck
Unlock for access to all 90 flashcards in this deck.
Unlock Deck
k this deck
10
Cross-sectional analysis compares data from one company with those of another company over many periods.
Unlock Deck
Unlock for access to all 90 flashcards in this deck.
Unlock Deck
k this deck
11
A company is required to disclose information related to the segment(s) in a note to the financial statements if it has only one distinctive operating segment.
Unlock Deck
Unlock for access to all 90 flashcards in this deck.
Unlock Deck
k this deck
12
The auditor's report guarantees the accuracy of the information presented in the financial statements.
Unlock Deck
Unlock for access to all 90 flashcards in this deck.
Unlock Deck
k this deck
13
Retrospective analysis reviews past trends in order to help predict the future.
Unlock Deck
Unlock for access to all 90 flashcards in this deck.
Unlock Deck
k this deck
14
When a company operates in different geographic locations this is known as operating segments.
Unlock Deck
Unlock for access to all 90 flashcards in this deck.
Unlock Deck
k this deck
15
It is important that the conclusion of an analysis differentiates between factual results and the analysts' opinion.
Unlock Deck
Unlock for access to all 90 flashcards in this deck.
Unlock Deck
k this deck
16
An investment analyst will only focus on historic results as future growth will not impact shareholder decisions.
Unlock Deck
Unlock for access to all 90 flashcards in this deck.
Unlock Deck
k this deck
17
The audit report guarantees the accuracy of financial information contained in the financial statements.
Unlock Deck
Unlock for access to all 90 flashcards in this deck.
Unlock Deck
k this deck
18
Analyzing financial data on the same company over time is called cross-sectional analysis.
Unlock Deck
Unlock for access to all 90 flashcards in this deck.
Unlock Deck
k this deck
19
Financial statement analysis is the process of evaluating a company's performance based on an analysis of their financial statements.
Unlock Deck
Unlock for access to all 90 flashcards in this deck.
Unlock Deck
k this deck
20
Prospective analysis is known as a forward-looking analysis.
Unlock Deck
Unlock for access to all 90 flashcards in this deck.
Unlock Deck
k this deck
21
Analysts use financial statements for their analysis for all of the following reasons EXCEPT
A) corporate performance.
B) employee satisfaction.
C) lending decisions.
D) risks related to the investment.
A) corporate performance.
B) employee satisfaction.
C) lending decisions.
D) risks related to the investment.
Unlock Deck
Unlock for access to all 90 flashcards in this deck.
Unlock Deck
k this deck
22
Ratios are more conclusive than attention directing.
Unlock Deck
Unlock for access to all 90 flashcards in this deck.
Unlock Deck
k this deck
23
Which of the following best represents a company following the product differentiation strategy?
A) gourmet grocery store
B) discount grocery store
C) discount retailer
D) dollar store
A) gourmet grocery store
B) discount grocery store
C) discount retailer
D) dollar store
Unlock Deck
Unlock for access to all 90 flashcards in this deck.
Unlock Deck
k this deck
24
Which one of the following steps adds the most value to an analysis?
A) determine the purpose of the analysis
B) develop conclusions
C) analyze and interpret the ratios
D) prepare common-size analysis
A) determine the purpose of the analysis
B) develop conclusions
C) analyze and interpret the ratios
D) prepare common-size analysis
Unlock Deck
Unlock for access to all 90 flashcards in this deck.
Unlock Deck
k this deck
25
Product differentiation strategy is to
A) provide superior service at a premium price.
B) provide superior service at a low price.
C) provide regular service at a low price.
D) provide regular service at a high price.
A) provide superior service at a premium price.
B) provide superior service at a low price.
C) provide regular service at a low price.
D) provide regular service at a high price.
Unlock Deck
Unlock for access to all 90 flashcards in this deck.
Unlock Deck
k this deck
26
Why is the audit report important in the analysis of a company?
A) It guarantees the accuracy of the information in the financial statements.
B) It guarantees the accuracy of the internal controls of the company.
C) The auditors are hired by management to assess the appropriateness of the accounting policies chosen.
D) The auditors are an independent third party expressing an opinion on the fairness of the financial statements.
Unlock Deck
Unlock for access to all 90 flashcards in this deck.
Unlock Deck
k this deck
27
Common-size analysis involves converting the percentage values in the financial statements to dollar values.
Unlock Deck
Unlock for access to all 90 flashcards in this deck.
Unlock Deck
k this deck
28
An analysis can be performed by a(n)
A) credit rating agency.
B) potential investors.
C) creditors.
D) all of the above.
A) credit rating agency.
B) potential investors.
C) creditors.
D) all of the above.
Unlock Deck
Unlock for access to all 90 flashcards in this deck.
Unlock Deck
k this deck
29
Ratios exhibit the relationship between figures from year to year and the reason for the changes year to year.
Unlock Deck
Unlock for access to all 90 flashcards in this deck.
Unlock Deck
k this deck
30
A low-cost producer focuses on
A) providing goods and services at highest possible costs and selling at high prices.
B) providing goods and services at lowest possible costs and selling at high prices.
C) providing goods and services at highest possible costs and selling at low prices.
D) providing goods and services at lowest possible costs and selling at low prices.
Unlock Deck
Unlock for access to all 90 flashcards in this deck.
Unlock Deck
k this deck
31
Common-size income statement analysis uses net revenues as a base for all percentages.
Unlock Deck
Unlock for access to all 90 flashcards in this deck.
Unlock Deck
k this deck
32
An analysis would include
A) calculating ratios.
B) looking at relationships with the financial statements.
C) comparing results with industry benchmarks.
D) all of the above.
A) calculating ratios.
B) looking at relationships with the financial statements.
C) comparing results with industry benchmarks.
D) all of the above.
Unlock Deck
Unlock for access to all 90 flashcards in this deck.
Unlock Deck
k this deck
33
The auditor's report confirms that
A) the financial statements are error free.
B) the information contained in the auditor's report is negative information.
C) the statements present fairly the financial condition of a company.
D) the auditor has qualifications to make on the information.
A) the financial statements are error free.
B) the information contained in the auditor's report is negative information.
C) the statements present fairly the financial condition of a company.
D) the auditor has qualifications to make on the information.
Unlock Deck
Unlock for access to all 90 flashcards in this deck.
Unlock Deck
k this deck
34
Return on equity is a measure of performance from management's perspective.
Unlock Deck
Unlock for access to all 90 flashcards in this deck.
Unlock Deck
k this deck
35
Place the following steps involved in financial statement analysis in the proper order: I. Determine the purpose and context of the analysis
II) Develop conclusions and recommendations
III) Collect information needed for the analysis
IV) Analyze and interpret the metrics
V) Prepare common-size analysis and calculate ratios
A) I, III, V, IV, II
B) I, II, III, IV, V
C) V, I, III, IV, II
D) IV, III, V, I, II
II) Develop conclusions and recommendations
III) Collect information needed for the analysis
IV) Analyze and interpret the metrics
V) Prepare common-size analysis and calculate ratios
A) I, III, V, IV, II
B) I, II, III, IV, V
C) V, I, III, IV, II
D) IV, III, V, I, II
Unlock Deck
Unlock for access to all 90 flashcards in this deck.
Unlock Deck
k this deck
36
Which of the following best represents a low-cost producer?
A) gourmet grocery store
B) discount grocery store
C) high end retailer
D) specialty store
A) gourmet grocery store
B) discount grocery store
C) high end retailer
D) specialty store
Unlock Deck
Unlock for access to all 90 flashcards in this deck.
Unlock Deck
k this deck
37
Ratio analysis provides a complete picture of the general financial health and wellbeing of a company.
Unlock Deck
Unlock for access to all 90 flashcards in this deck.
Unlock Deck
k this deck
38
Fully diluted earnings per share is a worst case scenario.
Unlock Deck
Unlock for access to all 90 flashcards in this deck.
Unlock Deck
k this deck
39
In order to understand a company's business, an analyst must understand the corporation's strategy. Which of the following is an example of a corporate strategy?
A) being a high-cost producer
B) following product simplification
C) being a low-cost producer
D) being a low-volume producer
A) being a high-cost producer
B) following product simplification
C) being a low-cost producer
D) being a low-volume producer
Unlock Deck
Unlock for access to all 90 flashcards in this deck.
Unlock Deck
k this deck
40
Common-size analysis is useful for making comparisons across the various financial statements.
Unlock Deck
Unlock for access to all 90 flashcards in this deck.
Unlock Deck
k this deck
41
Which of the following depicts earnings per share?
A) Net income ÷ number of common shares
B) Net income ÷ weighted average number of common shares
C) (Net income - preferred dividend) ÷ weighted average number of common shares
D) (Net income - preferred dividend) ÷ number of common shares
A) Net income ÷ number of common shares
B) Net income ÷ weighted average number of common shares
C) (Net income - preferred dividend) ÷ weighted average number of common shares
D) (Net income - preferred dividend) ÷ number of common shares
Unlock Deck
Unlock for access to all 90 flashcards in this deck.
Unlock Deck
k this deck
42
The analysis of financial statements to assist in predicting future results is an example of
A) historical analysis.
B) retrospective analysis.
C) retroactive analysis.
D) prospective analysis.
A) historical analysis.
B) retrospective analysis.
C) retroactive analysis.
D) prospective analysis.
Unlock Deck
Unlock for access to all 90 flashcards in this deck.
Unlock Deck
k this deck
43
On a common-size income statement, all items are shown as
A) percentages of net income.
B) percentages of total assets.
C) percentages of gross revenue.
D) percentages of gross profit.
A) percentages of net income.
B) percentages of total assets.
C) percentages of gross revenue.
D) percentages of gross profit.
Unlock Deck
Unlock for access to all 90 flashcards in this deck.
Unlock Deck
k this deck
44
Consider the following income statement data for Odem Inc.:
Based on common-size analysis, which of the following statements is correct?
A) The increase in sales revenue in 2016 was caused by higher selling and administrative expenses.
B) The company's cost to sales ratio improved in 2016.
C) The increase in gross profit in 2016 was due to increased sales.
D) Net income as a percent of sales declined in 2016.
Unlock Deck
Unlock for access to all 90 flashcards in this deck.
Unlock Deck
k this deck
45
How are prepaid accounts used in each of the following ratios?
Unlock Deck
Unlock for access to all 90 flashcards in this deck.
Unlock Deck
k this deck
46
Given the following data: sales $1,500,000; gross profit $640,000; net income $40,000 and income tax expense $35,000. What is the common-size percentage for the cost of sales?
A) 3.0%
B) 37.7%
C) 42.7%
D) 57.3%
A) 3.0%
B) 37.7%
C) 42.7%
D) 57.3%
Unlock Deck
Unlock for access to all 90 flashcards in this deck.
Unlock Deck
k this deck
47
Which of the following is NOT an example of cross sectional analysis?
A) determining how the growth in sales from one company differed from that of another company
B) comparing growth in sales across different industries
C) determining the growth in sales for a company over a five-year period
D) comparing total sales across companies in the same industry for the past three years
Unlock Deck
Unlock for access to all 90 flashcards in this deck.
Unlock Deck
k this deck
48
Cross-sectional analysis involves examining a company's financial data
A) across account classifications.
B) as percentages of net sales or total assets.
C) and comparing it with other companies.
D) across time periods.
A) across account classifications.
B) as percentages of net sales or total assets.
C) and comparing it with other companies.
D) across time periods.
Unlock Deck
Unlock for access to all 90 flashcards in this deck.
Unlock Deck
k this deck
49
Which of the following is a short-term liquidity ratio?
A) debt/equity ratio
B) profit margin ratio
C) quick ratio
D) return on assets ratio
A) debt/equity ratio
B) profit margin ratio
C) quick ratio
D) return on assets ratio
Unlock Deck
Unlock for access to all 90 flashcards in this deck.
Unlock Deck
k this deck
50
EBITDAR is best described as
A) earnings before income, taxes, depreciation, acquisitions and restructuring.
B) earnings before interest, taxes, depreciation, acquisitions and restructuring.
C) earnings before income, taxes, discounts, acquisitions and restructuring.
D) equity before interest, taxes, depreciation, acquisitions and restructuring.
Unlock Deck
Unlock for access to all 90 flashcards in this deck.
Unlock Deck
k this deck
51
Which of the following descriptions best describes trend analysis?
A) converting dollar values on the financial statements to percentages of a specific base amount
B) comparing data from one company to with those of another company over the same period
C) examining company information from multiple periods
D) using historical information as a basis for predicting future outcomes
Unlock Deck
Unlock for access to all 90 flashcards in this deck.
Unlock Deck
k this deck
52
Which of the following is NOT a general category of ratios?
A) performance
B) short-term liquidity
C) long-term liquidity
D) financial leverage
A) performance
B) short-term liquidity
C) long-term liquidity
D) financial leverage
Unlock Deck
Unlock for access to all 90 flashcards in this deck.
Unlock Deck
k this deck
53
To see if a company's cost of sales is increasing proportionately with sales, an analyst would use
A) raw financial data.
B) common-size analysis.
C) trend analysis.
D) prospective analysis.
A) raw financial data.
B) common-size analysis.
C) trend analysis.
D) prospective analysis.
Unlock Deck
Unlock for access to all 90 flashcards in this deck.
Unlock Deck
k this deck
54
Consider the following income statement data for Odem Inc.:
The common-size percentage for selling and administration costs in 2016 was
A) 21.2%.
B) 23.1%.
C) 43.5%.
D) 77.0%.
The common-size percentage for selling and administration costs in 2016 was
A) 21.2%.
B) 23.1%.
C) 43.5%.
D) 77.0%.
Unlock Deck
Unlock for access to all 90 flashcards in this deck.
Unlock Deck
k this deck
55
Review of the financial statements revealed the following for Glitter Inc.: Sales $1,250,000, Net income $37,500, Total assets $650,000, Long-term debt $750,000, Interest expense $65,000 and Cost of goods sold $775,000. When preparing common-size financial statements, interest expense would be shown as
A) 10.0%.
B) 9.3%.
C) 8.4%.
D) 5.2%.
A) 10.0%.
B) 9.3%.
C) 8.4%.
D) 5.2%.
Unlock Deck
Unlock for access to all 90 flashcards in this deck.
Unlock Deck
k this deck
56
Given the following data: sales $1,500,000; gross profit $640,000; net income $40,000 and income tax expense $35,000. What is the common-size percentage for operating expenses?
A) 37.7%
B) 42.7%
C) 95.0%
D) 97.3%
A) 37.7%
B) 42.7%
C) 95.0%
D) 97.3%
Unlock Deck
Unlock for access to all 90 flashcards in this deck.
Unlock Deck
k this deck
57
Ratios are useful in explaining the
A) relationships between financial data.
B) differences between companies.
C) trends within industries.
D) reasons for financial performance.
A) relationships between financial data.
B) differences between companies.
C) trends within industries.
D) reasons for financial performance.
Unlock Deck
Unlock for access to all 90 flashcards in this deck.
Unlock Deck
k this deck
58
An analytical tool for comparing two companies of different sizes is
A) common-size statements.
B) short-term liquidity.
C) financial leverage.
D) performance.
A) common-size statements.
B) short-term liquidity.
C) financial leverage.
D) performance.
Unlock Deck
Unlock for access to all 90 flashcards in this deck.
Unlock Deck
k this deck
59
Which of the following descriptions best describes cross-sectional analysis?
A) converting dollar values on the financial statements to percentages of a specific base amount
B) comparing data from one company to with those of another company over the same period
C) examining company information from multiple periods
D) using historical information as a basis for predicting future outcomes
Unlock Deck
Unlock for access to all 90 flashcards in this deck.
Unlock Deck
k this deck
60
Purchase of inventory for cash will
A) increase the current ratio.
B) decrease the current ratio.
C) increase the quick ratio.
D) decrease the quick ratio.
A) increase the current ratio.
B) decrease the current ratio.
C) increase the quick ratio.
D) decrease the quick ratio.
Unlock Deck
Unlock for access to all 90 flashcards in this deck.
Unlock Deck
k this deck
61
Which of the return on investment ratios would be of most interest to the management of a firm?
A) return on assets
B) return on debt
C) return on equity
D) return on profits
A) return on assets
B) return on debt
C) return on equity
D) return on profits
Unlock Deck
Unlock for access to all 90 flashcards in this deck.
Unlock Deck
k this deck
62
Two companies have an identical amount of current assets and current liabilities. Chelmsford Inc. has 40% of its current assets invested in inventory, whereas Hanmer Corp. has 30% of its current assets invested in inventory. Which of the following statements is true?
A) Chelmsford will have the higher quick ratio.
B) Chelmsford will have the higher current ratio.
C) The companies are equally liquid because their current ratios are the same.
D) Chelmsford is less liquid than Hanmer.
A) Chelmsford will have the higher quick ratio.
B) Chelmsford will have the higher current ratio.
C) The companies are equally liquid because their current ratios are the same.
D) Chelmsford is less liquid than Hanmer.
Unlock Deck
Unlock for access to all 90 flashcards in this deck.
Unlock Deck
k this deck
63
The return on assets ratio could be used for a(n)
A) financing decision.
B) liquidity decision.
C) investment decision.
D) debt-to-equity decision.
A) financing decision.
B) liquidity decision.
C) investment decision.
D) debt-to-equity decision.
Unlock Deck
Unlock for access to all 90 flashcards in this deck.
Unlock Deck
k this deck
64
Which of the following companies would be least likely to calculate accounts receivable turnover ratios?
A) a restaurant
B) a construction company
C) a consulting firm
D) an insurance office
A) a restaurant
B) a construction company
C) a consulting firm
D) an insurance office
Unlock Deck
Unlock for access to all 90 flashcards in this deck.
Unlock Deck
k this deck
65
When preparing common-size analysis of a statement of income, the base is normally
A) Net income.
B) Operating expenses.
C) Revenues.
D) Cost of goods sold.
A) Net income.
B) Operating expenses.
C) Revenues.
D) Cost of goods sold.
Unlock Deck
Unlock for access to all 90 flashcards in this deck.
Unlock Deck
k this deck
66
Changes in the profit margin ratio could indicate changes in any of the following EXCEPT changes in
A) sales volume.
B) product profitability.
C) the cost structure.
D) the pricing policy.
A) sales volume.
B) product profitability.
C) the cost structure.
D) the pricing policy.
Unlock Deck
Unlock for access to all 90 flashcards in this deck.
Unlock Deck
k this deck
67
Which of the following depicts the quick ratio?
A) (cash + accounts receivable + short-term investments) ÷ current liabilities
B) (cash + accounts receivable) ÷ total assets
C) (current assets - current liabilities) ÷ total assets
D) (cash + inventory) ÷ current liabilities
A) (cash + accounts receivable + short-term investments) ÷ current liabilities
B) (cash + accounts receivable) ÷ total assets
C) (current assets - current liabilities) ÷ total assets
D) (cash + inventory) ÷ current liabilities
Unlock Deck
Unlock for access to all 90 flashcards in this deck.
Unlock Deck
k this deck
68
All of the following measure activity except for
A) accounts receivable turnover.
B) inventory turnover.
C) equity turnover.
D) accounts payable turnover.
A) accounts receivable turnover.
B) inventory turnover.
C) equity turnover.
D) accounts payable turnover.
Unlock Deck
Unlock for access to all 90 flashcards in this deck.
Unlock Deck
k this deck
69
Which of the return on investment ratios would be of most interest to the owners of a company?
A) return on assets
B) return on interest
C) return on debt
D) return on equity
A) return on assets
B) return on interest
C) return on debt
D) return on equity
Unlock Deck
Unlock for access to all 90 flashcards in this deck.
Unlock Deck
k this deck
70
Which of the following descriptions best describes common-size analysis?
A) converting dollar values on the financial statements to percentages of a specific base amount
B) comparing data from one company to with those of another company over the same period
C) examining company information from multiple periods
D) using historical information as a basis for predicting future outcomes
Unlock Deck
Unlock for access to all 90 flashcards in this deck.
Unlock Deck
k this deck
71
Use the following information for questions 80-81.
The following data was taken from the accounting records of Whalen Corporation:
The return on equity for 2016 is
A) 20.0%.
B) 21.4%.
C) 26.7%.
D) 46.7%.
The following data was taken from the accounting records of Whalen Corporation:
The return on equity for 2016 is
A) 20.0%.
B) 21.4%.
C) 26.7%.
D) 46.7%.
Unlock Deck
Unlock for access to all 90 flashcards in this deck.
Unlock Deck
k this deck
72
Lenders would be most concerned with
A) debt to equity ratio.
B) EPS.
C) inventory turnover.
D) price earnings ratio.
A) debt to equity ratio.
B) EPS.
C) inventory turnover.
D) price earnings ratio.
Unlock Deck
Unlock for access to all 90 flashcards in this deck.
Unlock Deck
k this deck
73
Review of the financial statements revealed the following for Glitter Inc.: Sales $1,250,000, Net income $37,500, Total assets $650,000, Long-term debt $750,000, Interest expense $65,000 and Cost of goods sold $775,000. What is the Glitter's gross profit margin closest to?
A) 3%
B) 38%
C) 52%
D) 62%
A) 3%
B) 38%
C) 52%
D) 62%
Unlock Deck
Unlock for access to all 90 flashcards in this deck.
Unlock Deck
k this deck
74
Use the following information for questions 80-81.
The following data was taken from the accounting records of Whalen Corporation:
The return on assets for 2016 is
A) 15.6%.
B) 16.5%.
C) 17.4%.
D) 18.5%.
The following data was taken from the accounting records of Whalen Corporation:
The return on assets for 2016 is
A) 15.6%.
B) 16.5%.
C) 17.4%.
D) 18.5%.
Unlock Deck
Unlock for access to all 90 flashcards in this deck.
Unlock Deck
k this deck
75
Which of the following represents the debt/equity ratio?
A) total liabilities ÷ total shareholders' equity
B) total liabilities ÷ (total liabilities + shareholders' equity)
C) total liabilities ÷ (total assets - shareholders' equity)
D) total long-term liabilities ÷ (total long-term liabilities + shareholders' equity)
A) total liabilities ÷ total shareholders' equity
B) total liabilities ÷ (total liabilities + shareholders' equity)
C) total liabilities ÷ (total assets - shareholders' equity)
D) total long-term liabilities ÷ (total long-term liabilities + shareholders' equity)
Unlock Deck
Unlock for access to all 90 flashcards in this deck.
Unlock Deck
k this deck
76
Use the following information for questions 83-85.
Luminus Corporation's books revealed the following for 2016 and 2015:
The current ratio for the 2016 year-end is
A) 2.85.
B) 2.62.
C) 1.29.
D) 1.02.
Luminus Corporation's books revealed the following for 2016 and 2015:
The current ratio for the 2016 year-end is
A) 2.85.
B) 2.62.
C) 1.29.
D) 1.02.
Unlock Deck
Unlock for access to all 90 flashcards in this deck.
Unlock Deck
k this deck
77
Which of the following depicts the current ratio?
A) (current assets - inventory) ÷ current liabilities
B) currents assets ÷ total assets
C) (current assets - inventory) ÷ total assets
D) current assets ÷ current liabilities
A) (current assets - inventory) ÷ current liabilities
B) currents assets ÷ total assets
C) (current assets - inventory) ÷ total assets
D) current assets ÷ current liabilities
Unlock Deck
Unlock for access to all 90 flashcards in this deck.
Unlock Deck
k this deck
78
Use the following information for questions 83-85.
Luminus Corporation's books revealed the following for 2016 and 2015:
The quick ratio for the 2016 year-end is
A) 1.99.
B) 1.69.
C) 1.52.
D) 1.29.
Luminus Corporation's books revealed the following for 2016 and 2015:
The quick ratio for the 2016 year-end is
A) 1.99.
B) 1.69.
C) 1.52.
D) 1.29.
Unlock Deck
Unlock for access to all 90 flashcards in this deck.
Unlock Deck
k this deck
79
Consider the following income statement data for Odem Inc.: What was the 2016 net profit margin before income tax closest to?
A) 16.8%
B) 23.1%
C) 30.0%
D) 53.1%
What was the 2016 net profit margin before income tax closest to?A) 16.8%
B) 23.1%
C) 30.0%
D) 53.1%
Unlock Deck
Unlock for access to all 90 flashcards in this deck.
Unlock Deck
k this deck
80
Use the following information for questions 83-85.
Luminus Corporation's books revealed the following for 2016 and 2015:
The number of days to collect the average receivable in 2016 was
A) 28 days.
B) 29 days.
C) 30 days.
D) 31 days.
Luminus Corporation's books revealed the following for 2016 and 2015:
The number of days to collect the average receivable in 2016 was
A) 28 days.
B) 29 days.
C) 30 days.
D) 31 days.
Unlock Deck
Unlock for access to all 90 flashcards in this deck.
Unlock Deck
k this deck
Unlock Deck
Unlock for access to all 90 flashcards in this deck.


