Deck 14: Applications of Linear Optimization
Full screen (f)
Question
Question
Question
Question
Question
Question
Question
Question
Question
Question
Question
Question
Question
Question
Question
Question
Question
Question
Question
Question
Question
Question
Question
Keychain Publishing is planning to release two books, simultaneously, by the same author. One is a fictional book, while the other is the author's autobiography. The details of its cost, production, and demand are given in the table below. 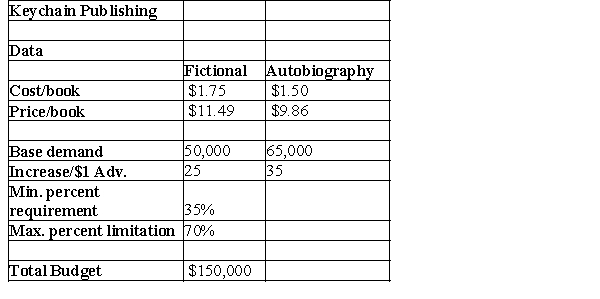 Keychain Publishing has $150,000 available to bind books and advertise them with an objective of maximizing profit contribution. Provide the objective function for maximizing profits, along with its constraints.
Keychain Publishing has $150,000 available to bind books and advertise them with an objective of maximizing profit contribution. Provide the objective function for maximizing profits, along with its constraints. Question
Question
Question
Question
Question
Question
Question
Question
Question
Question
Question
Question
Question
Question
Question
Question
Question
Question
Question
Question
Question
Question
Question
Question
Question
Question

Unlock Deck
Sign up to unlock the cards in this deck!
Unlock Deck
Unlock Deck
1/49
Play
Full screen (f)
Deck 14: Applications of Linear Optimization
1
constraints essentially state that input = output and ensure that the flow of material or money is accounted for at locations or between time periods.
A) Requirements
B) Proportional relationships
C) Balance
D) Limitations
A) Requirements
B) Proportional relationships
C) Balance
D) Limitations
C
2
Use the table below to answer the following question(s).
The Riviera Transport Company (RTC) produces car accessories at two plants: Dallas and Atlanta. They ship them to major distribution centers in Houston, San Jose, Jacksonville, and Memphis. The accounting, production, and marketing departments have provided the information in the table below, which shows the unit cost of shipping between any plant and distribution center, plant capacities over the next planning period, and distribution center demands. RTC's supply chain manager faces the problem of determining how much to ship between each plant and distribution center to minimize the total transportation cost, not exceed available capacity, and meet customer demand.
Assume Xij = amount shipped from plant i to distribution center j, where i = 1 represents Dallas,
i = 2 represents Atlanta, j = 1 represents Houston, and so on. Answer the following question(s) using a linear optimization model.
-Which of the following gives the constraint for the demand met at a distribution center?
A) X11 + X21 = 1,250
B) X13 + X23 ? 210
C) X13 + X23 = 770
D) X13 + X23 = 480
X13 + X23 = 480
3
Which of the following is an example of a simple bounds constraint?
A) confirming that production does not go beyond a certain unit value
B) reducing production due to scarcity of resources
C) meeting targets for a specific sales job
D) equaling production in September with the resources available at the end of August
A) confirming that production does not go beyond a certain unit value
B) reducing production due to scarcity of resources
C) meeting targets for a specific sales job
D) equaling production in September with the resources available at the end of August
A
4
Use the table below to answer the following question(s).
The Riviera Transport Company (RTC) produces car accessories at two plants: Dallas and Atlanta. They ship them to major distribution centers in Houston, San Jose, Jacksonville, and Memphis. The accounting, production, and marketing departments have provided the information in the table below, which shows the unit cost of shipping between any plant and distribution center, plant capacities over the next planning period, and distribution center demands. RTC's supply chain manager faces the problem of determining how much to ship between each plant and distribution center to minimize the total transportation cost, not exceed available capacity, and meet customer demand.
Assume Xij = amount shipped from plant i to distribution center j, where i = 1 represents Dallas,
i = 2 represents Atlanta, j = 1 represents Houston, and so on. Answer the following question(s) using a linear optimization model.
-From the Sensitivity Report on the model, to which of the following cities can Atlanta not ship to without reducing unit cost of production?
A) Houston
B) San Jose
C) Jacksonville
D) Memphis
Unlock Deck
Unlock for access to all 49 flashcards in this deck.
Unlock Deck
k this deck
5
Use the table below to answer the following question(s).
The Riviera Transport Company (RTC) produces car accessories at two plants: Dallas and Atlanta. They ship them to major distribution centers in Houston, San Jose, Jacksonville, and Memphis. The accounting, production, and marketing departments have provided the information in the table below, which shows the unit cost of shipping between any plant and distribution center, plant capacities over the next planning period, and distribution center demands. RTC's supply chain manager faces the problem of determining how much to ship between each plant and distribution center to minimize the total transportation cost, not exceed available capacity, and meet customer demand.
Assume Xij = amount shipped from plant i to distribution center j, where i = 1 represents Dallas,
i = 2 represents Atlanta, j = 1 represents Houston, and so on. Answer the following question(s) using a linear optimization model.
-Based on the Sensitivity Report on the model, which of the following is the savings on a reduction of demand of 2 units at Jacksonville?
A) $2.5
B) $1.25
C) $19.48
D) $16.98
Unlock Deck
Unlock for access to all 49 flashcards in this deck.
Unlock Deck
k this deck
6
Use the table below to answer the following question(s).
The Riviera Transport Company (RTC) produces car accessories at two plants: Dallas and Atlanta. They ship them to major distribution centers in Houston, San Jose, Jacksonville, and Memphis. The accounting, production, and marketing departments have provided the information in the table below, which shows the unit cost of shipping between any plant and distribution center, plant capacities over the next planning period, and distribution center demands. RTC's supply chain manager faces the problem of determining how much to ship between each plant and distribution center to minimize the total transportation cost, not exceed available capacity, and meet customer demand.
Assume Xij = amount shipped from plant i to distribution center j, where i = 1 represents Dallas,
i = 2 represents Atlanta, j = 1 represents Houston, and so on. Answer the following question(s) using a linear optimization model.
-Which of the following is the constraint for total amount shipped from Dallas?
A) X11 + X12 + X13 + X14 ? 1,250
B) X21 + X22 + X23 + X24 ? 1,250
C) X21 + X22 + X23 + X24 ? 750
D) X11 + X12 + X13 + X14 - X21 + X22 + X23 + X24 ? 850
Unlock Deck
Unlock for access to all 49 flashcards in this deck.
Unlock Deck
k this deck
7
Use the table below to answer the following question(s).
The Riviera Transport Company (RTC) produces car accessories at two plants: Dallas and Atlanta. They ship them to major distribution centers in Houston, San Jose, Jacksonville, and Memphis. The accounting, production, and marketing departments have provided the information in the table below, which shows the unit cost of shipping between any plant and distribution center, plant capacities over the next planning period, and distribution center demands. RTC's supply chain manager faces the problem of determining how much to ship between each plant and distribution center to minimize the total transportation cost, not exceed available capacity, and meet customer demand.
Assume Xij = amount shipped from plant i to distribution center j, where i = 1 represents Dallas,
i = 2 represents Atlanta, j = 1 represents Houston, and so on. Answer the following question(s) using a linear optimization model.
-According to the transportation model, what is the total shipment from Dallas?
A) 750
B) 1,180
C) 430
D) 950
Unlock Deck
Unlock for access to all 49 flashcards in this deck.
Unlock Deck
k this deck
8
Which of the following would be considered as an example of a proportional relationships constraint?
A) making certain that only a certain amount of units are produced
B) guaranteeing that a certain amount of workforce will be available for a certain month
C) balancing the input to the output during production
D) ensuring that the budget allocated to marketing is thrice that of research and development
Unlock Deck
Unlock for access to all 49 flashcards in this deck.
Unlock Deck
k this deck
9
Problem statements such as the amount of material used in production cannot exceed the amount available in inventory would be categorized as a constraint.
A) proportional relationships
B) limitations
C) requirements
D) simple bounds
A) proportional relationships
B) limitations
C) requirements
D) simple bounds
Unlock Deck
Unlock for access to all 49 flashcards in this deck.
Unlock Deck
k this deck
10
Use the table below to answer the following question(s).
The Riviera Transport Company (RTC) produces car accessories at two plants: Dallas and Atlanta. They ship them to major distribution centers in Houston, San Jose, Jacksonville, and Memphis. The accounting, production, and marketing departments have provided the information in the table below, which shows the unit cost of shipping between any plant and distribution center, plant capacities over the next planning period, and distribution center demands. RTC's supply chain manager faces the problem of determining how much to ship between each plant and distribution center to minimize the total transportation cost, not exceed available capacity, and meet customer demand.
Assume Xij = amount shipped from plant i to distribution center j, where i = 1 represents Dallas,
i = 2 represents Atlanta, j = 1 represents Houston, and so on. Answer the following question(s) using a linear optimization model.
-According to the Sensitivity Report, which of the following is true if the capacity at Atlanta is increased by 230 units?
A) the total cost can be reduced by $.09 per unit
B) the total cost at Atlanta increases by $9
C) the total cost per unit will reduce by $.09 to Memphis
D) the shadow price at Atlanta will increase to $0.09
Unlock Deck
Unlock for access to all 49 flashcards in this deck.
Unlock Deck
k this deck
11
Use the table below to answer the following question(s).
The Riviera Transport Company (RTC) produces car accessories at two plants: Dallas and Atlanta. They ship them to major distribution centers in Houston, San Jose, Jacksonville, and Memphis. The accounting, production, and marketing departments have provided the information in the table below, which shows the unit cost of shipping between any plant and distribution center, plant capacities over the next planning period, and distribution center demands. RTC's supply chain manager faces the problem of determining how much to ship between each plant and distribution center to minimize the total transportation cost, not exceed available capacity, and meet customer demand.
Assume Xij = amount shipped from plant i to distribution center j, where i = 1 represents Dallas,
i = 2 represents Atlanta, j = 1 represents Houston, and so on. Answer the following question(s) using a linear optimization model.
-According to the transportation model, which of the following is the amount shipped from Dallas to San Jose?
A) 0
B) 95
C) 230
D) 325
Unlock Deck
Unlock for access to all 49 flashcards in this deck.
Unlock Deck
k this deck
12
Use the table below to answer the following question(s).
The Riviera Transport Company (RTC) produces car accessories at two plants: Dallas and Atlanta. They ship them to major distribution centers in Houston, San Jose, Jacksonville, and Memphis. The accounting, production, and marketing departments have provided the information in the table below, which shows the unit cost of shipping between any plant and distribution center, plant capacities over the next planning period, and distribution center demands. RTC's supply chain manager faces the problem of determining how much to ship between each plant and distribution center to minimize the total transportation cost, not exceed available capacity, and meet customer demand.
Assume Xij = amount shipped from plant i to distribution center j, where i = 1 represents Dallas,
i = 2 represents Atlanta, j = 1 represents Houston, and so on. Answer the following question(s) using a linear optimization model.
-According to the transportation model, which of the following is the amount shipped from Dallas to Houston?
A) 0
B) 175
C) 1,180
D) 750
Unlock Deck
Unlock for access to all 49 flashcards in this deck.
Unlock Deck
k this deck
13
Use the table below to answer the following question(s).
The Riviera Transport Company (RTC) produces car accessories at two plants: Dallas and Atlanta. They ship them to major distribution centers in Houston, San Jose, Jacksonville, and Memphis. The accounting, production, and marketing departments have provided the information in the table below, which shows the unit cost of shipping between any plant and distribution center, plant capacities over the next planning period, and distribution center demands. RTC's supply chain manager faces the problem of determining how much to ship between each plant and distribution center to minimize the total transportation cost, not exceed available capacity, and meet customer demand.
Assume Xij = amount shipped from plant i to distribution center j, where i = 1 represents Dallas,
i = 2 represents Atlanta, j = 1 represents Houston, and so on. Answer the following question(s) using a linear optimization model.
-Which of the following is the objective function for cost minimization?
A) minimize cost = 13 X11 +15.25 X12 +10.99 X13 +18.48 X14 / 10.75 X21 +15.16 X22 +9.65 X23 +18.5 X24
B) minimize cost = 13 X11 +15.25 X12 +10.99 X13 +18.48 X14 + 10.75 X21 +15.16 X22 +9.65 X23 +18.5 X24
C) minimize cost = 13 X11 +15.25 X12 +10.99 X13 +18.48 X14 - 10.75 X21 +15.16 X22 +9.65 X23 +18.5 X24
D) minimize cost = (13 X11 +15.25 X12 +10.99 X13 +18.48 X14 - 10.75 X21 +15.16 X22 +9.65 X23 +18.5 X24 )(1,250 / 750)
Unlock Deck
Unlock for access to all 49 flashcards in this deck.
Unlock Deck
k this deck
14
Use the table below to answer the following question(s).
The Riviera Transport Company (RTC) produces car accessories at two plants: Dallas and Atlanta. They ship them to major distribution centers in Houston, San Jose, Jacksonville, and Memphis. The accounting, production, and marketing departments have provided the information in the table below, which shows the unit cost of shipping between any plant and distribution center, plant capacities over the next planning period, and distribution center demands. RTC's supply chain manager faces the problem of determining how much to ship between each plant and distribution center to minimize the total transportation cost, not exceed available capacity, and meet customer demand.
Assume Xij = amount shipped from plant i to distribution center j, where i = 1 represents Dallas,
i = 2 represents Atlanta, j = 1 represents Houston, and so on. Answer the following question(s) using a linear optimization model.
-According to the Sensitivity report on the model, by what price should the unit cost of shipment reduce to make shipment from Dallas to Houston feasible?
A) $8.68
B) $2.16
C) $10.84
D) $3.41
Unlock Deck
Unlock for access to all 49 flashcards in this deck.
Unlock Deck
k this deck
15
Use the table below to answer the following question(s).
The Riviera Transport Company (RTC) produces car accessories at two plants: Dallas and Atlanta. They ship them to major distribution centers in Houston, San Jose, Jacksonville, and Memphis. The accounting, production, and marketing departments have provided the information in the table below, which shows the unit cost of shipping between any plant and distribution center, plant capacities over the next planning period, and distribution center demands. RTC's supply chain manager faces the problem of determining how much to ship between each plant and distribution center to minimize the total transportation cost, not exceed available capacity, and meet customer demand.
Assume Xij = amount shipped from plant i to distribution center j, where i = 1 represents Dallas,
i = 2 represents Atlanta, j = 1 represents Houston, and so on. Answer the following question(s) using a linear optimization model.
-Which of the following is the constraint for total amount shipped from Atlanta?
A) X11 + X12 + X13 + X14 - X21 + X22 + X23 + X24 ? 850
B) X21 + X22 + X23 + X24 ? 750
C) X21 + X22 + X23 + X24 ? 1250
D) X11 + X12 + X13 + X14 ? 1250
Unlock Deck
Unlock for access to all 49 flashcards in this deck.
Unlock Deck
k this deck
16
Use the table below to answer the following question(s).
The Riviera Transport Company (RTC) produces car accessories at two plants: Dallas and Atlanta. They ship them to major distribution centers in Houston, San Jose, Jacksonville, and Memphis. The accounting, production, and marketing departments have provided the information in the table below, which shows the unit cost of shipping between any plant and distribution center, plant capacities over the next planning period, and distribution center demands. RTC's supply chain manager faces the problem of determining how much to ship between each plant and distribution center to minimize the total transportation cost, not exceed available capacity, and meet customer demand.
Assume Xij = amount shipped from plant i to distribution center j, where i = 1 represents Dallas,
i = 2 represents Atlanta, j = 1 represents Houston, and so on. Answer the following question(s) using a linear optimization model.
-According to the transportation model, what is the total cost incurred by Riviera Transport Company?
A) $29,016.95
B) $26,698.95
C) $20,331.35
D) $41,978.75
Unlock Deck
Unlock for access to all 49 flashcards in this deck.
Unlock Deck
k this deck
17
Problem statements such as production must be sufficient to meet promised customer orders would be categorized as a constraint.
A) limitations
B) requirements
C) proportional relationships
D) balance
A) limitations
B) requirements
C) proportional relationships
D) balance
Unlock Deck
Unlock for access to all 49 flashcards in this deck.
Unlock Deck
k this deck
18
Use the table below to answer the following question(s).
The Riviera Transport Company (RTC) produces car accessories at two plants: Dallas and Atlanta. They ship them to major distribution centers in Houston, San Jose, Jacksonville, and Memphis. The accounting, production, and marketing departments have provided the information in the table below, which shows the unit cost of shipping between any plant and distribution center, plant capacities over the next planning period, and distribution center demands. RTC's supply chain manager faces the problem of determining how much to ship between each plant and distribution center to minimize the total transportation cost, not exceed available capacity, and meet customer demand.
Assume Xij = amount shipped from plant i to distribution center j, where i = 1 represents Dallas,
i = 2 represents Atlanta, j = 1 represents Houston, and so on. Answer the following question(s) using a linear optimization model.
-According to the transportation model, what is the amount shipped from Atlanta to Memphis?
A) 480
B) 0
C) 230
D) 950
Unlock Deck
Unlock for access to all 49 flashcards in this deck.
Unlock Deck
k this deck
19
Use the table below to answer the following question(s).
The Riviera Transport Company (RTC) produces car accessories at two plants: Dallas and Atlanta. They ship them to major distribution centers in Houston, San Jose, Jacksonville, and Memphis. The accounting, production, and marketing departments have provided the information in the table below, which shows the unit cost of shipping between any plant and distribution center, plant capacities over the next planning period, and distribution center demands. RTC's supply chain manager faces the problem of determining how much to ship between each plant and distribution center to minimize the total transportation cost, not exceed available capacity, and meet customer demand.
Assume Xij = amount shipped from plant i to distribution center j, where i = 1 represents Dallas,
i = 2 represents Atlanta, j = 1 represents Houston, and so on. Answer the following question(s) using a linear optimization model.
-According to the transportation model, what is the amount shipped from Atlanta to Jacksonville?
A) 950
B) 480
C) 0
D) 95
Unlock Deck
Unlock for access to all 49 flashcards in this deck.
Unlock Deck
k this deck
20
Use the table below to answer the following question(s).
The Riviera Transport Company (RTC) produces car accessories at two plants: Dallas and Atlanta. They ship them to major distribution centers in Houston, San Jose, Jacksonville, and Memphis. The accounting, production, and marketing departments have provided the information in the table below, which shows the unit cost of shipping between any plant and distribution center, plant capacities over the next planning period, and distribution center demands. RTC's supply chain manager faces the problem of determining how much to ship between each plant and distribution center to minimize the total transportation cost, not exceed available capacity, and meet customer demand.
Assume Xij = amount shipped from plant i to distribution center j, where i = 1 represents Dallas,
i = 2 represents Atlanta, j = 1 represents Houston, and so on. Answer the following question(s) using a linear optimization model.
-Which of the following is the constraint of nonnegativity for all values of i and j?
A) 13 X11 +15.25 X12 +10.99 X13 +18.48 X14 / 10.75 X21 +15.16 X22 + 9.65 X23 +18.5 X24 ? 0
B) Xij ? 0, for all i and j
C) Xij ? 0, for all i and j
D)
Unlock Deck
Unlock for access to all 49 flashcards in this deck.
Unlock Deck
k this deck
21
Use the table below to answer the following question(s).
Pickson Luthiers Corporation makes four models of electric guitars, ScarCT, Dela Mort, Warax, and Invazen. Each guitar must flow through five departments, assembly, painting, sound testing, inspection, and packaging. The table below shows the relevant data. Production rates are shown in units/hour. (ScarCT is assembled elsewhere). Pickson wants to determine how many guitars to make to maximize monthly profit. Use a linear optimization model based on the data to answer the following question.
-According to the Sensitivity Report, by how much should the unit profit on ScarCT be increased in order for its production to be feasible?
A) $30
B) $90
C) $60
D) $120
Unlock Deck
Unlock for access to all 49 flashcards in this deck.
Unlock Deck
k this deck
22
Use the table below to answer the following question(s).
Pickson Luthiers Corporation makes four models of electric guitars, ScarCT, Dela Mort, Warax, and Invazen. Each guitar must flow through five departments, assembly, painting, sound testing, inspection, and packaging. The table below shows the relevant data. Production rates are shown in units/hour. (ScarCT is assembled elsewhere). Pickson wants to determine how many guitars to make to maximize monthly profit. Use a linear optimization model based on the data to answer the following question.
-According to the linear optimization model, what is the net profit per unit on Dela Mort?
A) $205,200
B) $108
C) $680
D) $90
Unlock Deck
Unlock for access to all 49 flashcards in this deck.
Unlock Deck
k this deck
23
Keychain Publishing is planning to release two books, simultaneously, by the same author. One is a fictional book, while the other is the author's autobiography. The details of its cost, production, and demand are given in the table below. Keychain Publishing has $150,000 available to bind books and advertise them with an objective of maximizing profit contribution. Provide the objective function for maximizing profits, along with its constraints.
Keychain Publishing has $150,000 available to bind books and advertise them with an objective of maximizing profit contribution. Provide the objective function for maximizing profits, along with its constraints. Unlock Deck
Unlock for access to all 49 flashcards in this deck.
Unlock Deck
k this deck
24
Use the table below to answer the following question(s).
Letherin Hides is a company that makes boots specifically targeting college students. Forecasts of sales for the next year are 200 in the summer, 450 in the autumn, and 500 in the winter.
Accessories that are used on the boots are purchased from a supplier for $31.66. The cost of capital is estimated to be 24% per year (or 6% per quarter); thus, the holding cost per item is 0.06($31.66) = $1.9 per quarter (rounded figure). Letherin Hides hires freelance art designers at part-time to craft designs during the summer, and they earn $6 per hour. In the autumn, labor is more difficult to keep, and the owner must pay $6.5 per hour to retain qualified help. Because of the high demand for part-time help during the winter holiday season, labor rates are higher in the winter, and workers earn $7.75 per hour. Each boot design takes 2 hours to complete. How should production be planned over the three quarters to minimize the combined production and inventory holding costs?
The table below provides information on Letherin Hides boot design cost and production. Use a linear optimization model based on the data to answer the following questions.
-According to the linear optimization model, what is the net production for autumn?
A) 200
B) 500
C) 450
D) 50
Unlock Deck
Unlock for access to all 49 flashcards in this deck.
Unlock Deck
k this deck
25
Use the table below to answer the following question(s).
Letherin Hides is a company that makes boots specifically targeting college students. Forecasts of sales for the next year are 200 in the summer, 450 in the autumn, and 500 in the winter.
Accessories that are used on the boots are purchased from a supplier for $31.66. The cost of capital is estimated to be 24% per year (or 6% per quarter); thus, the holding cost per item is 0.06($31.66) = $1.9 per quarter (rounded figure). Letherin Hides hires freelance art designers at part-time to craft designs during the summer, and they earn $6 per hour. In the autumn, labor is more difficult to keep, and the owner must pay $6.5 per hour to retain qualified help. Because of the high demand for part-time help during the winter holiday season, labor rates are higher in the winter, and workers earn $7.75 per hour. Each boot design takes 2 hours to complete. How should production be planned over the three quarters to minimize the combined production and inventory holding costs?
The table below provides information on Letherin Hides boot design cost and production. Use a linear optimization model based on the data to answer the following questions.
-According to the linear optimization model, what is the inventory held at the end of summer?
A) 450
B) 0
C) 200
D) 550
Unlock Deck
Unlock for access to all 49 flashcards in this deck.
Unlock Deck
k this deck
26
Use the table below to answer the following question(s).
Pickson Luthiers Corporation makes four models of electric guitars, ScarCT, Dela Mort, Warax, and Invazen. Each guitar must flow through five departments, assembly, painting, sound testing, inspection, and packaging. The table below shows the relevant data. Production rates are shown in units/hour. (ScarCT is assembled elsewhere). Pickson wants to determine how many guitars to make to maximize monthly profit. Use a linear optimization model based on the data to answer the following question.
-According to the linear optimization model, what would be the total time spent for assembling the Invazen models?
A) 8
B) 4
C) 16
D) 10
Unlock Deck
Unlock for access to all 49 flashcards in this deck.
Unlock Deck
k this deck
27
Use the table below to answer the following question(s).
Pickson Luthiers Corporation makes four models of electric guitars, ScarCT, Dela Mort, Warax, and Invazen. Each guitar must flow through five departments, assembly, painting, sound testing, inspection, and packaging. The table below shows the relevant data. Production rates are shown in units/hour. (ScarCT is assembled elsewhere). Pickson wants to determine how many guitars to make to maximize monthly profit. Use a linear optimization model based on the data to answer the following question.
-According to the linear optimization model, what is the total profit for the Pickson Luthiers Corporation?
A) $10,000
B) $199,880
C) $205,200
D) $219,200
Unlock Deck
Unlock for access to all 49 flashcards in this deck.
Unlock Deck
k this deck
28
Use the table below to answer the following question(s).
Pickson Luthiers Corporation makes four models of electric guitars, ScarCT, Dela Mort, Warax, and Invazen. Each guitar must flow through five departments, assembly, painting, sound testing, inspection, and packaging. The table below shows the relevant data. Production rates are shown in units/hour. (ScarCT is assembled elsewhere). Pickson wants to determine how many guitars to make to maximize monthly profit. Use a linear optimization model based on the data to answer the following question.
-According to the linear optimization model, what would be the total time spent on inspecting the Dela Mort models?
A) 158.33
B) 12.5
C) 85
D) 48
Unlock Deck
Unlock for access to all 49 flashcards in this deck.
Unlock Deck
k this deck
29
Use the table below to answer the following question(s).
Letherin Hides is a company that makes boots specifically targeting college students. Forecasts of sales for the next year are 200 in the summer, 450 in the autumn, and 500 in the winter.
Accessories that are used on the boots are purchased from a supplier for $31.66. The cost of capital is estimated to be 24% per year (or 6% per quarter); thus, the holding cost per item is 0.06($31.66) = $1.9 per quarter (rounded figure). Letherin Hides hires freelance art designers at part-time to craft designs during the summer, and they earn $6 per hour. In the autumn, labor is more difficult to keep, and the owner must pay $6.5 per hour to retain qualified help. Because of the high demand for part-time help during the winter holiday season, labor rates are higher in the winter, and workers earn $7.75 per hour. Each boot design takes 2 hours to complete. How should production be planned over the three quarters to minimize the combined production and inventory holding costs?
The table below provides information on Letherin Hides boot design cost and production. Use a linear optimization model based on the data to answer the following questions.
-According to the linear optimization model, what is the net production for winter?
A) 0
B) 950
C) 200
D) 500
Unlock Deck
Unlock for access to all 49 flashcards in this deck.
Unlock Deck
k this deck
30
Use the table below to answer the following question(s).
Pickson Luthiers Corporation makes four models of electric guitars, ScarCT, Dela Mort, Warax, and Invazen. Each guitar must flow through five departments, assembly, painting, sound testing, inspection, and packaging. The table below shows the relevant data. Production rates are shown in units/hour. (ScarCT is assembled elsewhere). Pickson wants to determine how many guitars to make to maximize monthly profit. Use a linear optimization model based on the data to answer the following question.
-According to the linear optimization model, what would be the total time spent for packaging the Invazen models?
A) 8
B) 16
C) 20
D) 10
Unlock Deck
Unlock for access to all 49 flashcards in this deck.
Unlock Deck
k this deck
31
The mathematical form Y ≤ 450 would be considered as representing a simple bounds constraint.
Unlock Deck
Unlock for access to all 49 flashcards in this deck.
Unlock Deck
k this deck
32
Use the table below to answer the following question(s).
Pickson Luthiers Corporation makes four models of electric guitars, ScarCT, Dela Mort, Warax, and Invazen. Each guitar must flow through five departments, assembly, painting, sound testing, inspection, and packaging. The table below shows the relevant data. Production rates are shown in units/hour. (ScarCT is assembled elsewhere). Pickson wants to determine how many guitars to make to maximize monthly profit. Use a linear optimization model based on the data to answer the following question.
-According to the linear optimization model, what would be the total time spent for sound testing the Warax model?
A) 5
B) 4
C) 6
D) 10.5
Unlock Deck
Unlock for access to all 49 flashcards in this deck.
Unlock Deck
k this deck
33
Use the table below to answer the following question(s).
Letherin Hides is a company that makes boots specifically targeting college students. Forecasts of sales for the next year are 200 in the summer, 450 in the autumn, and 500 in the winter.
Accessories that are used on the boots are purchased from a supplier for $31.66. The cost of capital is estimated to be 24% per year (or 6% per quarter); thus, the holding cost per item is 0.06($31.66) = $1.9 per quarter (rounded figure). Letherin Hides hires freelance art designers at part-time to craft designs during the summer, and they earn $6 per hour. In the autumn, labor is more difficult to keep, and the owner must pay $6.5 per hour to retain qualified help. Because of the high demand for part-time help during the winter holiday season, labor rates are higher in the winter, and workers earn $7.75 per hour. Each boot design takes 2 hours to complete. How should production be planned over the three quarters to minimize the combined production and inventory holding costs?
The table below provides information on Letherin Hides boot design cost and production. Use a linear optimization model based on the data to answer the following questions.
-According to the linear optimization model, what is the inventory held at the end of autumn?
A) 0
B) 200
C) 950
D) 500
Unlock Deck
Unlock for access to all 49 flashcards in this deck.
Unlock Deck
k this deck
34
Use the table below to answer the following question(s).
Letherin Hides is a company that makes boots specifically targeting college students. Forecasts of sales for the next year are 200 in the summer, 450 in the autumn, and 500 in the winter.
Accessories that are used on the boots are purchased from a supplier for $31.66. The cost of capital is estimated to be 24% per year (or 6% per quarter); thus, the holding cost per item is 0.06($31.66) = $1.9 per quarter (rounded figure). Letherin Hides hires freelance art designers at part-time to craft designs during the summer, and they earn $6 per hour. In the autumn, labor is more difficult to keep, and the owner must pay $6.5 per hour to retain qualified help. Because of the high demand for part-time help during the winter holiday season, labor rates are higher in the winter, and workers earn $7.75 per hour. Each boot design takes 2 hours to complete. How should production be planned over the three quarters to minimize the combined production and inventory holding costs?
The table below provides information on Letherin Hides boot design cost and production. Use a linear optimization model based on the data to answer the following questions.
-According to the linear optimization model, what is the total cost incurred by Letherin Hides for the combined seasons?
A) $17,885
B) $15,605
C) $15,700
D) $18,700
Unlock Deck
Unlock for access to all 49 flashcards in this deck.
Unlock Deck
k this deck
35
Use the table below to answer the following question(s).
Letherin Hides is a company that makes boots specifically targeting college students. Forecasts of sales for the next year are 200 in the summer, 450 in the autumn, and 500 in the winter.
Accessories that are used on the boots are purchased from a supplier for $31.66. The cost of capital is estimated to be 24% per year (or 6% per quarter); thus, the holding cost per item is 0.06($31.66) = $1.9 per quarter (rounded figure). Letherin Hides hires freelance art designers at part-time to craft designs during the summer, and they earn $6 per hour. In the autumn, labor is more difficult to keep, and the owner must pay $6.5 per hour to retain qualified help. Because of the high demand for part-time help during the winter holiday season, labor rates are higher in the winter, and workers earn $7.75 per hour. Each boot design takes 2 hours to complete. How should production be planned over the three quarters to minimize the combined production and inventory holding costs?
The table below provides information on Letherin Hides boot design cost and production. Use a linear optimization model based on the data to answer the following questions.
-According to the linear optimization model, what is the total amount to be produced in summer?
A) 200
B) 100
C) 550
D) 0
Unlock Deck
Unlock for access to all 49 flashcards in this deck.
Unlock Deck
k this deck
36
Use the table below to answer the following question(s).
Pickson Luthiers Corporation makes four models of electric guitars, ScarCT, Dela Mort, Warax, and Invazen. Each guitar must flow through five departments, assembly, painting, sound testing, inspection, and packaging. The table below shows the relevant data. Production rates are shown in units/hour. (ScarCT is assembled elsewhere). Pickson wants to determine how many guitars to make to maximize monthly profit. Use a linear optimization model based on the data to answer the following question.
-According to the linear optimization model, which of the following departments uses all the time that it is allocated to finish its job?
A) assembly
B) painting
C) inspection
D) packaging
Unlock Deck
Unlock for access to all 49 flashcards in this deck.
Unlock Deck
k this deck
37
Use the table below to answer the following question(s).
Pickson Luthiers Corporation makes four models of electric guitars, ScarCT, Dela Mort, Warax, and Invazen. Each guitar must flow through five departments, assembly, painting, sound testing, inspection, and packaging. The table below shows the relevant data. Production rates are shown in units/hour. (ScarCT is assembled elsewhere). Pickson wants to determine how many guitars to make to maximize monthly profit. Use a linear optimization model based on the data to answer the following question.
-According to the linear optimization model, what is the total profit contribution by the Invazen model?
A) $205,200
B) $20,000
C) $10,000
D) $4,000
Unlock Deck
Unlock for access to all 49 flashcards in this deck.
Unlock Deck
k this deck
38
Use the table below to answer the following question(s).
The Riviera Transport Company (RTC) produces car accessories at two plants: Dallas and Atlanta. They ship them to major distribution centers in Houston, San Jose, Jacksonville, and Memphis. The accounting, production, and marketing departments have provided the information in the table below, which shows the unit cost of shipping between any plant and distribution center, plant capacities over the next planning period, and distribution center demands. RTC's supply chain manager faces the problem of determining how much to ship between each plant and distribution center to minimize the total transportation cost, not exceed available capacity, and meet customer demand.
Assume Xij = amount shipped from plant i to distribution center j, where i = 1 represents Dallas,
i = 2 represents Atlanta, j = 1 represents Houston, and so on. Answer the following question(s) using a linear optimization model.
-In a sensitivity report, a solution is considered a(n) solution if the right-hand-side value of any constraint has a zero Allowable Increase or Allowable Decrease.
A) algorithmic
B) unbounded
C) infeasible
D) degenerate
Unlock Deck
Unlock for access to all 49 flashcards in this deck.
Unlock Deck
k this deck
39
Use the table below to answer the following question(s).
Pickson Luthiers Corporation makes four models of electric guitars, ScarCT, Dela Mort, Warax, and Invazen. Each guitar must flow through five departments, assembly, painting, sound testing, inspection, and packaging. The table below shows the relevant data. Production rates are shown in units/hour. (ScarCT is assembled elsewhere). Pickson wants to determine how many guitars to make to maximize monthly profit. Use a linear optimization model based on the data to answer the following question.
-According to the linear optimization model, what is the total hours spent for painting all the models?
A) 220
B) 94.94
C) 109.67
D) 199.44
Unlock Deck
Unlock for access to all 49 flashcards in this deck.
Unlock Deck
k this deck
40
Use the table below to answer the following question(s).
Pickson Luthiers Corporation makes four models of electric guitars, ScarCT, Dela Mort, Warax, and Invazen. Each guitar must flow through five departments, assembly, painting, sound testing, inspection, and packaging. The table below shows the relevant data. Production rates are shown in units/hour. (ScarCT is assembled elsewhere). Pickson wants to determine how many guitars to make to maximize monthly profit. Use a linear optimization model based on the data to answer the following question.
-According to the linear optimization model, what is the total number of ScarCTs produced?
A) 2500
B) 750
C) 0
D) 100
Unlock Deck
Unlock for access to all 49 flashcards in this deck.
Unlock Deck
k this deck
41
Give an account of balance constraints with some examples of verbal clues.
Unlock Deck
Unlock for access to all 49 flashcards in this deck.
Unlock Deck
k this deck
42
Linear optimization cannot be used on problems having multiple time periods.
Unlock Deck
Unlock for access to all 49 flashcards in this deck.
Unlock Deck
k this deck
43
Nonnegativity of the decision variables is an example of an explicit constraint.
Unlock Deck
Unlock for access to all 49 flashcards in this deck.
Unlock Deck
k this deck
44
When interpreting sensitivity analysis information for changes in model parameters, all other model parameters are held constant.
Unlock Deck
Unlock for access to all 49 flashcards in this deck.
Unlock Deck
k this deck
45
How does Excel's Solver help interpret reduced cost as shadow price for bounded variables?
Unlock Deck
Unlock for access to all 49 flashcards in this deck.
Unlock Deck
k this deck
46
How does Solver handle simple lower bounds and upper bounds compared to ordinary constraints?
Unlock Deck
Unlock for access to all 49 flashcards in this deck.
Unlock Deck
k this deck
47
List out the different types of constraints that help model formulation.
Unlock Deck
Unlock for access to all 49 flashcards in this deck.
Unlock Deck
k this deck
48
What is degeneracy in linear optimization? Give an example.
Unlock Deck
Unlock for access to all 49 flashcards in this deck.
Unlock Deck
k this deck
49
Degeneracy does not impact the interpretation of sensitivity analysis information.
Unlock Deck
Unlock for access to all 49 flashcards in this deck.
Unlock Deck
k this deck
Unlock Deck
Unlock for access to all 49 flashcards in this deck.


