Deck 24: Index Numbers
Full screen (f)
Question
Question
If the Laspeyres price index for a basket of goods is 128 and the Paasche price index for the same basket of goods for the same time period is 119, which of the following is the value of the Fischer price index, the geometric mean of these two indices? 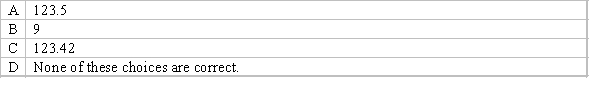
Question
Question
Which of the following is the correct interpretation of a Paasche price index of 75, where the base year is 2009 and the current year is 2011? 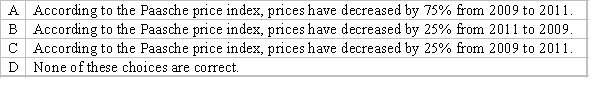
Question
Which of the following is the correct interpretation of a Laspeyres price index of 135, where the base year is 2007 and the current year is 2010? 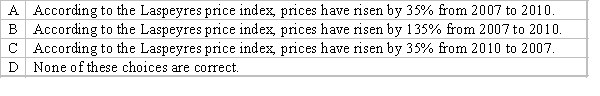
Question
What is the value of Real GDP in 2008 if Nominal GDP was 1 131 586 ($million) and CPI was 161.4? 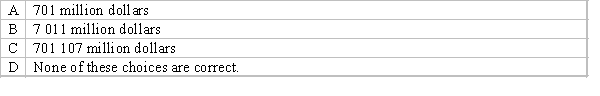
Question
Question
In 2002 your annual salary was $50 000 and in 2007 your annual salary is $75 000. The CPI in 2002 was 136 and the CPI in 2007 was 156.1. Which of the following is the percentage change in your real income from 2002 to 2007? 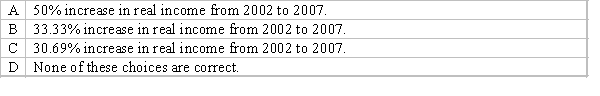
Question
Which of the following statements is correct? 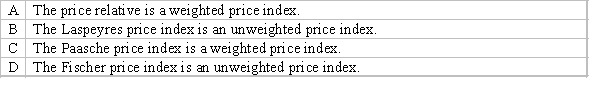
Question
Question
The table below lists two index number series for median household income of a particular country. 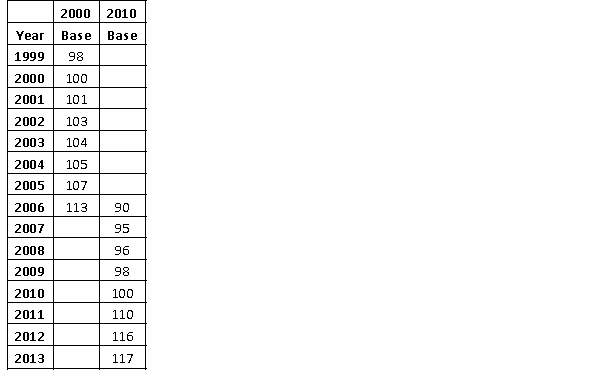 (a) Complete the 2000 index and the 2010 index by filling in the missing values.
(b) Interpret the 2013 value using each index.
(c) Which of your interpretations in part (b) do you prefer? Explain.
(a) Complete the 2000 index and the 2010 index by filling in the missing values.(b) Interpret the 2013 value using each index.
(c) Which of your interpretations in part (b) do you prefer? Explain.
Question
Question
Which of the following best describes the Australian consumer price index (CPI)? 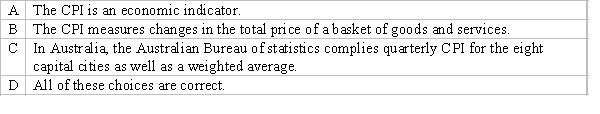
Question
Question
Question
Question
Question
Which of the following statements is correct? 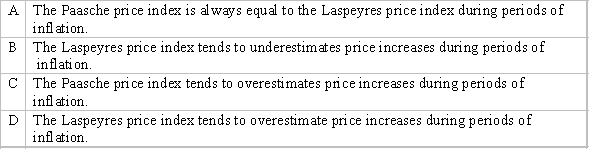
Question
Which of the following is the value of annual real income for an annual salary of $85,000 when the CPI is 125? 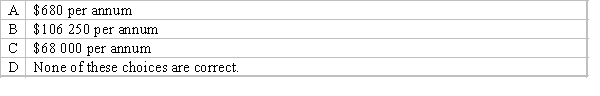
Question
Which of the following statements is correct? 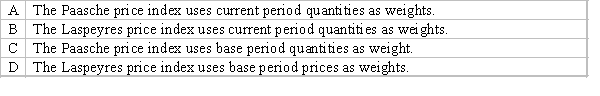
Question
Question
Question
Question
The gross domestic product is often used as a measure of the economic performance of a country. The annual GDP of Australia for the years 1990-98 is shown in the following table. Use the CPI in Table 23.2 in the textbook (pp 966-7) to deflate these figures to 1993 dollars. 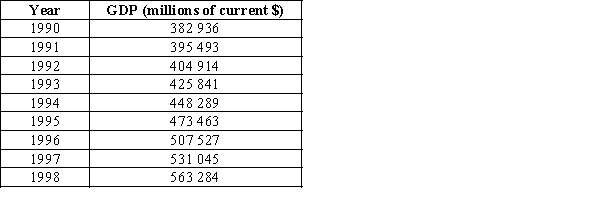 Source: Australian Bureau of Statistics, Australian Economic Indicators, ABS Cat. No. 1350.0, ABS, Canberra.
Source: Australian Bureau of Statistics, Australian Economic Indicators, ABS Cat. No. 1350.0, ABS, Canberra. Question
Question
Question

Unlock Deck
Sign up to unlock the cards in this deck!
Unlock Deck
Unlock Deck
1/27
Play
Full screen (f)
Deck 24: Index Numbers
1
Real GDP is real Nominal GDP divided by the CPI/100.
True
2
If the Laspeyres price index for a basket of goods is 128 and the Paasche price index for the same basket of goods for the same time period is 119, which of the following is the value of the Fischer price index, the geometric mean of these two indices?
C
3
A simple aggregate price index is the ratio of the sum of the prices of the n commodities in the current period to the sum in some base period, multiplied by 100.
True
4
Which of the following is the correct interpretation of a Paasche price index of 75, where the base year is 2009 and the current year is 2011?
Unlock Deck
Unlock for access to all 27 flashcards in this deck.
Unlock Deck
k this deck
5
Which of the following is the correct interpretation of a Laspeyres price index of 135, where the base year is 2007 and the current year is 2010?
Unlock Deck
Unlock for access to all 27 flashcards in this deck.
Unlock Deck
k this deck
6
What is the value of Real GDP in 2008 if Nominal GDP was 1 131 586 ($million) and CPI was 161.4?
Unlock Deck
Unlock for access to all 27 flashcards in this deck.
Unlock Deck
k this deck
7
A simple price index is the ratio of the price of a commodity in the current period to its value in some base period, multiplied by 100.
Unlock Deck
Unlock for access to all 27 flashcards in this deck.
Unlock Deck
k this deck
8
In 2002 your annual salary was $50 000 and in 2007 your annual salary is $75 000. The CPI in 2002 was 136 and the CPI in 2007 was 156.1. Which of the following is the percentage change in your real income from 2002 to 2007?
Unlock Deck
Unlock for access to all 27 flashcards in this deck.
Unlock Deck
k this deck
9
Which of the following statements is correct?
Unlock Deck
Unlock for access to all 27 flashcards in this deck.
Unlock Deck
k this deck
10
The Fisher price index is the median of the Laspeyres price index and the Paasche price index.
Unlock Deck
Unlock for access to all 27 flashcards in this deck.
Unlock Deck
k this deck
11
The table below lists two index number series for median household income of a particular country. (a) Complete the 2000 index and the 2010 index by filling in the missing values.
(b) Interpret the 2013 value using each index.
(c) Which of your interpretations in part (b) do you prefer? Explain.
(a) Complete the 2000 index and the 2010 index by filling in the missing values.(b) Interpret the 2013 value using each index.
(c) Which of your interpretations in part (b) do you prefer? Explain.
Unlock Deck
Unlock for access to all 27 flashcards in this deck.
Unlock Deck
k this deck
12
An average of relatives price index is the ratio of the price of a commodity in the current period to its value in some base period, multiplied by 100.
Unlock Deck
Unlock for access to all 27 flashcards in this deck.
Unlock Deck
k this deck
13
Which of the following best describes the Australian consumer price index (CPI)?
Unlock Deck
Unlock for access to all 27 flashcards in this deck.
Unlock Deck
k this deck
14
The All Ordinaries Index measures the average daily closing share prices of the 500 largest companies listed on the Australian Securities Exchange.
Unlock Deck
Unlock for access to all 27 flashcards in this deck.
Unlock Deck
k this deck
15
The Fisher price index is the geometric mean of the Laspeyres price index and the Paasche price index.
Unlock Deck
Unlock for access to all 27 flashcards in this deck.
Unlock Deck
k this deck
16
The table below is the Laspeyres price index for a basket of goods related to the Computer IT industry. (a) Calculate and interpret the percentage price change from 2005 to 2013, using the 1988 base
index.
(b) Change the base of this index series to 2005. Explain why a base change may be useful.
(c) Using the series with base 2005 that you created in part (b) recalculate the percentage price change from 2005 to 2013. Interpret.
(d) Compare your answers from parts (a) and (c), in particular explain which value is a change in percentage points and which value is the percentage change.
Unlock Deck
Unlock for access to all 27 flashcards in this deck.
Unlock Deck
k this deck
17
Real income is nominal income multiplied by the CPI (times 100).
Unlock Deck
Unlock for access to all 27 flashcards in this deck.
Unlock Deck
k this deck
18
Which of the following statements is correct?
Unlock Deck
Unlock for access to all 27 flashcards in this deck.
Unlock Deck
k this deck
19
Which of the following is the value of annual real income for an annual salary of $85,000 when the CPI is 125?
Unlock Deck
Unlock for access to all 27 flashcards in this deck.
Unlock Deck
k this deck
20
Which of the following statements is correct?
Unlock Deck
Unlock for access to all 27 flashcards in this deck.
Unlock Deck
k this deck
21
In September 1997, a Brisbane family's weekly diet consisted of 6 kg of fish, 2 kg of beef and 2 kg of veal. One year later, because of the cost increases in these products, the family's diet has changed so that each week they consume 4 kg of chicken and 1 kg each of beef, veal, pork and fish. The prices are listed in the table below.
Calculate the Laspeyres price index for 1998, using 1997 as the base.
Calculate the Laspeyres price index for 1998, using 1997 as the base.
Unlock Deck
Unlock for access to all 27 flashcards in this deck.
Unlock Deck
k this deck
22
In September 1997, a Brisbane family's weekly diet consisted of 6 kg of fish, 2 kg of beef and 2 kg of veal. One year later, because of the cost increases in these products, the family's diet has changed so that each week they consume 4 kg of chicken and 1 kg each of beef, veal, pork and fish. The prices are listed in the table below.
Calculate the Paasche price index for 1998, using 1997 as the base.
Calculate the Paasche price index for 1998, using 1997 as the base.
Unlock Deck
Unlock for access to all 27 flashcards in this deck.
Unlock Deck
k this deck
23
The Australian Bureau of Statistics regularly publishes the average retail prices of selected items for each Australian capital city. The following table presents the prices of oranges, bananas, potatoes, tomatoes, carrots and onions in Melbourne during the June quarter in 2008 and 2010. Construct a simple aggregate index of the prices for the fruit and vegetable group using June 2008 as the base period.
Unlock Deck
Unlock for access to all 27 flashcards in this deck.
Unlock Deck
k this deck
24
The gross domestic product is often used as a measure of the economic performance of a country. The annual GDP of Australia for the years 1990-98 is shown in the following table. Use the CPI in Table 23.2 in the textbook (pp 966-7) to deflate these figures to 1993 dollars. Source: Australian Bureau of Statistics, Australian Economic Indicators, ABS Cat. No. 1350.0, ABS, Canberra.
Source: Australian Bureau of Statistics, Australian Economic Indicators, ABS Cat. No. 1350.0, ABS, Canberra. Unlock Deck
Unlock for access to all 27 flashcards in this deck.
Unlock Deck
k this deck
25
Construct the index of average weekly earnings of Australian male employees for the period
1990-1998, using the data in the following table. Use 1990 as the base year. Average weekly earnings of Australian
male employees, 1990-98
Source: Australian Bureau of Statistics, Australian Economic Indicators, ABS Cat. No. 1350.0, ABS, Canberra.
1990-1998, using the data in the following table. Use 1990 as the base year. Average weekly earnings of Australian
male employees, 1990-98
Source: Australian Bureau of Statistics, Australian Economic Indicators, ABS Cat. No. 1350.0, ABS, Canberra.
Unlock Deck
Unlock for access to all 27 flashcards in this deck.
Unlock Deck
k this deck
26
The following are the two CPI series (one for 1985-1989 with base 1980 = 100 and the other for 1989-1992 with base 1990 = 100) published in various issues of ABS publications. Create a new CPI series for the period 1985-1992 with 1990 as the base year.
Unlock Deck
Unlock for access to all 27 flashcards in this deck.
Unlock Deck
k this deck
27
The Australian Bureau of Statistics regularly publishes the average retail prices of selected items for each Australian capital city. The following table presents the prices of oranges, bananas, potatoes, tomatoes, carrots and onions in Melbourne during the June quarter in 2008 and 2010. Construct the average of relative price indexes for the fruit and vegetable group for June 2010 (with base June 2008 = 100).
Unlock Deck
Unlock for access to all 27 flashcards in this deck.
Unlock Deck
k this deck
Unlock Deck
Unlock for access to all 27 flashcards in this deck.


