Deck 13: Hypothesis Testing: Describing a Single Population
Full screen (f)
Question
Which of the following p-values will lead us to reject the null hypothesis if the level of significance equals 0.10? 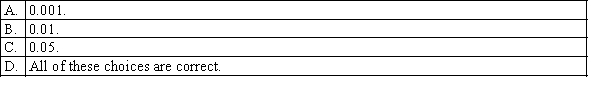
Question
Suppose that we reject a null hypothesis at the 0.05 level of significance. For which of the following  -values do we also reject the null hypothesis?
-values do we also reject the null hypothesis? Question
In testing the hypotheses:  500
500  500, if the value of the Z test statistic equals 2.03, then the p-value is:
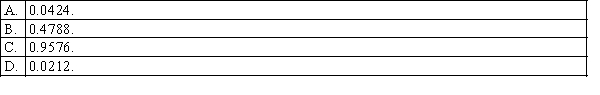
500 500, if the value of the Z test statistic equals 2.03, then the p-value is: Question
Question
In a two-tail test for the population mean, the null hypothesis will be rejected at the  level of significance if the value of the standardised test statistic z is such that:
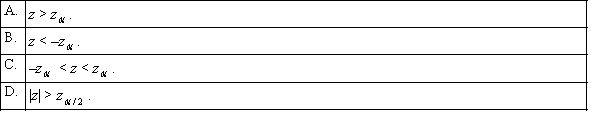
level of significance if the value of the standardised test statistic z is such that: Question
For a two-tail Z test, the null hypothesis will be rejected at the 0.05 level of significance if the value of the standardised test statistic is: 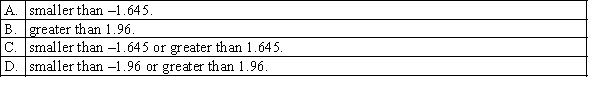
Question
Question
In order to determine the p-value, which of the following items of information is not needed? 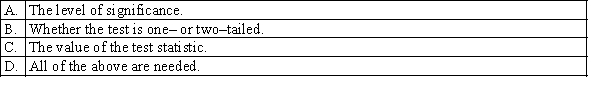
Question
If the research question is not an equality statement, then in hypothesis testing it is specified as: 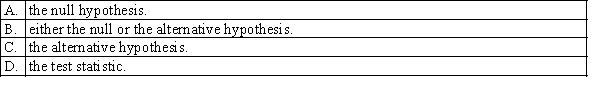
Question
If a hypothesis is not rejected at the 0.10 level of significance, it: 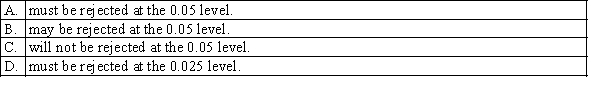
Question
In testing the hypotheses  75.
75. 
 < 75. if the value of the Z test statistic equals 1.78, then the p-value is:
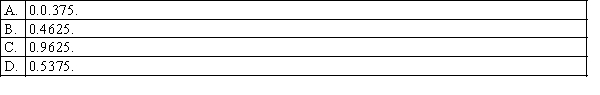
75. < 75. if the value of the Z test statistic equals 1.78, then the p-value is: Question
Question
Question
Question
Suppose you intend to test the claim that a typical high school student in Sydney spends more than $50 a week on mobile phone calls. Which hypotheses are used to test the claim? 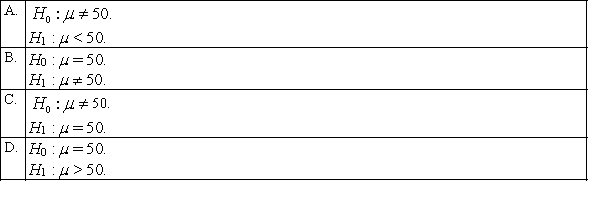
Question
If a hypothesis is rejected at the 0.025 level of significance, it: 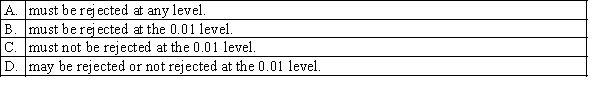
Question
Question
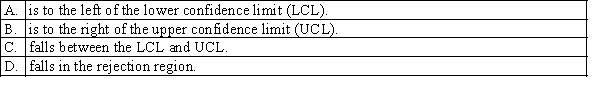
Using the confidence interval when conducting a two-tail test for the population mean  we do not reject the null hypothesis if the hypothesised value for
  :
: 
we do not reject the null hypothesis if the hypothesised value for : Question
Question
Question
For a given level of significance, if the sample size decreases, the probability of a Type II error will: 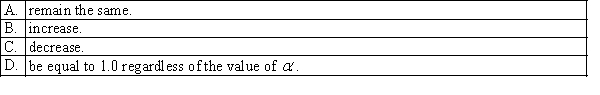
Question
In a criminal trial, a Type II error is made when: 
Question
Question
In a given hypothesis test, the null hypothesis can be rejected at the 0.10 level of significance, but cannot be rejected at the 0.05 and 0.01 levels. The most accurate statement about the p-value for this test is: 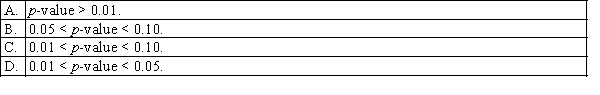
Question
Question
Question
The probability of a Type II error is denoted by: 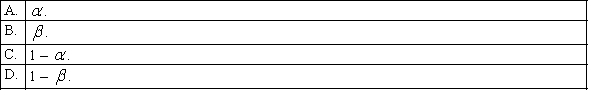
Question
In a criminal trial, a Type I error is made when: 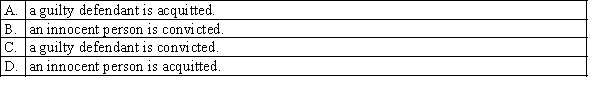
Question
Question
A spouse stated that the average amount of money spent on Christmas gifts for immediate family members is above $1200. The correct set of hypotheses is: 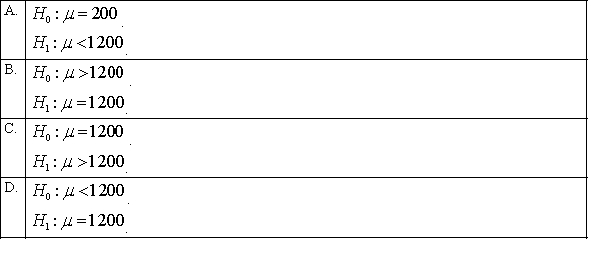
Question
Question
The probability of a Type I error is denoted by: 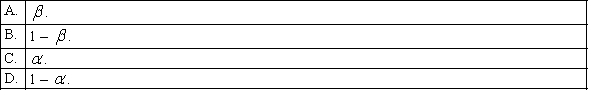
Question
Question
Question
In a one-tail test, the p-value is found to be equal to 0.032. If the test had been two-tailed, the p-value would have been: 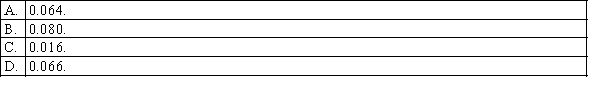
Question
Question
Question
Question
The power of a test is denoted by: 
Question
Question
Question
Question
Question
Question
Question
Question
Question
Question
Which of the following test statistics may be used to test a value of the population proportion? 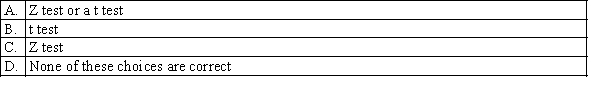
Question
Question
Question
Question
Question
Question
Which of the following statements best describes the level of significance? 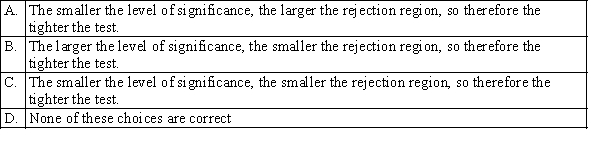
Question
The rejection region for testing the hypotheses  100.
100.  100. at the 0.05 level of significance is:
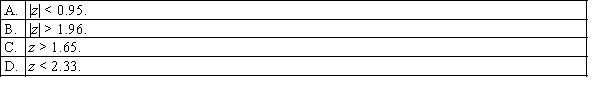
100. 100. at the 0.05 level of significance is: Question
The p-value criterion for hypothesis testing is to retain the null hypothesis if: 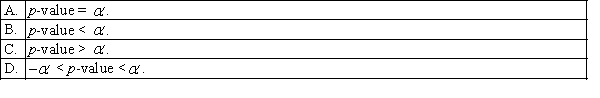
Question
When testing whether the majority of voters in an electorate will vote for a particular candidate, which of the following sets of hypotheses are correct? 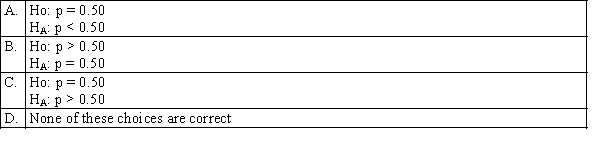
Question
Question
The rejection region for testing the hypotheses  80.
80.  < 80. at the 0.10 level of significance is:
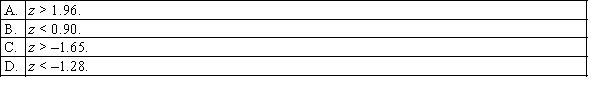
80. < 80. at the 0.10 level of significance is: Question
Question
Question
Question
Question
Question
Question
Question
Question
Question
Question
Question
Question
Question
Question
Question
Question
Question
Question
Question

Unlock Deck
Sign up to unlock the cards in this deck!
Unlock Deck
Unlock Deck
1/130
Play
Full screen (f)
Deck 13: Hypothesis Testing: Describing a Single Population
1
Which of the following p-values will lead us to reject the null hypothesis if the level of significance equals 0.10?
D
2
Suppose that we reject a null hypothesis at the 0.05 level of significance. For which of the following -values do we also reject the null hypothesis?
-values do we also reject the null hypothesis? A
3
In testing the hypotheses: 500 500, if the value of the Z test statistic equals 2.03, then the p-value is:
500 500, if the value of the Z test statistic equals 2.03, then the p-value is: A
4
A Type II error is committed if we make:
Unlock Deck
Unlock for access to all 130 flashcards in this deck.
Unlock Deck
k this deck
5
In a two-tail test for the population mean, the null hypothesis will be rejected at the level of significance if the value of the standardised test statistic z is such that:
level of significance if the value of the standardised test statistic z is such that: Unlock Deck
Unlock for access to all 130 flashcards in this deck.
Unlock Deck
k this deck
6
For a two-tail Z test, the null hypothesis will be rejected at the 0.05 level of significance if the value of the standardised test statistic is:
Unlock Deck
Unlock for access to all 130 flashcards in this deck.
Unlock Deck
k this deck
7
In a one-tail test for the population mean, if the null hypothesis is not rejected when the alternative hypothesis is true:
Unlock Deck
Unlock for access to all 130 flashcards in this deck.
Unlock Deck
k this deck
8
In order to determine the p-value, which of the following items of information is not needed?
Unlock Deck
Unlock for access to all 130 flashcards in this deck.
Unlock Deck
k this deck
9
If the research question is not an equality statement, then in hypothesis testing it is specified as:
Unlock Deck
Unlock for access to all 130 flashcards in this deck.
Unlock Deck
k this deck
10
If a hypothesis is not rejected at the 0.10 level of significance, it:
Unlock Deck
Unlock for access to all 130 flashcards in this deck.
Unlock Deck
k this deck
11
In testing the hypotheses 75. < 75. if the value of the Z test statistic equals 1.78, then the p-value is:
75. < 75. if the value of the Z test statistic equals 1.78, then the p-value is: Unlock Deck
Unlock for access to all 130 flashcards in this deck.
Unlock Deck
k this deck
12
The critical values z or z are the boundary values for the:
Unlock Deck
Unlock for access to all 130 flashcards in this deck.
Unlock Deck
k this deck
13
In testing the hypotheses: 35 H1 : < 35,
The following information is known: n = 49, = 37 and = 16. The standardised test statistic equals:
The following information is known: n = 49, = 37 and = 16. The standardised test statistic equals:
Unlock Deck
Unlock for access to all 130 flashcards in this deck.
Unlock Deck
k this deck
14
In a two-tail test for the population mean, if the null hypothesis is rejected when the alternative hypothesis is false:
Unlock Deck
Unlock for access to all 130 flashcards in this deck.
Unlock Deck
k this deck
15
Suppose you intend to test the claim that a typical high school student in Sydney spends more than $50 a week on mobile phone calls. Which hypotheses are used to test the claim?
Unlock Deck
Unlock for access to all 130 flashcards in this deck.
Unlock Deck
k this deck
16
If a hypothesis is rejected at the 0.025 level of significance, it:
Unlock Deck
Unlock for access to all 130 flashcards in this deck.
Unlock Deck
k this deck
17
The power of a test is the probability of making: A. a correct decision when the null hypothesis is false.
B. a correct decision when the null hypothesis is true.
C. an incorrect decision when the null hypothesis is false.
D. an incorrect decision when the null hypothesis is true.
B. a correct decision when the null hypothesis is true.
C. an incorrect decision when the null hypothesis is false.
D. an incorrect decision when the null hypothesis is true.
Unlock Deck
Unlock for access to all 130 flashcards in this deck.
Unlock Deck
k this deck
18
Using the confidence interval when conducting a two-tail test for the population mean we do not reject the null hypothesis if the hypothesised value for :
we do not reject the null hypothesis if the hypothesised value for : Unlock Deck
Unlock for access to all 130 flashcards in this deck.
Unlock Deck
k this deck
19
In testing the hypotheses H0 : = 75.
H1 : < 75.
The p-value is found to be 0.042, and the sample mean is 80. Which of the following statements is true?
H1 : < 75.
The p-value is found to be 0.042, and the sample mean is 80. Which of the following statements is true?
Unlock Deck
Unlock for access to all 130 flashcards in this deck.
Unlock Deck
k this deck
20
A Type I error is committed if we make:
Unlock Deck
Unlock for access to all 130 flashcards in this deck.
Unlock Deck
k this deck
21
For a given level of significance, if the sample size decreases, the probability of a Type II error will:
Unlock Deck
Unlock for access to all 130 flashcards in this deck.
Unlock Deck
k this deck
22
In a criminal trial, a Type II error is made when:
Unlock Deck
Unlock for access to all 130 flashcards in this deck.
Unlock Deck
k this deck
23
A Type II error is defined as:
Unlock Deck
Unlock for access to all 130 flashcards in this deck.
Unlock Deck
k this deck
24
In a given hypothesis test, the null hypothesis can be rejected at the 0.10 level of significance, but cannot be rejected at the 0.05 and 0.01 levels. The most accurate statement about the p-value for this test is:
Unlock Deck
Unlock for access to all 130 flashcards in this deck.
Unlock Deck
k this deck
25
Whenever the null hypothesis is not rejected:
Unlock Deck
Unlock for access to all 130 flashcards in this deck.
Unlock Deck
k this deck
26
A Type I error occurs when we:
Unlock Deck
Unlock for access to all 130 flashcards in this deck.
Unlock Deck
k this deck
27
The probability of a Type II error is denoted by:
Unlock Deck
Unlock for access to all 130 flashcards in this deck.
Unlock Deck
k this deck
28
In a criminal trial, a Type I error is made when:
Unlock Deck
Unlock for access to all 130 flashcards in this deck.
Unlock Deck
k this deck
29
If we reject the null hypothesis, we conclude that:
Unlock Deck
Unlock for access to all 130 flashcards in this deck.
Unlock Deck
k this deck
30
A spouse stated that the average amount of money spent on Christmas gifts for immediate family members is above $1200. The correct set of hypotheses is:
Unlock Deck
Unlock for access to all 130 flashcards in this deck.
Unlock Deck
k this deck
31
Statisticians can translate p-values into several descriptive terms. Which of the following statements is correct?
Unlock Deck
Unlock for access to all 130 flashcards in this deck.
Unlock Deck
k this deck
32
The probability of a Type I error is denoted by:
Unlock Deck
Unlock for access to all 130 flashcards in this deck.
Unlock Deck
k this deck
33
Which of the following statements is (are) not true?
Unlock Deck
Unlock for access to all 130 flashcards in this deck.
Unlock Deck
k this deck
34
The power of a test is the probability that it will lead us to:
Unlock Deck
Unlock for access to all 130 flashcards in this deck.
Unlock Deck
k this deck
35
In a one-tail test, the p-value is found to be equal to 0.032. If the test had been two-tailed, the p-value would have been:
Unlock Deck
Unlock for access to all 130 flashcards in this deck.
Unlock Deck
k this deck
36
If the value of the sample mean is close enough to the hypothesised value of the population mean , then:
Unlock Deck
Unlock for access to all 130 flashcards in this deck.
Unlock Deck
k this deck
37
If we do not reject the null hypothesis, we conclude that:
Unlock Deck
Unlock for access to all 130 flashcards in this deck.
Unlock Deck
k this deck
38
We cannot commit a Type I error when the:
Unlock Deck
Unlock for access to all 130 flashcards in this deck.
Unlock Deck
k this deck
39
The power of a test is denoted by:
Unlock Deck
Unlock for access to all 130 flashcards in this deck.
Unlock Deck
k this deck
40
The confidence interval approach can be employed to conduct tests of hypotheses. Which of the following statements is false?
Unlock Deck
Unlock for access to all 130 flashcards in this deck.
Unlock Deck
k this deck
41
The power of a test is the probability that a true null hypothesis will be rejected.
Unlock Deck
Unlock for access to all 130 flashcards in this deck.
Unlock Deck
k this deck
42
A Type I error is represented by , and is the probability of incorrectly rejecting a true null hypothesis.
Unlock Deck
Unlock for access to all 130 flashcards in this deck.
Unlock Deck
k this deck
43
A two-tail test is a test in which a null hypothesis can be rejected by an extreme result occurring in either direction.
Unlock Deck
Unlock for access to all 130 flashcards in this deck.
Unlock Deck
k this deck
44
A one-tail p-value is two times the size of that for a two-tail test.
Unlock Deck
Unlock for access to all 130 flashcards in this deck.
Unlock Deck
k this deck
45
An alternative or research hypothesis is an assertion that holds if the null hypothesis is false.
Unlock Deck
Unlock for access to all 130 flashcards in this deck.
Unlock Deck
k this deck
46
A Type I error is represented by , and is the probability of not rejecting a false null hypothesis.
Unlock Deck
Unlock for access to all 130 flashcards in this deck.
Unlock Deck
k this deck
47
In any given test, it is possible to commit the Type I and Type II errors at the same time.
Unlock Deck
Unlock for access to all 130 flashcards in this deck.
Unlock Deck
k this deck
48
Reducing the probability of a Type I error, increases the probability of a Type II error.
Unlock Deck
Unlock for access to all 130 flashcards in this deck.
Unlock Deck
k this deck
49
Which of the following test statistics may be used to test a value of the population proportion?
Unlock Deck
Unlock for access to all 130 flashcards in this deck.
Unlock Deck
k this deck
50
The power of a test refers to the probability of rejecting a false null hypothesis.
Unlock Deck
Unlock for access to all 130 flashcards in this deck.
Unlock Deck
k this deck
51
The p-value of a test is the probability of observing a test statistic at least as extreme as the one computed, given that the null hypothesis is true.
Unlock Deck
Unlock for access to all 130 flashcards in this deck.
Unlock Deck
k this deck
52
Which of the following best describes the p-value of a test?
Unlock Deck
Unlock for access to all 130 flashcards in this deck.
Unlock Deck
k this deck
53
The p-value is usually 0.05.
Unlock Deck
Unlock for access to all 130 flashcards in this deck.
Unlock Deck
k this deck
54
The critical values will bound the rejection and non-rejection regions for the null hypothesis.
Unlock Deck
Unlock for access to all 130 flashcards in this deck.
Unlock Deck
k this deck
55
Which of the following statements best describes the level of significance?
Unlock Deck
Unlock for access to all 130 flashcards in this deck.
Unlock Deck
k this deck
56
The rejection region for testing the hypotheses 100. 100. at the 0.05 level of significance is:
100. 100. at the 0.05 level of significance is: Unlock Deck
Unlock for access to all 130 flashcards in this deck.
Unlock Deck
k this deck
57
The p-value criterion for hypothesis testing is to retain the null hypothesis if:
Unlock Deck
Unlock for access to all 130 flashcards in this deck.
Unlock Deck
k this deck
58
When testing whether the majority of voters in an electorate will vote for a particular candidate, which of the following sets of hypotheses are correct?
Unlock Deck
Unlock for access to all 130 flashcards in this deck.
Unlock Deck
k this deck
59
A null hypothesis is a statement about the value of a population parameter; it is put up for testing in the face of numerical evidence.
Unlock Deck
Unlock for access to all 130 flashcards in this deck.
Unlock Deck
k this deck
60
The rejection region for testing the hypotheses 80. < 80. at the 0.10 level of significance is:
80. < 80. at the 0.10 level of significance is: Unlock Deck
Unlock for access to all 130 flashcards in this deck.
Unlock Deck
k this deck
61
In any test, the probability of a Type I error and the probability of a Type II error add up to 1.
Unlock Deck
Unlock for access to all 130 flashcards in this deck.
Unlock Deck
k this deck
62
The p-value of a test is the smallest value of at which the null hypothesis can be rejected.
Unlock Deck
Unlock for access to all 130 flashcards in this deck.
Unlock Deck
k this deck
63
There is a direct relationship between the power of a test and the probability of a Type II error.
Unlock Deck
Unlock for access to all 130 flashcards in this deck.
Unlock Deck
k this deck
64
Using the confidence interval when conducting a two-tail test for the population mean , we do not reject the null hypothesis if the hypothesised value for is smaller than the upper confidence limit.
Unlock Deck
Unlock for access to all 130 flashcards in this deck.
Unlock Deck
k this deck
65
A professor of statistics refutes the claim that the average student spends 6 hours studying for the final. To test the claim, the hypotheses H0: = 6, H1: < 6 should be used.
Unlock Deck
Unlock for access to all 130 flashcards in this deck.
Unlock Deck
k this deck
66
A Type I error is represented by , and is the probability of rejecting a true null hypothesis.
Unlock Deck
Unlock for access to all 130 flashcards in this deck.
Unlock Deck
k this deck
67
In a criminal trial, a Type II error is made when an innocent person is acquitted.
Unlock Deck
Unlock for access to all 130 flashcards in this deck.
Unlock Deck
k this deck
68
In a criminal trial, a Type I error is made when an innocent person is convicted.
Unlock Deck
Unlock for access to all 130 flashcards in this deck.
Unlock Deck
k this deck
69
A Type II error is represented by and is the probability of failing to reject a false null hypothesis.
Unlock Deck
Unlock for access to all 130 flashcards in this deck.
Unlock Deck
k this deck
70
If we do not reject the null hypothesis, we conclude that there is enough statistical evidence to infer that the null hypothesis is true.
Unlock Deck
Unlock for access to all 130 flashcards in this deck.
Unlock Deck
k this deck
71
In order to determine the p-value, it is not necessary to know the level of significance.
Unlock Deck
Unlock for access to all 130 flashcards in this deck.
Unlock Deck
k this deck
72
A test for the population mean produces a test-statistic z = -0.75. The p-value associated with the test is 0.2266 if the test is a left-tail test, it is 0.7734 if the test is a right-tail test, and it is 0.4533 if the test is a two-tail test.
Unlock Deck
Unlock for access to all 130 flashcards in this deck.
Unlock Deck
k this deck
73
If a null hypothesis is rejected at the 0.05 level of significance, it cannot be rejected at the 0.10 level.
Unlock Deck
Unlock for access to all 130 flashcards in this deck.
Unlock Deck
k this deck
74
In a one-tail test for the population mean, if the null hypothesis is not rejected when the alternative hypothesis is true, a Type I error is committed.
Unlock Deck
Unlock for access to all 130 flashcards in this deck.
Unlock Deck
k this deck
75
The probability of making a Type I error and the level of significance are the same.
Unlock Deck
Unlock for access to all 130 flashcards in this deck.
Unlock Deck
k this deck
76
There is an inverse relationship between the probabilities of Type I and Type II errors.
Unlock Deck
Unlock for access to all 130 flashcards in this deck.
Unlock Deck
k this deck
77
If we reject the null hypothesis, we conclude that there is enough statistical evidence to infer that the alternative hypothesis is true.
Unlock Deck
Unlock for access to all 130 flashcards in this deck.
Unlock Deck
k this deck
78
In a one-tail test, the p-value is found to be equal to 0.018. If the test had been two-tailed, the p-value would have been 0.036.
Unlock Deck
Unlock for access to all 130 flashcards in this deck.
Unlock Deck
k this deck
79
If we reject a null hypothesis at the 0.05 level of significance, then we must also reject it at the 0.10 level.
Unlock Deck
Unlock for access to all 130 flashcards in this deck.
Unlock Deck
k this deck
80
In a two-tail test for the population mean, if the null hypothesis is rejected when the alternative hypothesis is true, a Type I error is committed.
Unlock Deck
Unlock for access to all 130 flashcards in this deck.
Unlock Deck
k this deck
Unlock Deck
Unlock for access to all 130 flashcards in this deck.


