Deck 15: Inference About Population Variances
Full screen (f)
Question
Which of the following best describes the sampling distribution of s12/s22 , if we have independently sampled from two normal populations? 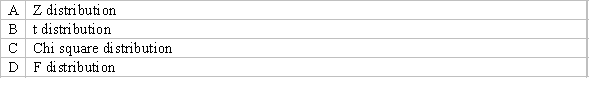
Question
In constructing a 95% interval estimate for the ratio of two population variances,  /
/  , two independent samples of sizes 41 and 61 are drawn from the populations. If the sample variances are 515 and 920, then the upper confidence limit is:
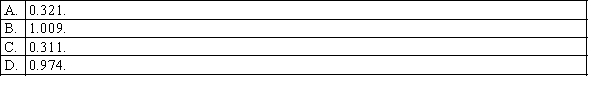
/ , two independent samples of sizes 41 and 61 are drawn from the populations. If the sample variances are 515 and 920, then the upper confidence limit is: Question
Which of the following best describes the Chi-square distribution? 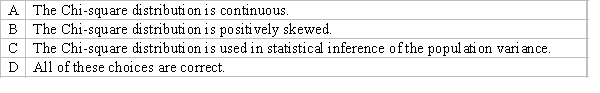
Question
The sampling distribution of the ratio of two sample variances  /
/  is said to be F-distributed provided that:
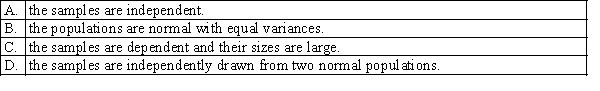
/ is said to be F-distributed provided that: Question
Which of the following statements is correct regarding the percentile points of the chi-squared distribution? 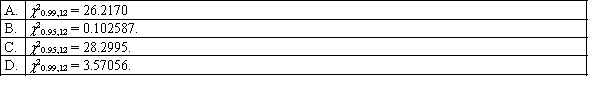
Question
In testing for the equality of two population variances, when the populations are normally distributed, the 10% level of significance has been used. To determine the rejection region, it will be necessary to refer to the F table corresponding to an upper-tail area of: 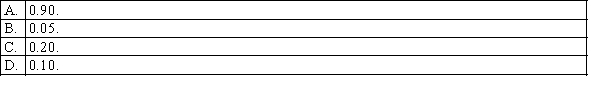
Question
Question
Two independent samples are drawn from two normal populations, where the population variances are assumed to be equal. The sampling distribution of the ratio of the two sample variances is: 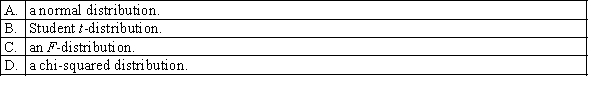
Question
Which of the following statements is correct regarding the percentile points of the F-distribution? 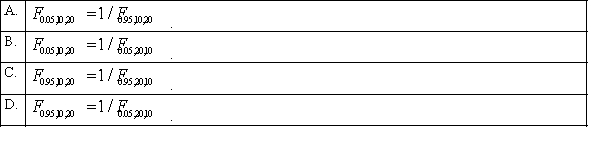
Question
The ratio of two independent chi-squared variables, each divided by its number of degrees of freedom, is: 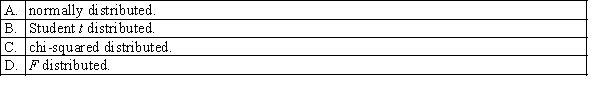
Question
Question
Which of the following statements is not correct for an F-distribution? 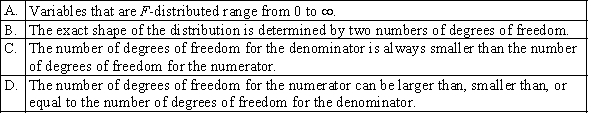
Question
Which of the following is the most common null hypothesis used when testing for equality of two population variances? 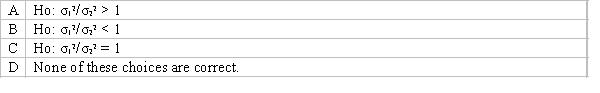
Question
A study wants to investigate whether the population variance is greater than 8, if a random sample of size 40, yielded a variance of 10. Which of the following are the correct null hypothesis and alternative hypotheses? 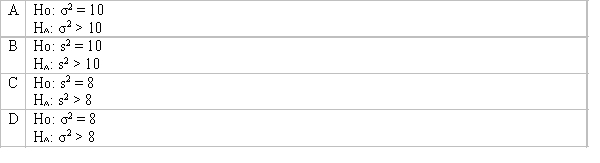
Question
Random samples from two normal populations produced the following statistics: s1 = 3 n1=30
S2 = 4 n2=30
What is the value of the test statistic if we wanted to test the hypothesis that the two populations differ?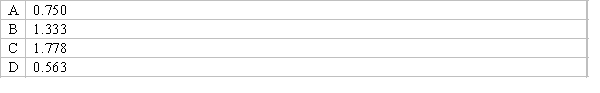
S2 = 4 n2=30
What is the value of the test statistic if we wanted to test the hypothesis that the two populations differ?
Question
Which of the following is the test statistic for σ2? 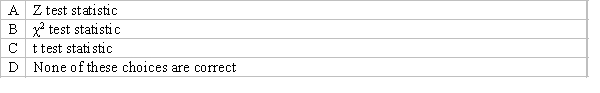
Question
A study wants to investigate whether the population variance is greater than 8, if a random sample of size 40, yielded a variance of 10. Which of the following is the correct value of the test statistic? 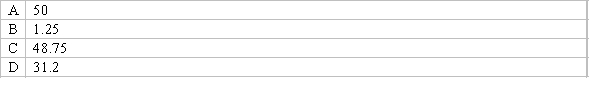
Question
How many degrees of freedom are used for an F statistic? 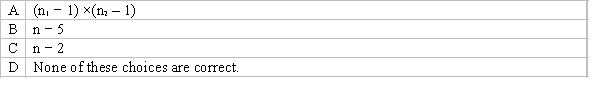
Question
The F-distribution is the sampling distribution of the ratio of: 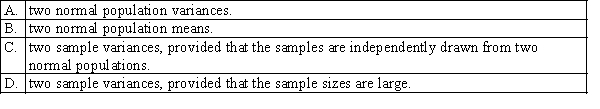
Question
Which of the following best describes the number of degrees of freedom used in a Chi-square test for a value of the population variance? 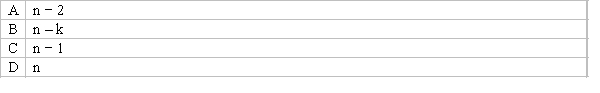
Question
Random samples from two normal populations produced the following statistics:  10,
10,  40.
40.  15,
15,  20.
20.
Is there enough evidence at the 5% significance level to infer that the variance of population 1 is larger than the variance of population 2?
10, 40. 15, 20.Is there enough evidence at the 5% significance level to infer that the variance of population 1 is larger than the variance of population 2?
Question
Question
Question
Question
Question
Question
A statistician wants to test for the equality of means in two independent samples drawn from normal populations. However, he will not perform the equal-variance t-test of the difference between the population means if the condition necessary for its use is not satisfied. The data are as follows:  Estimate with 95% confidence the ratio of the two population variances.
Estimate with 95% confidence the ratio of the two population variances. Question
Question
Question
Question
Question
Question
Random samples from two normal populations produced the following statistics:  25,
25,  75.
75.  13,
13,  130.
130.
Briefly explain how to use the 95% confidence the ratio of the two population variances to test the hypothesis of equal population variances.
LCL = (
 ) / F0.025,24,12 = 0.191.
UCL = (
 )F0.025,12,24 = 1.465.
25, 75. 13, 130.Briefly explain how to use the 95% confidence the ratio of the two population variances to test the hypothesis of equal population variances.
LCL = (
) / F0.025,24,12 = 0.191.UCL = (
)F0.025,12,24 = 1.465. Question
Random samples from two normal populations produced the following statistics:  25,
25,  75.
75.  13,
13,  130.
130.
Estimate with 95% confidence the ratio of the two population variances.
25, 75. 13, 130.Estimate with 95% confidence the ratio of the two population variances.
Question
Random samples from two normal populations produced the following statistics:  25,
25,  75.
75.  13,
13,  130.
130.
Briefly describe the 95% confidence the ratio of the two population variances:
LCL = (
 ) / F0.025,24,12 = 0.191.
UCL = (
 )F0.025,12,24 = 1.465.
25, 75. 13, 130.Briefly describe the 95% confidence the ratio of the two population variances:
LCL = (
) / F0.025,24,12 = 0.191.UCL = (
)F0.025,12,24 = 1.465. Question
A statistician wants to test for the equality of means in two independent samples drawn from normal populations. However, he will not perform the equal-variance t-test of the difference between the population means if the condition necessary for its use is not satisfied. The data are as follows:  Briefly describe what the interval estimate in the previous question tells you.
Briefly describe what the interval estimate in the previous question tells you. Question
Question
Question
Question
A statistician wants to test for the equality of means in two independent samples drawn from normal populations. However, he will not perform the equal-variance t-test of the difference between the population means if the condition necessary for its use is not satisfied. The data are as follows:  Given the data above, can the statistician conclude at the 5% significance level that the required condition is not satisfied?
Given the data above, can the statistician conclude at the 5% significance level that the required condition is not satisfied? Question
Question
Question
What are the rejection regions for each of the following sets of hypotheses? 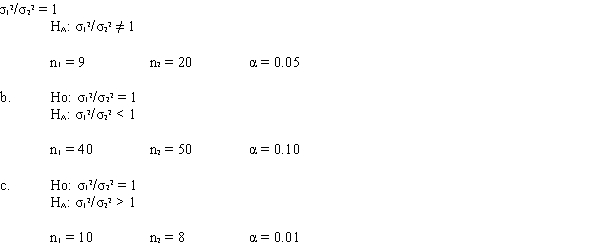
Question
Question
Question
Question

Unlock Deck
Sign up to unlock the cards in this deck!
Unlock Deck
Unlock Deck
1/47
Play
Full screen (f)
Deck 15: Inference About Population Variances
1
Which of the following best describes the sampling distribution of s12/s22 , if we have independently sampled from two normal populations?
D
2
In constructing a 95% interval estimate for the ratio of two population variances, / , two independent samples of sizes 41 and 61 are drawn from the populations. If the sample variances are 515 and 920, then the upper confidence limit is:
/ , two independent samples of sizes 41 and 61 are drawn from the populations. If the sample variances are 515 and 920, then the upper confidence limit is: B
3
Which of the following best describes the Chi-square distribution?
D
4
The sampling distribution of the ratio of two sample variances / is said to be F-distributed provided that:
/ is said to be F-distributed provided that: Unlock Deck
Unlock for access to all 47 flashcards in this deck.
Unlock Deck
k this deck
5
Which of the following statements is correct regarding the percentile points of the chi-squared distribution?
Unlock Deck
Unlock for access to all 47 flashcards in this deck.
Unlock Deck
k this deck
6
In testing for the equality of two population variances, when the populations are normally distributed, the 10% level of significance has been used. To determine the rejection region, it will be necessary to refer to the F table corresponding to an upper-tail area of:
Unlock Deck
Unlock for access to all 47 flashcards in this deck.
Unlock Deck
k this deck
7
Which of the following statements is false?
Unlock Deck
Unlock for access to all 47 flashcards in this deck.
Unlock Deck
k this deck
8
Two independent samples are drawn from two normal populations, where the population variances are assumed to be equal. The sampling distribution of the ratio of the two sample variances is:
Unlock Deck
Unlock for access to all 47 flashcards in this deck.
Unlock Deck
k this deck
9
Which of the following statements is correct regarding the percentile points of the F-distribution?
Unlock Deck
Unlock for access to all 47 flashcards in this deck.
Unlock Deck
k this deck
10
The ratio of two independent chi-squared variables, each divided by its number of degrees of freedom, is:
Unlock Deck
Unlock for access to all 47 flashcards in this deck.
Unlock Deck
k this deck
11
The value in an F-distribution with and degrees of freedom such that the area to its left is 0.95 is 4.74.
Unlock Deck
Unlock for access to all 47 flashcards in this deck.
Unlock Deck
k this deck
12
Which of the following statements is not correct for an F-distribution?
Unlock Deck
Unlock for access to all 47 flashcards in this deck.
Unlock Deck
k this deck
13
Which of the following is the most common null hypothesis used when testing for equality of two population variances?
Unlock Deck
Unlock for access to all 47 flashcards in this deck.
Unlock Deck
k this deck
14
A study wants to investigate whether the population variance is greater than 8, if a random sample of size 40, yielded a variance of 10. Which of the following are the correct null hypothesis and alternative hypotheses?
Unlock Deck
Unlock for access to all 47 flashcards in this deck.
Unlock Deck
k this deck
15
Random samples from two normal populations produced the following statistics: s1 = 3 n1=30
S2 = 4 n2=30
What is the value of the test statistic if we wanted to test the hypothesis that the two populations differ?
S2 = 4 n2=30
What is the value of the test statistic if we wanted to test the hypothesis that the two populations differ?
Unlock Deck
Unlock for access to all 47 flashcards in this deck.
Unlock Deck
k this deck
16
Which of the following is the test statistic for σ2?
Unlock Deck
Unlock for access to all 47 flashcards in this deck.
Unlock Deck
k this deck
17
A study wants to investigate whether the population variance is greater than 8, if a random sample of size 40, yielded a variance of 10. Which of the following is the correct value of the test statistic?
Unlock Deck
Unlock for access to all 47 flashcards in this deck.
Unlock Deck
k this deck
18
How many degrees of freedom are used for an F statistic?
Unlock Deck
Unlock for access to all 47 flashcards in this deck.
Unlock Deck
k this deck
19
The F-distribution is the sampling distribution of the ratio of:
Unlock Deck
Unlock for access to all 47 flashcards in this deck.
Unlock Deck
k this deck
20
Which of the following best describes the number of degrees of freedom used in a Chi-square test for a value of the population variance?
Unlock Deck
Unlock for access to all 47 flashcards in this deck.
Unlock Deck
k this deck
21
Random samples from two normal populations produced the following statistics: 10, 40. 15, 20.
Is there enough evidence at the 5% significance level to infer that the variance of population 1 is larger than the variance of population 2?
10, 40. 15, 20.Is there enough evidence at the 5% significance level to infer that the variance of population 1 is larger than the variance of population 2?
Unlock Deck
Unlock for access to all 47 flashcards in this deck.
Unlock Deck
k this deck
22
The value in an F-distribution with and degrees of freedom such that the area to its left is 0.975 is 5.05.
Unlock Deck
Unlock for access to all 47 flashcards in this deck.
Unlock Deck
k this deck
23
The test statistic employed to test is , which is F-distributed with degrees of freedom, provided that the two populations are F-distributed.
Unlock Deck
Unlock for access to all 47 flashcards in this deck.
Unlock Deck
k this deck
24
The value in a chi-squared distribution with 8 degrees of freedom such that the area to its left is 0.95 is 15.5073.
Unlock Deck
Unlock for access to all 47 flashcards in this deck.
Unlock Deck
k this deck
25
The value in a chi-squared distribution with 5 degrees of freedom such that the area to its right is 0.10 is 1.61031.
Unlock Deck
Unlock for access to all 47 flashcards in this deck.
Unlock Deck
k this deck
26
When the necessary conditions are met, a two-tail test is being conducted at = 0.05 to test . The two sample variances are , and the sample sizes are . The calculated value of the test statistic will be F = 2.
Unlock Deck
Unlock for access to all 47 flashcards in this deck.
Unlock Deck
k this deck
27
A statistician wants to test for the equality of means in two independent samples drawn from normal populations. However, he will not perform the equal-variance t-test of the difference between the population means if the condition necessary for its use is not satisfied. The data are as follows: Estimate with 95% confidence the ratio of the two population variances.
Estimate with 95% confidence the ratio of the two population variances. Unlock Deck
Unlock for access to all 47 flashcards in this deck.
Unlock Deck
k this deck
28
When comparing two population variances, we use the difference rather than the ratio .
Unlock Deck
Unlock for access to all 47 flashcards in this deck.
Unlock Deck
k this deck
29
The value in a chi-squared distribution with 4 degrees of freedom such that the area to its right is 0.99 is 0.29711.
Unlock Deck
Unlock for access to all 47 flashcards in this deck.
Unlock Deck
k this deck
30
The value in an F-distribution with and degrees of freedom such that the area to its left is 0.99 is 0.036.
Unlock Deck
Unlock for access to all 47 flashcards in this deck.
Unlock Deck
k this deck
31
When the necessary conditions are met, a two-tail test is being conducted at = 0.05 to test . The two sample variances are , and the sample sizes are . The rejection region is F > 2.20 or F < 0.4255.
Unlock Deck
Unlock for access to all 47 flashcards in this deck.
Unlock Deck
k this deck
32
The value in an F-distribution with and degrees of freedom such that the area to its right is 0.05 is 3.37.
Unlock Deck
Unlock for access to all 47 flashcards in this deck.
Unlock Deck
k this deck
33
Random samples from two normal populations produced the following statistics: 25, 75. 13, 130.
Briefly explain how to use the 95% confidence the ratio of the two population variances to test the hypothesis of equal population variances.
LCL = ( ) / F0.025,24,12 = 0.191.
UCL = ( )F0.025,12,24 = 1.465.
25, 75. 13, 130.Briefly explain how to use the 95% confidence the ratio of the two population variances to test the hypothesis of equal population variances.
LCL = (
) / F0.025,24,12 = 0.191.UCL = (
)F0.025,12,24 = 1.465. Unlock Deck
Unlock for access to all 47 flashcards in this deck.
Unlock Deck
k this deck
34
Random samples from two normal populations produced the following statistics: 25, 75. 13, 130.
Estimate with 95% confidence the ratio of the two population variances.
25, 75. 13, 130.Estimate with 95% confidence the ratio of the two population variances.
Unlock Deck
Unlock for access to all 47 flashcards in this deck.
Unlock Deck
k this deck
35
Random samples from two normal populations produced the following statistics: 25, 75. 13, 130.
Briefly describe the 95% confidence the ratio of the two population variances:
LCL = ( ) / F0.025,24,12 = 0.191.
UCL = ( )F0.025,12,24 = 1.465.
25, 75. 13, 130.Briefly describe the 95% confidence the ratio of the two population variances:
LCL = (
) / F0.025,24,12 = 0.191.UCL = (
)F0.025,12,24 = 1.465. Unlock Deck
Unlock for access to all 47 flashcards in this deck.
Unlock Deck
k this deck
36
A statistician wants to test for the equality of means in two independent samples drawn from normal populations. However, he will not perform the equal-variance t-test of the difference between the population means if the condition necessary for its use is not satisfied. The data are as follows: Briefly describe what the interval estimate in the previous question tells you.
Briefly describe what the interval estimate in the previous question tells you. Unlock Deck
Unlock for access to all 47 flashcards in this deck.
Unlock Deck
k this deck
37
To find the value in a chi-squared distribution with 10 degrees of freedom such that the area to its left is 0.01, we find the point in the same distribution such that the area to its left is 0.99.
Unlock Deck
Unlock for access to all 47 flashcards in this deck.
Unlock Deck
k this deck
38
The value in a chi-squared distribution with 6 degrees of freedom such that the area to its left is 0.05 is 12.5916.
Unlock Deck
Unlock for access to all 47 flashcards in this deck.
Unlock Deck
k this deck
39
A university lecturer wants to investigate if the variance of final marks of students in two of her courses differs. She takes a random sample of 25 students from the mathematics course she lectures and finds the student's final marks had a variance of 5. She takes a random sample of 13 students from the statistics course she lectures and finds the variance of 10. Assuming that the final grades of students in her mathematics and in her statistics course are normally distributed, is there enough evidence at the 5% significance level for this lecturer to infer that the two population variances differ?
Unlock Deck
Unlock for access to all 47 flashcards in this deck.
Unlock Deck
k this deck
40
A statistician wants to test for the equality of means in two independent samples drawn from normal populations. However, he will not perform the equal-variance t-test of the difference between the population means if the condition necessary for its use is not satisfied. The data are as follows: Given the data above, can the statistician conclude at the 5% significance level that the required condition is not satisfied?
Given the data above, can the statistician conclude at the 5% significance level that the required condition is not satisfied? Unlock Deck
Unlock for access to all 47 flashcards in this deck.
Unlock Deck
k this deck
41
In a random sample of 20 patients who visited the emergency room of hospital 1, a researcher found that the variance of the waiting time (in minutes) was 128.0. In a random sample of 15 patients in the emergency room of hospital 2, the researcher found the variance to be 178.8.
Briefly describe what the interval estimate in the previous question tells you.
Briefly describe what the interval estimate in the previous question tells you.
Unlock Deck
Unlock for access to all 47 flashcards in this deck.
Unlock Deck
k this deck
42
An investor is considering two types of investment. She is quite satisfied that the expected return on investment 1 is higher than the expected return on investment 2. However, she is quite concerned that the risk associated with investment 1 is higher than that of investment 2. To help make her decision, she randomly selects seven monthly returns on investment 1 and 10 monthly returns on investment 2. She finds that the sample variances of investments 1 and 2 are 225 and 118, respectively.
Can she infer at the 5% significance level that the population variance of investment 1 exceeds that of investment 2?
Can she infer at the 5% significance level that the population variance of investment 1 exceeds that of investment 2?
Unlock Deck
Unlock for access to all 47 flashcards in this deck.
Unlock Deck
k this deck
43
What are the rejection regions for each of the following sets of hypotheses?
Unlock Deck
Unlock for access to all 47 flashcards in this deck.
Unlock Deck
k this deck
44
In a random sample of 20 patients who visited the emergency room of hospital 1, a researcher found that the variance of the waiting time (in minutes) was 128.0. In a random sample of 15 patients in the emergency room of hospital 2, the researcher found the variance to be 178.8.
Can we infer at the 5% level of significance that the population variances differ?
Can we infer at the 5% level of significance that the population variances differ?
Unlock Deck
Unlock for access to all 47 flashcards in this deck.
Unlock Deck
k this deck
45
In a random sample of 20 patients who visited the emergency room of hospital 1, a researcher found that the variance of the waiting time (in minutes) was 128.0. In a random sample of 15 patients in the emergency room of hospital 2, the researcher found the variance to be 178.8.
Estimate with 95% confidence the ratio of the two population variances.
Estimate with 95% confidence the ratio of the two population variances.
Unlock Deck
Unlock for access to all 47 flashcards in this deck.
Unlock Deck
k this deck
46
For each of the following hypothesis tests, state for what values of χ2 we would reject Ho.
a. Ho: σ12 = 10
HA: σ12 ≠ 10
α = 0.10 and n = 50
b. Ho: σ12 = 4
HA: σ12 > 4
α = 0.05 and n = 30
c. Ho: σ12 = 0.50
HA: σ12 < 0.50
α = 0.01 and n = 45
a. Ho: σ12 = 10
HA: σ12 ≠ 10
α = 0.10 and n = 50
b. Ho: σ12 = 4
HA: σ12 > 4
α = 0.05 and n = 30
c. Ho: σ12 = 0.50
HA: σ12 < 0.50
α = 0.01 and n = 45
Unlock Deck
Unlock for access to all 47 flashcards in this deck.
Unlock Deck
k this deck
47
An investor is considering two types of investment. She is quite satisfied that the expected return on investment 1 is higher than the expected return on investment 2. However, she is quite concerned that the risk associated with investment 1 is higher than that of investment 2. To help make her decision, she randomly selects seven monthly returns on investment 1 and ten monthly returns on investment 2. She finds that the sample variances of investments 1 and 2 are 225 and 118, respectively.
Estimate with 95% confidence the ratio of the two population variances, and briefly describe what the interval estimate tells you.
Estimate with 95% confidence the ratio of the two population variances, and briefly describe what the interval estimate tells you.
Unlock Deck
Unlock for access to all 47 flashcards in this deck.
Unlock Deck
k this deck
Unlock Deck
Unlock for access to all 47 flashcards in this deck.


