Deck 20: International Finance
Full screen (f)
Question
Question
Question
Question
Question
Question
Question
Question
Question
Question
Question
Question
Question
Question
Question
Question
Question
Question
Question
Question
Question
Question
The following two figures depict the demand and supply of U.S. dollars and the demand and supply of British pounds in the foreign currency exchange market. Use these figures to answer the next questions. 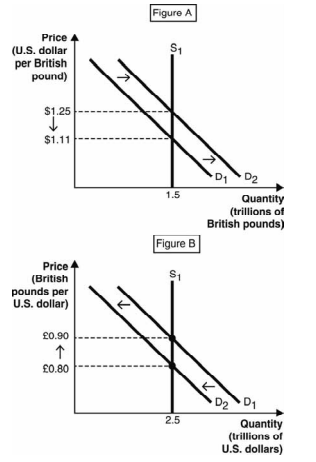
-An appreciation of the____- is shown in____ .
A) U.S. dollar; Figure A but not Figure B
B) U.S. dollar; Figure B but not Figure A
C) U.S. dollar; both Figures A and B
D) British pound; neither Figure A nor Figure B
E) British pound; both Figures A and B
-An appreciation of the____- is shown in____ .
A) U.S. dollar; Figure A but not Figure B
B) U.S. dollar; Figure B but not Figure A
C) U.S. dollar; both Figures A and B
D) British pound; neither Figure A nor Figure B
E) British pound; both Figures A and B
Question
Question
Question
Question
Question
Question
Question
Question
Question
Question
Question
Question
Question
Question
Question
Question
Question
Question
Question
Question
Question
Question
The following figure depicts the supply of U.S. dollars in the foreign currency exchange market. Use this figure to answer the next questions
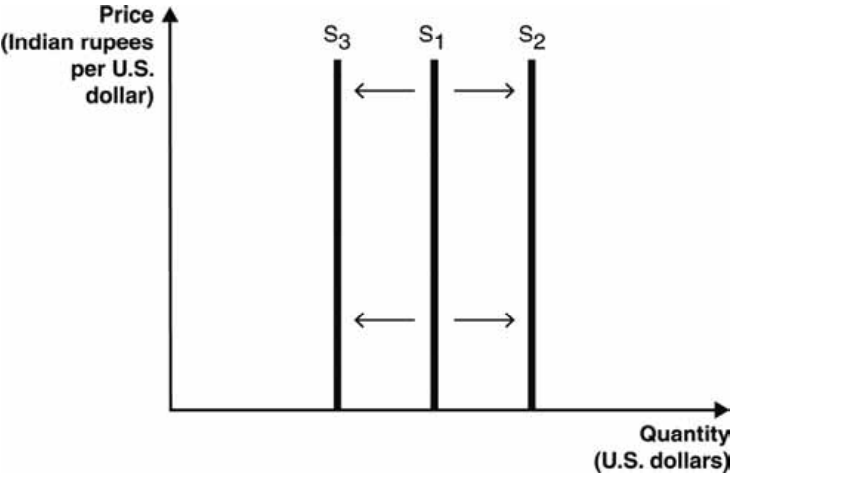
-If the U.S. central bank decreases the supply of U.S. dollars, the supply curve in the above figure will ____; if the Indian central bank increases the supply of rupees, the supply curve in the above figure will ____.
A) shift leftward; also shift leftward
B) shift rightward; not shift
C) not shift; shift rightward
D) shift rightward; shift leftward
E) shift leftward; not change
Question
The following figure depicts the supply of U.S. dollars in the foreign currency exchange market. Use this figure to answer the next questions
-The U.S. central bank has the power to increase or decrease the supply of U.S. dollars. If the U.S. central bank increases the supply of U.S. dollars, the supply curve in the above figure will____ ; if the U.S. central bank decreases the supply of U.S. dollars, the supply curve in the above figure will____ .
A) shift rightward; shift leftward
B) shift leftward; shift rightward
C) shift rightward; also shift rightward
D) shift leftward; also shift leftward
E) not shift; not shift
Question
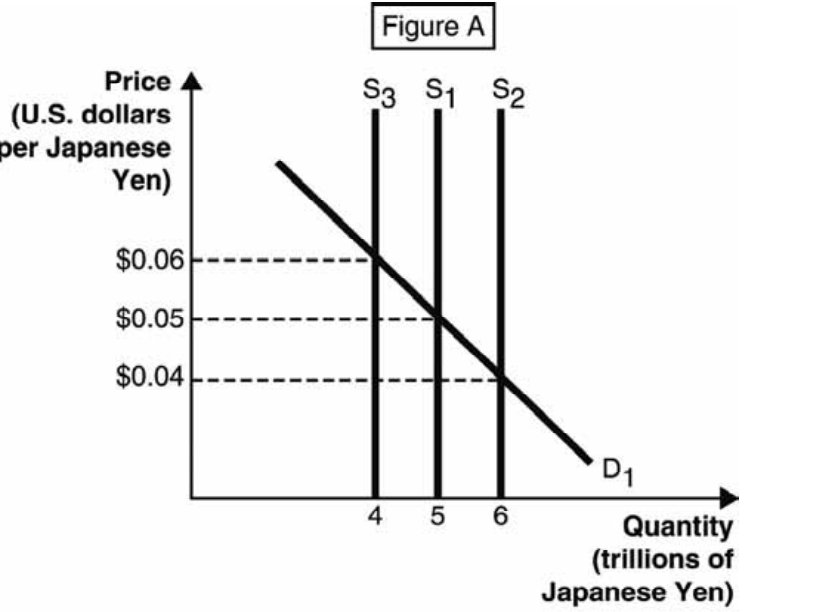
Figure A below depicts the demand and supply of Japanese yen in the foreign currency exchange market. Figure B below depicts the aggregate supply–aggregate demand model for the Japanese economy. Use these figures to answer the next questions.
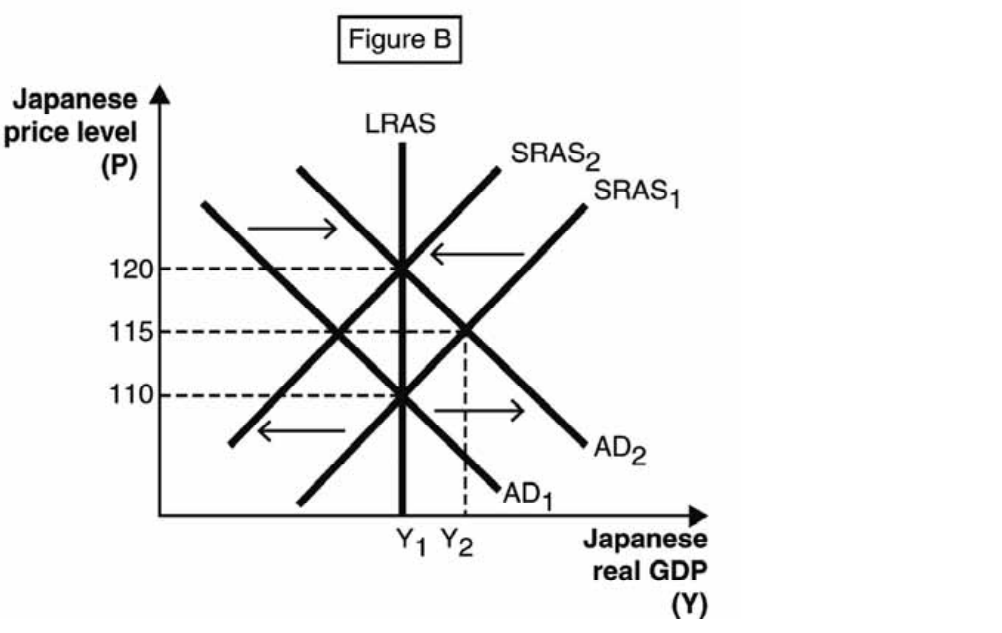
-Which of the following is the most accurate description of the phenomenon shown in Figure B?
A) The Japanese central bank increased the money supply S1 to S2, which caused the price level to fall from 115 to 110, which then caused the short-run aggregate supply to decrease from SRAS1 to SRAS2.
B) The Japanese central bank increased the money supply S1 to S2, which caused aggregate demand to increase from AD1 to AD2, which then caused the short-run aggregate supply to decrease from SRAS1 to SRAS2.
C) The Japanese central bank decreased the money supply S1 to S3, which caused aggregate demand to decrease from AD2 to AD1, which then caused the short-run aggregate supply to decrease from SRAS1 to SRAS2.
D) The Japanese central bank increased the money supply S1 to S2, which caused real gross domestic product GDP) to fall from Y2 to Y1, which caused the short-run aggregate supply to decrease from SRAS1 to SRAS2, which then caused aggregate demand to increase from AD1 to AD2.
E) Aggregate demand increased from AD1 to AD2, which forced the Japanese central bank to increase the money supply S1 to S2, which then caused the short-run aggregate supply to decrease from SRAS1 to SRAS2.
Question
Question
The arrows in Figures A–D represent possible movements of the exchange rate (euros per U.S. dollar) and the quantity of U.S. dollars buyers are willing and able to buy. Use these figures to answer the next questions 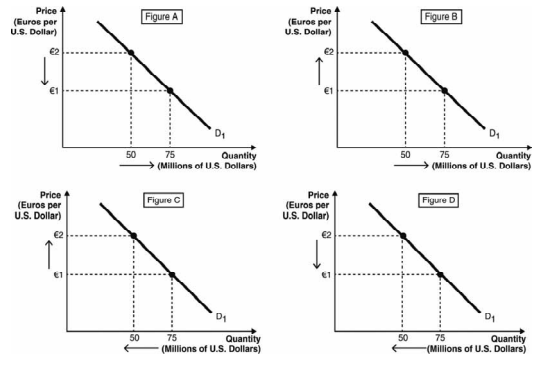
-An appreciation of the euro against the U.S. dollar is represented by Figure _____, and a depreciation of the U.S. dollar against the euro is represented by Figure _____.
A) A; C
B) A; A
C) B; D
D) D; B
E) A; D
-An appreciation of the euro against the U.S. dollar is represented by Figure _____, and a depreciation of the U.S. dollar against the euro is represented by Figure _____.
A) A; C
B) A; A
C) B; D
D) D; B
E) A; D
Question
The following two figures depict the demand and supply of U.S. dollars and the demand and supply of British pounds in the foreign currency exchange market. Use these figures to answer the next questions.
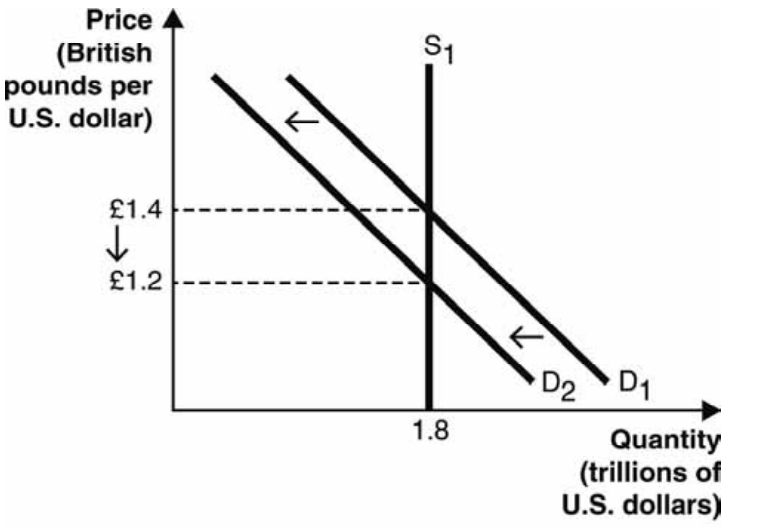
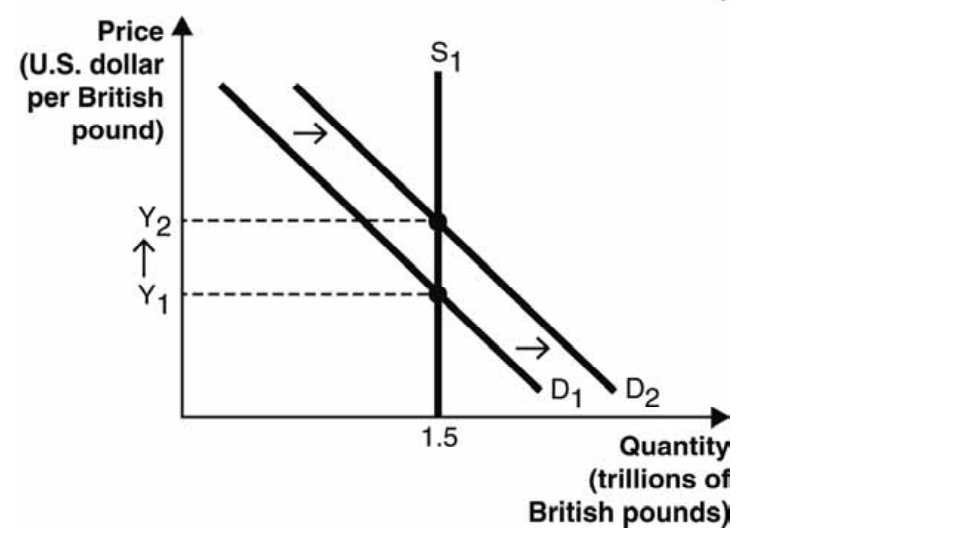
-Assume that the same event caused demand for U.S. dollars to decrease and demand for British pounds to increase and that both of these graphs describe that event. Approximately what is Y2 ?
A) $0.50
B) $0.71
C) $0.83
D) $1.20
E) $1.40
-Assume that the same event caused demand for U.S. dollars to decrease and demand for British pounds to increase and that both of these graphs describe that event. Approximately what is Y2 ?
A) $0.50
B) $0.71
C) $0.83
D) $1.20
E) $1.40
Question
Question
Question
Question
The figure below depicts the supply of U.S. dollars in the foreign currency exchange market. 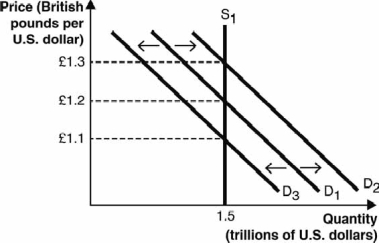 A shift from D1 to D3 in the above figure could have been caused by an)
A) decrease in the exchange rate from £1.2/$1 to £1.1/$1.
B) increase in the exchange rate from £1.1/$1 to £1.2/$1.
C) increase in demand for U.S. assets relative to British assets.
D) increase in U.S. interest rates relative to British interest rates.
E) decrease in British consumers' demand for U.S. goods.
A shift from D1 to D3 in the above figure could have been caused by an)A) decrease in the exchange rate from £1.2/$1 to £1.1/$1.
B) increase in the exchange rate from £1.1/$1 to £1.2/$1.
C) increase in demand for U.S. assets relative to British assets.
D) increase in U.S. interest rates relative to British interest rates.
E) decrease in British consumers' demand for U.S. goods.
Question
Figure A below depicts the demand and supply of Japanese yen in the foreign currency exchange market. Figure B below depicts the aggregate supply–aggregate demand model for the Japanese economy. Use these figures to answer the next questions.
-Assume the Japanese economy is illustrated at the intersection of AD1 and SRAS1. If the Bank of Japan the Japanese central bank) increased the supply of yen from five trillion to six trillion, the Japanese price level would ______in the short run and increase from 115 to 120 in the long run.
A) decrease from 120 to 110
B) not change
C) increase from 110 to 120
D) decrease from 120 to 115
E) increase from 110 to 115
Question
The following two figures depict the demand and supply of U.S. dollars and the demand and supply of British pounds in the foreign currency exchange market. Use these figures to answer the next questions.
-Assume that the same event caused demand for U.S. dollars to decrease and demand for British pounds to increase and that both of these graphs describe that event. Approximately what is Y1 ?
A) $0.50
B) $0.71
C) $0.83
D) $1.20
E) $1.40
-Assume that the same event caused demand for U.S. dollars to decrease and demand for British pounds to increase and that both of these graphs describe that event. Approximately what is Y1 ?
A) $0.50
B) $0.71
C) $0.83
D) $1.20
E) $1.40
Question
Question
The figure below depicts the three possible aggregate demand curves. 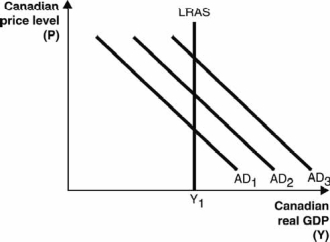
If the Bank of Canada (the Canadian central bank)_____ Canadian dollar(s), the Canadian dollar will depreciate and the aggregate demand curve will shift from AD2 to____ .
A) devalues the; AD1
B) prints more; AD1
C) decreases the supply of; AD3
D) increases the supply of; AD3
E) prints less; AD3
If the Bank of Canada (the Canadian central bank)_____ Canadian dollar(s), the Canadian dollar will depreciate and the aggregate demand curve will shift from AD2 to____ .
A) devalues the; AD1
B) prints more; AD1
C) decreases the supply of; AD3
D) increases the supply of; AD3
E) prints less; AD3
Question
Question
The arrows in Figures A–D represent possible movements of the exchange rate (euros per U.S. dollar) and the quantity of U.S. dollars buyers are willing and able to buy. Use these figures to answer the next questions
-A depreciation of the euro against the U.S. dollar is represented by Figure____ , and a depreciation of the U.S. dollar against the euro is represented by Figure ____.
A) A; C
B) C; A
C) B; D
D) D; B
E) A; D
-A depreciation of the euro against the U.S. dollar is represented by Figure____ , and a depreciation of the U.S. dollar against the euro is represented by Figure ____.
A) A; C
B) C; A
C) B; D
D) D; B
E) A; D
Question
Question
The following two graphs depict the equilibrium price of a pound of grapes in California and West virginia, respectively. Assume the type and quality of the grapes being sold in the two states are identical. Further, assume grape sellers incur zero costs to transport grapes between the two states and there are no other barriers to trade. Use these graphs to answer the next questions
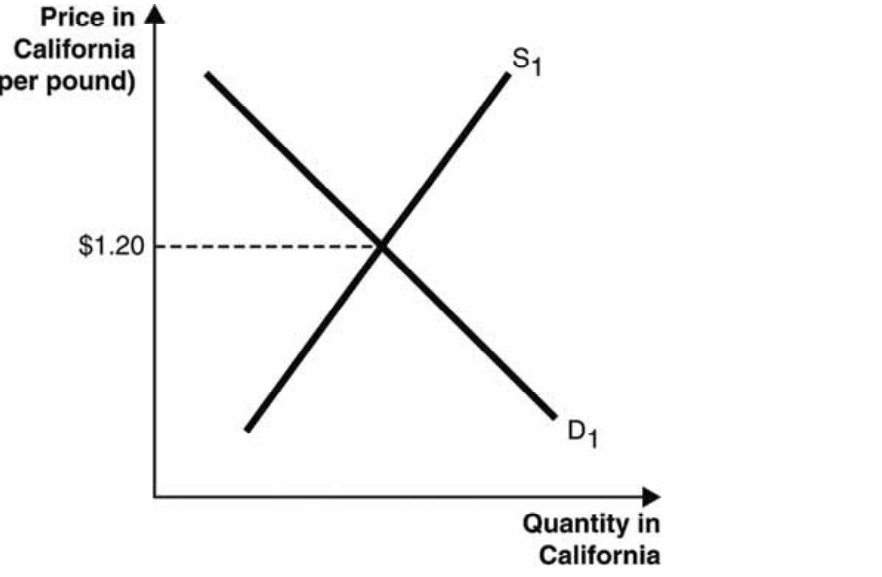
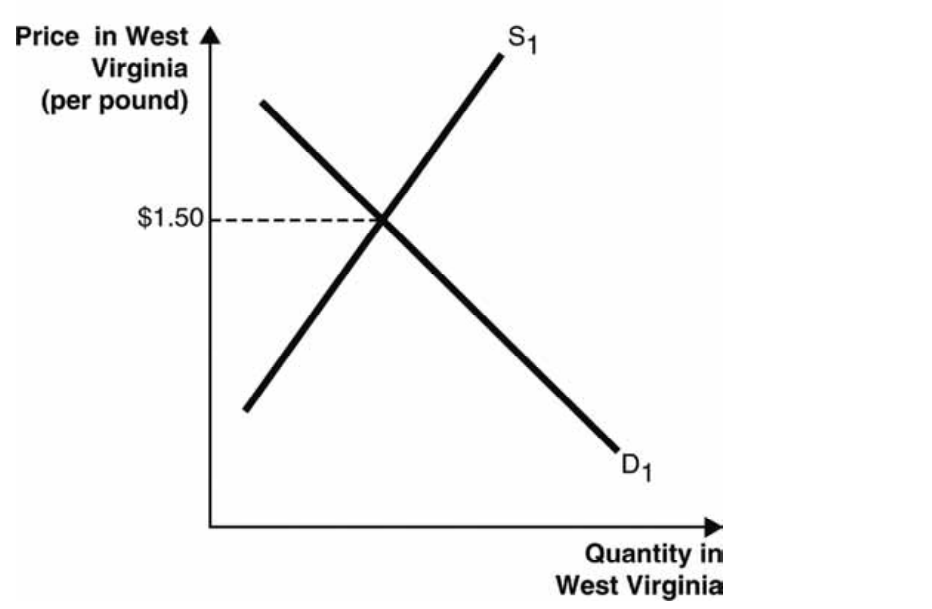
-According to the law of one price, the supply curve in the California grape market will shift to the______ , and the supply curve in the West Virginia grape market will_____ .
A) right; also shift to the right
B) left; shift to the right
C) right; shift to the left
D) left; also shift to the left
E) left; not shift
Question
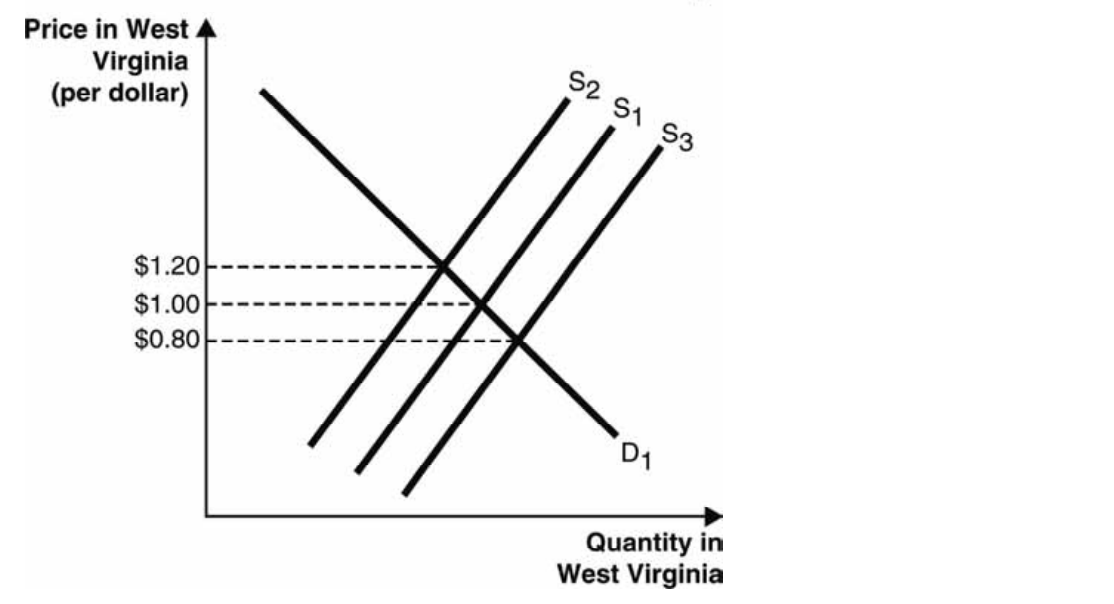
The following graph depicts the market for potatoes in West Virginia. Assume there are similar markets for potatoes in all other U.S. states and that the potatoes sold in all states are identical.
Further, assume potato sellers incur zero costs to transport potatoes between any U.S. states and that there are no other barriers to trade. Use this graph to answer the next question.
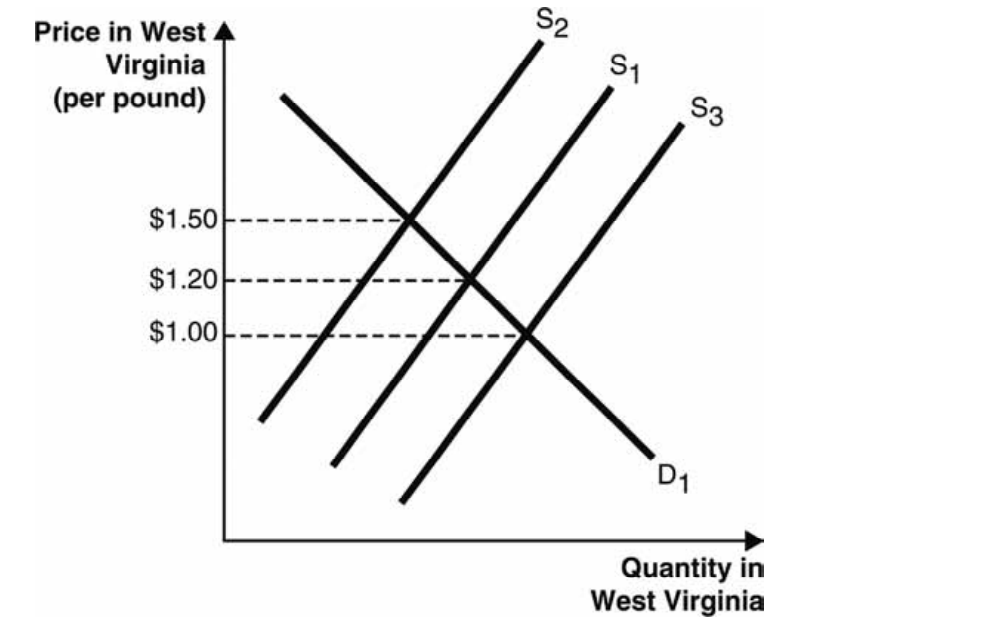
-Suppose the equilibrium price of a pound of potatoes in all U.S. states is initially $1.20. Which scenario could cause a shift in West Virginia from S1 to S2 as shown in the graph?
A) Potato farmers in other states produce unusually large crops of potatoes, causing the price in those states to fall to $1.00.
B) Potato farmers in other states produce unusually small crops of potatoes, causing the price in those states to rise to $1.50.
C) Demand for potatoes increases in West Virginia, causing the price there to rise to $1.50.
D) Demand for potatoes falls in other states, causing the price in those states to fall to $1.00.
E) Demand for potatoes falls in West Virginia, causing the price there to fall to $1.00.
Further, assume potato sellers incur zero costs to transport potatoes between any U.S. states and that there are no other barriers to trade. Use this graph to answer the next question.
-Suppose the equilibrium price of a pound of potatoes in all U.S. states is initially $1.20. Which scenario could cause a shift in West Virginia from S1 to S2 as shown in the graph?
A) Potato farmers in other states produce unusually large crops of potatoes, causing the price in those states to fall to $1.00.
B) Potato farmers in other states produce unusually small crops of potatoes, causing the price in those states to rise to $1.50.
C) Demand for potatoes increases in West Virginia, causing the price there to rise to $1.50.
D) Demand for potatoes falls in other states, causing the price in those states to fall to $1.00.
E) Demand for potatoes falls in West Virginia, causing the price there to fall to $1.00.
Question
Question
Question
Question
Question
The following two graphs depict the equilibrium price of a pound of grapes in California and West virginia, respectively. Assume the type and quality of the grapes being sold in the two states are identical. Further, assume grape sellers incur zero costs to transport grapes between the two states and there are no other barriers to trade. Use these graphs to answer the next questions
-According to the law of one price, the price of grapes will
A) increase in California and decrease in West Virginia.
B) increase in California and increase in West Virginia.
C) not change in either California or West Virginia.
D) decrease in California and increase in West Virginia.
E) decrease in California and decrease in West Virginia.
Question
Question
Question
The following two graphs depict the equilibrium price of a pound of grapes in California and West virginia, respectively. Assume the type and quality of the grapes being sold in the two states are identical. Further, assume grape sellers incur zero costs to transport grapes between the two states and there are no other barriers to trade. Use these graphs to answer the next questions
-Which of the following pairs of prices is consistent with the law of one price?
A) California price: $0.50; West Virginia price: $0.80
B) California price: $0.80; West Virginia price: $0.80
C) California price: $1.20; West Virginia price: $1.20
D) California price: $1.35; West Virginia price: $1.35
E) California price: $1.50; West Virginia price: $1.50
Question
Question
Question
Question
Question
The following two graphs depict the equilibrium price of a pound of flax seed in Kentucky and West virginia, respectively. Assume the type and quality of the flax seed being sold in the two states are identical. Further, assume flax seed sellers incur zero costs to transport flax seed between the two states and that there are no other barriers to trade. Use these graphs to answer the next questions
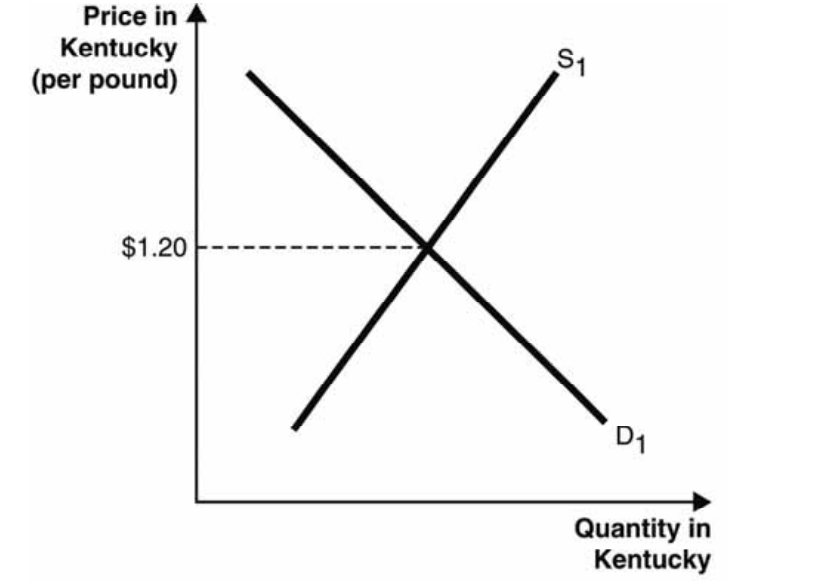
-Suppose the price of a pound of flax seed in West Virginia is currently $1.00. The law of one price suggests that because the price of a pound of flax seed is $1.20 in Kentucky, the price of a pound of flax seed will be_______ in West Virginia after sellers adjust their supplies in both markets.
A) $1.20
B) $1.00
C) $0.80
D) between $1.20 and $1.00
E) between $1.00 and $0.80
Question
Question
Question
The following two graphs depict the equilibrium price of a pound of flax seed in Kentucky and West virginia, respectively. Assume the type and quality of the flax seed being sold in the two states are identical. Further, assume flax seed sellers incur zero costs to transport flax seed between the two states and that there are no other barriers to trade. Use these graphs to answer the next questions
-Suppose the price of a pound of flax seed is currently $1.20 in both Kentucky and West Virginia. Further, suppose there is a decrease in demand for flax seed in Kentucky but not in West Virginia. Before flax seed sellers are able to adjust the relative quantity of flax seed supplied in the two states, the decrease in demand causes the equilibrium price of a pound of flax seed in Kentucky to change by $0.20. The law of one price suggests that the price of a pound of flax seed will be______ in West Virginia after sellers adjust the relative quantity of flax seed supplied in the two states.
A) $1.00
B) between $1.20 and $1.00
C) between $1.00 and $0.80
D) less than $0.80
E) higher than $1.20
Question
Question

Unlock Deck
Sign up to unlock the cards in this deck!
Unlock Deck
Unlock Deck
1/172
Play
Full screen (f)
Deck 20: International Finance
1
The following table shows the number of various foreign currencies required to buy a U.S. dollar in April 2011 and April 2016. Use this table to answer the next questions
-Between April 2011 and April 2016, the U.S. dollar depreciated against the
A) euro.
B) Chinese yuan.
C) Indian rupee.
D) Japanese yen.
E) British pound.
-Between April 2011 and April 2016, the U.S. dollar depreciated against the
A) euro.
B) Chinese yuan.
C) Indian rupee.
D) Japanese yen.
E) British pound.
Chinese yuan.
2
The following table shows the number of U.S. dollars required to buy one British pound between February 1, 2016, and September 1, 2016. Use this table to answer the next questions.
-Between March 1, 2016, and April 1, 2016, the U.S. dollar _____against the British pound, and the British pound ____against the U.S. dollar.
A) depreciated; appreciated
B) appreciated; depreciated
C) neither appreciated nor depreciated; depreciated
D) depreciated; neither appreciated nor depreciated
E) neither appreciated nor depreciated; neither appreciated nor depreciated
depreciated; appreciated
3
Currency _____occurs when a currency increases in value relative to other currencies.
A) devaluation
B) dismissal
C) depreciation
D) appreciation
E) representation
A) devaluation
B) dismissal
C) depreciation
D) appreciation
E) representation
appreciation
4
If the U.S. dollar_____ , it becomes ____valuable in world markets.
A) appreciates; less
B) depreciates; less
C) depreciates; more
D) is indexed; less
E) is indexed; more
A) appreciates; less
B) depreciates; less
C) depreciates; more
D) is indexed; less
E) is indexed; more
Unlock Deck
Unlock for access to all 172 flashcards in this deck.
Unlock Deck
k this deck
5
If a currency becomes____ valuable in world markets, then its price rises, and this increase is called a(n) _____.
A) less; appreciation
B) less; disaggregation
C) more; appreciation
D) more; aggregation
E) more; speculation
A) less; appreciation
B) less; disaggregation
C) more; appreciation
D) more; aggregation
E) more; speculation
Unlock Deck
Unlock for access to all 172 flashcards in this deck.
Unlock Deck
k this deck
6
The following table shows the number of U.S. dollars required to buy one euro between February 1,2016, and September 1, 2016. Use this table to answer the next questions.
-Between April 1, 2016, and June 1, 2016, the U.S. dollar____ against the euro, and the euro _____against the U.S. dollar.
A) depreciated; appreciated
B) appreciated; depreciated
C) neither appreciated nor depreciated; depreciated
D) depreciated; neither appreciated nor depreciated
E) appreciated; neither appreciated nor depreciated
Unlock Deck
Unlock for access to all 172 flashcards in this deck.
Unlock Deck
k this deck
7
The following table shows the number of U.S. dollars required to buy one British pound between February 1, 2016, and September 1, 2016. Use this table to answer the next questions.
-On March 1, 2016, the price of a surfboard was 1,200 U.S. dollars in La Jolla, California. Based on the exchange rates quoted in the table, a surfboard was approximately ____British pounds.
A) 1,931
B) 1,950
C) 1,883
D) 1,805
E) 842
-On March 1, 2016, the price of a surfboard was 1,200 U.S. dollars in La Jolla, California. Based on the exchange rates quoted in the table, a surfboard was approximately ____British pounds.
A) 1,931
B) 1,950
C) 1,883
D) 1,805
E) 842
Unlock Deck
Unlock for access to all 172 flashcards in this deck.
Unlock Deck
k this deck
8
The following table shows the number of various foreign currencies required to buy a U.S. dollar in April 2011 and April 2016. Use this table to answer the next questions
-Between April 2011 and April 2016, the price of a U.S. postage stamp increased from $0.41 to $0.46. The price of a U.S. postage stamp has increased approximately _____in terms of Indian rupees and _____in terms of Chinese yuan.
A) 12 percent; 12 percent
B) 68 percent; 11 percent
C) 13 percent; 44 percent
D) 19 percent; 28 percent
E) 9 percent; 51 percent
Unlock Deck
Unlock for access to all 172 flashcards in this deck.
Unlock Deck
k this deck
9
The following table shows the number of U.S. dollars required to buy one British pound between February 1, 2016, and September 1, 2016. Use this table to answer the next questions.
-On February 1, 2016, the price of a skateboard at JJ's Beach Shop was 120 U.S. dollars in La Jolla, California. On April 1, 2016, the price of a skateboard was 130 U.S. dollars. Using the exchange rates in the table, between February 1, 2016, and April 1, 2016, the price of a skateboard at JJ's Beach Shop increased by approximately____ in terms of U.S. dollars and_____ in terms of British pounds.( Round the percentage changes to the first decimal point.)
A) 7.7 percent; 2.3 percent
B) 7.7 percent; 12.8 percent
C) 8.3 percent; 2.3 percent
D) 8.3 percent; 8.1 percent
E) 8.3 percent; 7.7 percent
Unlock Deck
Unlock for access to all 172 flashcards in this deck.
Unlock Deck
k this deck
10
The following table shows the number of U.S. dollars required to buy one British pound between February 1, 2016, and September 1, 2016. Use this table to answer the next questions.
-Between February 1, 2016, and March 1, 2016, the U.S. dollar ______against the British pound, and the British pound ______against the U.S. dollar.
A) depreciated; appreciated
B) appreciated; depreciated
C) appreciated; appreciated
D) depreciated; neither appreciated nor depreciated
E) neither appreciated nor depreciated; neither appreciated nor depreciated
Unlock Deck
Unlock for access to all 172 flashcards in this deck.
Unlock Deck
k this deck
11
If a currency becomes_____ valuable in world markets, then its price falls, and this decrease is called a(n)_____ .
A) more; approximation
B) less; depreciation
C) less; appreciation
D) more; depreciation
E) more; appreciation
A) more; approximation
B) less; depreciation
C) less; appreciation
D) more; depreciation
E) more; appreciation
Unlock Deck
Unlock for access to all 172 flashcards in this deck.
Unlock Deck
k this deck
12
The following table shows the number of euros required to buy one U.S. dollar between February 1,2016, and September 1, 2016. Use this table to answer the next questions
-Between April 1, 2016, and June 1, 2016, the U.S. dollar____ against the euro, and the euro against ____the U.S. dollar.
A) depreciated; appreciated
B) appreciated; depreciated
C) neither appreciated nor depreciated; depreciated
D) depreciated; neither appreciated nor depreciated
E) appreciated; neither appreciated nor depreciated
Unlock Deck
Unlock for access to all 172 flashcards in this deck.
Unlock Deck
k this deck
13
The following table shows the number of U.S. dollars required to buy one British pound between February 1, 2016, and September 1, 2016. Use this table to answer the next questions.
-Between June 1, 2016, and August 1, 2016, the U.S. dollar _____against the British pound, and the British pound ____against the U.S. dollar.
A) depreciated; appreciated
B) appreciated; depreciated
C) appreciated; appreciated
D) depreciated; neither appreciated nor depreciated
E) neither appreciated nor depreciated; neither appreciated nor depreciated
Unlock Deck
Unlock for access to all 172 flashcards in this deck.
Unlock Deck
k this deck
14
The following table shows the number of euros required to buy one U.S. dollar between February 1,2016, and September 1, 2016. Use this table to answer the next questions
-Between March 1, 2016, and May 1, 2016, the U.S. dollar ____against the euro, and the euro_____ against the U.S. dollar.
A) depreciated; appreciated
B) appreciated; depreciated
C) neither appreciated nor depreciated; depreciated
D) depreciated; neither appreciated nor depreciated
E) appreciated; neither appreciated nor depreciated
Unlock Deck
Unlock for access to all 172 flashcards in this deck.
Unlock Deck
k this deck
15
The following table shows the number of U.S. dollars required to buy one euro between February 1,2016, and September 1, 2016. Use this table to answer the next questions.
-Between February 1, 2016, and September 1, 2016, the U.S. dollar ____against the euro, and the euro _____against the U.S. dollar.
A) depreciated; appreciated
B) appreciated; depreciated
C) neither appreciated nor depreciated; depreciated
D) depreciated; neither appreciated nor depreciated
E) appreciated; neither appreciated nor depreciated
Unlock Deck
Unlock for access to all 172 flashcards in this deck.
Unlock Deck
k this deck
16
Currency _____occurs when a currency decreases in value relative to other currencies.
A) apportionment
B) revaluation
C) depreciation
D) appreciation
E) representation
A) apportionment
B) revaluation
C) depreciation
D) appreciation
E) representation
Unlock Deck
Unlock for access to all 172 flashcards in this deck.
Unlock Deck
k this deck
17
The following table shows the number of U.S. dollars required to buy one euro between February 1,2016, and September 1, 2016. Use this table to answer the next questions.
-Between March 1, 2016, and May 1, 2016, the U.S. dollar____ against the euro, and the euro _____against the U.S. dollar.
A) depreciated; appreciated
B) appreciated; depreciated
C) neither appreciated nor depreciated; depreciated
D) depreciated; neither appreciated nor depreciated
E) appreciated; neither appreciated nor depreciated
Unlock Deck
Unlock for access to all 172 flashcards in this deck.
Unlock Deck
k this deck
18
If the U.S. dollar _____, it becomes____ valuable in world markets.
A) depreciates; more
B) is indexed; less
C) appreciates; less
D) is indexed; more
E) appreciates; more
A) depreciates; more
B) is indexed; less
C) appreciates; less
D) is indexed; more
E) appreciates; more
Unlock Deck
Unlock for access to all 172 flashcards in this deck.
Unlock Deck
k this deck
19
The following table shows the number of various foreign currencies required to buy a U.S. dollar in April 2011 and April 2016. Use this table to answer the next questions
-In April 2011, a haircut in Japan cost 2,000 yen. Using the exchange rates in the above table, that haircut cost approximately _____U.S. dollars or _____euros.
A) 24.04; 16.62
B) 20.08; 19.03
C) 203,080.00; 189,140.36
D) 21.15; 2,147.40
E) 9.82; 10.54
-In April 2011, a haircut in Japan cost 2,000 yen. Using the exchange rates in the above table, that haircut cost approximately _____U.S. dollars or _____euros.
A) 24.04; 16.62
B) 20.08; 19.03
C) 203,080.00; 189,140.36
D) 21.15; 2,147.40
E) 9.82; 10.54
Unlock Deck
Unlock for access to all 172 flashcards in this deck.
Unlock Deck
k this deck
20
The euro is an unusual currency because
A) euro coins are made of 100 percent gold.
B) it is the only other currency besides dollars that is issued solely by the United States Federal Reserve Bank.
C) euros cannot be exchanged for Mexican pesos.
D) euros are used by 19 countries in Europe.
E) a euro coin turns bright pink if it is used in an illegal transaction.
Unlock Deck
Unlock for access to all 172 flashcards in this deck.
Unlock Deck
k this deck
21
The following table shows the number of U.S. dollars required to buy one Mexican peso and the number of U.S. dollars required to buy one Japanese yen between June 1, 2016, and September 1,2016. Use this table to answer the next questions
-On June 1, 2016, the price of a 16-ounce can of mixed nuts was 135 Mexican pesos at a supermarket in Juarez, Mexico. Based on the exchange rates quoted in the table, the price of the 16-ounce can of mixed nuts was approximately _____U.S. dollars.
A) 0.18
B) 7.30
C) 7.24
D) 1,669.14
E) 1,722.38
-On June 1, 2016, the price of a 16-ounce can of mixed nuts was 135 Mexican pesos at a supermarket in Juarez, Mexico. Based on the exchange rates quoted in the table, the price of the 16-ounce can of mixed nuts was approximately _____U.S. dollars.
A) 0.18
B) 7.30
C) 7.24
D) 1,669.14
E) 1,722.38
Unlock Deck
Unlock for access to all 172 flashcards in this deck.
Unlock Deck
k this deck
22
The following two figures depict the demand and supply of U.S. dollars and the demand and supply of British pounds in the foreign currency exchange market. Use these figures to answer the next questions.
-An appreciation of the____- is shown in____ .
A) U.S. dollar; Figure A but not Figure B
B) U.S. dollar; Figure B but not Figure A
C) U.S. dollar; both Figures A and B
D) British pound; neither Figure A nor Figure B
E) British pound; both Figures A and B
-An appreciation of the____- is shown in____ .
A) U.S. dollar; Figure A but not Figure B
B) U.S. dollar; Figure B but not Figure A
C) U.S. dollar; both Figures A and B
D) British pound; neither Figure A nor Figure B
E) British pound; both Figures A and B
Unlock Deck
Unlock for access to all 172 flashcards in this deck.
Unlock Deck
k this deck
23
If interest rates in Australia decrease relative to the rest of the world, it means that (1) Australian bonds will provide a____ return than previously and (2)______ for these bonds will_____ .
A) higher; supply; decrease
B) higher; supply; increase
C) higher; demand; increase
D) lower; demand; decrease
E) lower; demand; increase
A) higher; supply; decrease
B) higher; supply; increase
C) higher; demand; increase
D) lower; demand; decrease
E) lower; demand; increase
Unlock Deck
Unlock for access to all 172 flashcards in this deck.
Unlock Deck
k this deck
24
The following table shows the number of British pounds required to buy one U.S. dollar between February 1, 2016, and September 1, 2016. Use this table to answer the next questions
-Between February 1, 2016, and March 1, 2016, the U.S. dollar ____against the British pound, and the British pound_____against the U.S. dollar.
A) depreciated; appreciated
B) appreciated; depreciated
C) neither appreciated nor depreciated; depreciated
D) depreciated; depreciated
E) appreciated; neither appreciated nor depreciated
Unlock Deck
Unlock for access to all 172 flashcards in this deck.
Unlock Deck
k this deck
25
The following table shows the number of U.S. dollars required to buy one Mexican peso and the number of U.S. dollars required to buy one Japanese yen between June 1, 2016, and September 1,2016. Use this table to answer the next questions
-Between June 1, 2016, and July 1, 2016, the number of U.S. goods exported to Mexico likely
A) increased because U.S. goods became more expensive to consumers in Mexico.
B) decreased because U.S. goods became more expensive to consumers in Mexico.
C) increased because U.S. goods became less expensive to consumers in Mexico.
D) decreased because U.S. goods became less expensive to consumers in Mexico.
E) did not change because exchange rates do not affect trade.
Unlock Deck
Unlock for access to all 172 flashcards in this deck.
Unlock Deck
k this deck
26
The following table shows the number of U.S. dollars required to buy one Mexican peso and the number of U.S. dollars required to buy one Japanese yen between June 1, 2016, and September 1,2016. Use this table to answer the next questions
-Between August 1, 2016, and September 1, 2016, the number of
A) Japanese goods exported to the United States likely decreased because Japanese goods became more expensive to consumers in the United States.
B) U.S. goods exported to Japan likely decreased because U.S. goods became less expensive to consumers in Japan.
C) Mexican goods exported to the United States likely increased because the Mexican peso depreciated against the U.S. dollar.
D) U.S. goods exported to Mexico likely did not change because the Mexican peso is pegged to the Japanese yen but not to the U.S. dollar.
E) Japanese goods exported to the United States likely increased because Japanese goods became less expensive to consumers in the United States.
Unlock Deck
Unlock for access to all 172 flashcards in this deck.
Unlock Deck
k this deck
27
The following table shows the number of British pounds required to buy one U.S. dollar between February 1, 2016, and September 1, 2016. Use this table to answer the next questions
-Between June 1, 2016, and August 1, 2016, the U.S. dollar ____against the British pound, and the British pound ____against the U.S. dollar.
A) depreciated; appreciated
B) appreciated; depreciated
C) neither appreciated nor depreciated; depreciated
D) depreciated; depreciated
E) appreciated; neither appreciated nor depreciated
Unlock Deck
Unlock for access to all 172 flashcards in this deck.
Unlock Deck
k this deck
28
When demand for Canada's exports falls,
A) Canadian producers will sell more goods to foreigners.
B) the U.S. federal government will always respond by increasing U.S. tax rates.
C) the U.S. federal government will always respond by increasing U.S. exports.
D) demand of the Canadian dollar in the foreign exchange market falls.
E) supply of the Canadian dollar in the foreign exchange market rises.
Unlock Deck
Unlock for access to all 172 flashcards in this deck.
Unlock Deck
k this deck
29
The following table shows the number of U.S. dollars required to buy one Mexican peso and the number of U.S. dollars required to buy one Japanese yen between June 1, 2016, and September 1,2016. Use this table to answer the next questions
-On August 1, 2016, Carlos paid 800,000 Japanese yen for a solid gold iPhone case in Fukushima, Japan. Because he only had Mexican pesos, he needed to exchange his pesos at a nearby bank in order to get the 800,000 yen he used to pay for the iPhone case. The bank is able to buy and sell U.S. dollars, Mexican pesos, and Japanese yen at the exchange rates shown in the table. Approximately how much did the iPhone case cost Carlos in terms of Mexican pesos?
A) 8,584
B) 11,333
C) 146,396
D) 171,118
E) 4,371,717
Unlock Deck
Unlock for access to all 172 flashcards in this deck.
Unlock Deck
k this deck
30
When demand for Canada's exports rises,
A) demand for the Canadian dollar in the foreign exchange market falls.
B) demand for the Canadian dollar in the foreign exchange market rises.
C) the Canadian dollar depreciates against all other currencies.
D) supply of the Canadian dollar in the foreign exchange market falls.
E) supply of the Canadian dollar in the foreign exchange market rises.
Unlock Deck
Unlock for access to all 172 flashcards in this deck.
Unlock Deck
k this deck
31
The following table shows the number of U.S. dollars required to buy one Mexican peso and the number of U.S. dollars required to buy one Japanese yen between June 1, 2016, and September 1,2016. Use this table to answer the next questions
-On June 1, 2016, Samantha bought a yoga mat for 250 Mexican pesos in Playa del Carmen, Mexico. Because she only had Japanese yen, she needed to exchange her Japanese yen at a nearby
Money-exchange kiosk in order to get the 250 Mexican pesos she used for the purchase. The kiosk is able to buy and sell U.S. dollars, Mexican pesos, and Japanese yen at the exchange rates shown in the table. Approximately how much did the yoga mat cost Samantha in terms of Japanese yen?
A) 0.2136
B) 1,121
C) 3,151
D) 1,411
E) 292,609
Unlock Deck
Unlock for access to all 172 flashcards in this deck.
Unlock Deck
k this deck
32
If interest rates rise in the United States relative to the rest of the world, the demand for U.S. dollars will _____because there is greater demand for assets with _____returns.
A) decrease; higher
B) decrease; lower
C) increase; higher
D) increase; lower
E) increase; diminishing marginal
A) decrease; higher
B) decrease; lower
C) increase; higher
D) increase; lower
E) increase; diminishing marginal
Unlock Deck
Unlock for access to all 172 flashcards in this deck.
Unlock Deck
k this deck
33
The claim that the quantity of euros demanded by U.S. consumers will fall when the price of euros in terms of U.S. dollars rises is best referred to as the
A) law of increasing marginal costs.
B) hot-hand fallacy.
C) law of supply.
D) exchange rate-inflation fallacy.
E) law of demand.
A) law of increasing marginal costs.
B) hot-hand fallacy.
C) law of supply.
D) exchange rate-inflation fallacy.
E) law of demand.
Unlock Deck
Unlock for access to all 172 flashcards in this deck.
Unlock Deck
k this deck
34
According to the law of _____, the quantity of yen demanded by U.S. consumers will____ when the price of yen in terms of U.S. dollars falls.
A) demand; fall
B) demand; rise
C) international banking secrecy; neither rise nor fall
D) supply; neither rise nor fall
E) supply; fall
A) demand; fall
B) demand; rise
C) international banking secrecy; neither rise nor fall
D) supply; neither rise nor fall
E) supply; fall
Unlock Deck
Unlock for access to all 172 flashcards in this deck.
Unlock Deck
k this deck
35
The following table shows the number of U.S. dollars required to buy one Mexican peso and the number of U.S. dollars required to buy one Japanese yen between June 1, 2016, and September 1,2016. Use this table to answer the next questions
-On July 1, 2016, Brandy paid 450 Mexican pesos for a manicure in Playa del Carmen, Mexico. Because she only had Japanese yen, she needed to exchange her Japanese yen at a nearby
Money-exchange kiosk in order to get the 450 Mexican pesos she used to pay the manicurist. The kiosk is able to buy and sell U.S. dollars, Mexican pesos, and Japanese yen at the exchange rates shown in the table. Approximately how much did the manicure cost Brandy in terms of Japanese yen?
A) 0.3386
B) 2,517
C) 2,921
D) 0.3243
E) 472,532
Unlock Deck
Unlock for access to all 172 flashcards in this deck.
Unlock Deck
k this deck
36
In the foreign currency market, the supply of a foreign currency is assumed to be____- because the central bank determines the supply of money.
A) horizontal
B) vertical
C) upward sloping
D) downward sloping
E) uncontrollable
A) horizontal
B) vertical
C) upward sloping
D) downward sloping
E) uncontrollable
Unlock Deck
Unlock for access to all 172 flashcards in this deck.
Unlock Deck
k this deck
37
If interest rates fall in the United States relative to the rest of the world, the demand for U.S. dollars will _____because there is lesser demand for assets with ____returns.
A) decrease; higher
B) decrease; lower
C) increase; higher
D) increase; lower
E) increase; diminishing marginal
A) decrease; higher
B) decrease; lower
C) increase; higher
D) increase; lower
E) increase; diminishing marginal
Unlock Deck
Unlock for access to all 172 flashcards in this deck.
Unlock Deck
k this deck
38
The following table shows the number of U.S. dollars required to buy one Mexican peso and the number of U.S. dollars required to buy one Japanese yen between June 1, 2016, and September 1,2016. Use this table to answer the next questions
-On August 1, 2016, the price of a jar of pickles was 135 Mexican pesos at a supermarket in Juarez, Mexico. Based on the exchange rates quoted in the table, the price of the jar of pickles was approximately _____U.S. dollars.
A) 0.18
B) 7.31
C) 7.24
D) 1,669.14
E) 1,722.38
-On August 1, 2016, the price of a jar of pickles was 135 Mexican pesos at a supermarket in Juarez, Mexico. Based on the exchange rates quoted in the table, the price of the jar of pickles was approximately _____U.S. dollars.
A) 0.18
B) 7.31
C) 7.24
D) 1,669.14
E) 1,722.38
Unlock Deck
Unlock for access to all 172 flashcards in this deck.
Unlock Deck
k this deck
39
If interest rates in Canada increase relative to the rest of the world, it means that (1) Canadian bonds will provide a _____return than previously and (2)____ for these bonds will___- .
A) higher; supply; decrease
B) higher; supply; increase
C) higher; demand; increase
D) lower; demand; decrease
E) lower; demand; increase
A) higher; supply; decrease
B) higher; supply; increase
C) higher; demand; increase
D) lower; demand; decrease
E) lower; demand; increase
Unlock Deck
Unlock for access to all 172 flashcards in this deck.
Unlock Deck
k this deck
40
Which statement best describes the law of demand as it relates to currency markets?
A) The law of demand only applies to goods and services, not currency.
B) When the price of a Mexican peso in terms of a U.S. dollar decreases, U.S. consumers demand fewer Mexican pesos because Mexican goods become more expensive to American consumers.
C) When the price of Japanese yen in terms of a U.S. dollar decreases, U.S. consumers demand more Japanese dollars because Japanese goods become more expensive to American consumers.
D) When the price of a Canadian dollar in terms of a U.S. dollar increases, U.S. consumers demand fewer Canadian dollars because Canadian goods become more expensive to American consumers.
E) When the price of an Australian dollar in terms of a U.S. dollar increases, U.S. consumers demand more Australian dollars because Australian goods become less expensive to American consumers.
Unlock Deck
Unlock for access to all 172 flashcards in this deck.
Unlock Deck
k this deck
41
If the Bank of Japan the Japanese central bank) were to take steps to devalue the yen in foreign currency markets, _______, which would cause Japanese real gross domestic product GDP) to increase in the short run.
A) aggregate demand for Japanese goods and services would increase
B) aggregate demand for Japanese goods and services would decrease
C) Japanese interest rates would rise
D) aggregate supply of Japanese goods and services would decrease
E) one U.S. dollar would subsequently buy many fewer yen
A) aggregate demand for Japanese goods and services would increase
B) aggregate demand for Japanese goods and services would decrease
C) Japanese interest rates would rise
D) aggregate supply of Japanese goods and services would decrease
E) one U.S. dollar would subsequently buy many fewer yen
Unlock Deck
Unlock for access to all 172 flashcards in this deck.
Unlock Deck
k this deck
42
An increase in U.S. consumer demand for British goods is consistent with
A) both Figures A and B.
B) neither Figure A nor Figure B.
C) Figure A but not Figure B.
D) Figure B but not Figure A.
E) the supply curve being upward sloping in both Figures A and B.
A) both Figures A and B.
B) neither Figure A nor Figure B.
C) Figure A but not Figure B.
D) Figure B but not Figure A.
E) the supply curve being upward sloping in both Figures A and B.
Unlock Deck
Unlock for access to all 172 flashcards in this deck.
Unlock Deck
k this deck
43
If the Bank of Japan (the Japanese central bank) were to take steps to devalue the yen in foreign currency markets, the Japanese_______ curve would shift rightward in the short run and the Japanese _______curve would shift leftward in the long run.
A) aggregate demand; aggregate demand
B) short-run aggregate supply; aggregate demand
C) long-run aggregate supply; short-run aggregate supply
D) aggregate yen maintenance; aggregate U.S. dollar diminution
E) aggregate demand; short-run aggregate supply
A) aggregate demand; aggregate demand
B) short-run aggregate supply; aggregate demand
C) long-run aggregate supply; short-run aggregate supply
D) aggregate yen maintenance; aggregate U.S. dollar diminution
E) aggregate demand; short-run aggregate supply
Unlock Deck
Unlock for access to all 172 flashcards in this deck.
Unlock Deck
k this deck
44
The following figure depicts the supply of U.S. dollars in the foreign currency exchange market. Use this figure to answer the next questions
-If the U.S. central bank decreases the supply of U.S. dollars, the supply curve in the above figure will ____; if the Indian central bank increases the supply of rupees, the supply curve in the above figure will ____.
A) shift leftward; also shift leftward
B) shift rightward; not shift
C) not shift; shift rightward
D) shift rightward; shift leftward
E) shift leftward; not change
Unlock Deck
Unlock for access to all 172 flashcards in this deck.
Unlock Deck
k this deck
45
The following figure depicts the supply of U.S. dollars in the foreign currency exchange market. Use this figure to answer the next questions
-The U.S. central bank has the power to increase or decrease the supply of U.S. dollars. If the U.S. central bank increases the supply of U.S. dollars, the supply curve in the above figure will____ ; if the U.S. central bank decreases the supply of U.S. dollars, the supply curve in the above figure will____ .
A) shift rightward; shift leftward
B) shift leftward; shift rightward
C) shift rightward; also shift rightward
D) shift leftward; also shift leftward
E) not shift; not shift
Unlock Deck
Unlock for access to all 172 flashcards in this deck.
Unlock Deck
k this deck
46
Figure A below depicts the demand and supply of Japanese yen in the foreign currency exchange market. Figure B below depicts the aggregate supply–aggregate demand model for the Japanese economy. Use these figures to answer the next questions.
-Which of the following is the most accurate description of the phenomenon shown in Figure B?
A) The Japanese central bank increased the money supply S1 to S2, which caused the price level to fall from 115 to 110, which then caused the short-run aggregate supply to decrease from SRAS1 to SRAS2.
B) The Japanese central bank increased the money supply S1 to S2, which caused aggregate demand to increase from AD1 to AD2, which then caused the short-run aggregate supply to decrease from SRAS1 to SRAS2.
C) The Japanese central bank decreased the money supply S1 to S3, which caused aggregate demand to decrease from AD2 to AD1, which then caused the short-run aggregate supply to decrease from SRAS1 to SRAS2.
D) The Japanese central bank increased the money supply S1 to S2, which caused real gross domestic product GDP) to fall from Y2 to Y1, which caused the short-run aggregate supply to decrease from SRAS1 to SRAS2, which then caused aggregate demand to increase from AD1 to AD2.
E) Aggregate demand increased from AD1 to AD2, which forced the Japanese central bank to increase the money supply S1 to S2, which then caused the short-run aggregate supply to decrease from SRAS1 to SRAS2.
Unlock Deck
Unlock for access to all 172 flashcards in this deck.
Unlock Deck
k this deck
47
If interest rates in Mexico rise relative to interest rates in the United States, the demand curve in the figure above
A) will not shift because interest rates are not related to exchange rates.
B) will not shift because interest rates only affect the supply curve.
C) can either increase from D1 to D2 or decrease from D1 to D3, depending on the relative magnitude of the two effects.
D) will increase from D1 to D2.
E) will decrease from D1 to D3.
Unlock Deck
Unlock for access to all 172 flashcards in this deck.
Unlock Deck
k this deck
48
The arrows in Figures A–D represent possible movements of the exchange rate (euros per U.S. dollar) and the quantity of U.S. dollars buyers are willing and able to buy. Use these figures to answer the next questions
-An appreciation of the euro against the U.S. dollar is represented by Figure _____, and a depreciation of the U.S. dollar against the euro is represented by Figure _____.
A) A; C
B) A; A
C) B; D
D) D; B
E) A; D
-An appreciation of the euro against the U.S. dollar is represented by Figure _____, and a depreciation of the U.S. dollar against the euro is represented by Figure _____.
A) A; C
B) A; A
C) B; D
D) D; B
E) A; D
Unlock Deck
Unlock for access to all 172 flashcards in this deck.
Unlock Deck
k this deck
49
The following two figures depict the demand and supply of U.S. dollars and the demand and supply of British pounds in the foreign currency exchange market. Use these figures to answer the next questions.
-Assume that the same event caused demand for U.S. dollars to decrease and demand for British pounds to increase and that both of these graphs describe that event. Approximately what is Y2 ?
A) $0.50
B) $0.71
C) $0.83
D) $1.20
E) $1.40
-Assume that the same event caused demand for U.S. dollars to decrease and demand for British pounds to increase and that both of these graphs describe that event. Approximately what is Y2 ?
A) $0.50
B) $0.71
C) $0.83
D) $1.20
E) $1.40
Unlock Deck
Unlock for access to all 172 flashcards in this deck.
Unlock Deck
k this deck
50
______occurs when a national government or central bank intentionally adjusts its money supply to affect the exchange rate of its currency.
A) Dollarization
B) A complete breakdown of the fractional reserve banking system
C) Demonetization
D) Exchange rate manipulation
E) A currency war
A) Dollarization
B) A complete breakdown of the fractional reserve banking system
C) Demonetization
D) Exchange rate manipulation
E) A currency war
Unlock Deck
Unlock for access to all 172 flashcards in this deck.
Unlock Deck
k this deck
51
A national government or central bank can _____its currency in foreign currency exchange markets by printing more of it.
A) reflate
B) recombine
C) demonetize
D) monetize
E) devalue
A) reflate
B) recombine
C) demonetize
D) monetize
E) devalue
Unlock Deck
Unlock for access to all 172 flashcards in this deck.
Unlock Deck
k this deck
52
In the short run,________ would increase domestic aggregate demand in the context of the aggregate supply-aggregate demand model.
A) an increase in the value of the domestic currency against all foreign currencies
B) a depreciation of the domestic currency against all foreign currencies
C) an appreciation of the domestic currency against all foreign currencies
D) a depreciation of all foreign currencies against the domestic currency
E) either an increase or decrease in domestic government spending
Unlock Deck
Unlock for access to all 172 flashcards in this deck.
Unlock Deck
k this deck
53
The figure below depicts the supply of U.S. dollars in the foreign currency exchange market. A shift from D1 to D3 in the above figure could have been caused by an)
A) decrease in the exchange rate from £1.2/$1 to £1.1/$1.
B) increase in the exchange rate from £1.1/$1 to £1.2/$1.
C) increase in demand for U.S. assets relative to British assets.
D) increase in U.S. interest rates relative to British interest rates.
E) decrease in British consumers' demand for U.S. goods.
A shift from D1 to D3 in the above figure could have been caused by an)A) decrease in the exchange rate from £1.2/$1 to £1.1/$1.
B) increase in the exchange rate from £1.1/$1 to £1.2/$1.
C) increase in demand for U.S. assets relative to British assets.
D) increase in U.S. interest rates relative to British interest rates.
E) decrease in British consumers' demand for U.S. goods.
Unlock Deck
Unlock for access to all 172 flashcards in this deck.
Unlock Deck
k this deck
54
Figure A below depicts the demand and supply of Japanese yen in the foreign currency exchange market. Figure B below depicts the aggregate supply–aggregate demand model for the Japanese economy. Use these figures to answer the next questions.
-Assume the Japanese economy is illustrated at the intersection of AD1 and SRAS1. If the Bank of Japan the Japanese central bank) increased the supply of yen from five trillion to six trillion, the Japanese price level would ______in the short run and increase from 115 to 120 in the long run.
A) decrease from 120 to 110
B) not change
C) increase from 110 to 120
D) decrease from 120 to 115
E) increase from 110 to 115
Unlock Deck
Unlock for access to all 172 flashcards in this deck.
Unlock Deck
k this deck
55
The following two figures depict the demand and supply of U.S. dollars and the demand and supply of British pounds in the foreign currency exchange market. Use these figures to answer the next questions.
-Assume that the same event caused demand for U.S. dollars to decrease and demand for British pounds to increase and that both of these graphs describe that event. Approximately what is Y1 ?
A) $0.50
B) $0.71
C) $0.83
D) $1.20
E) $1.40
-Assume that the same event caused demand for U.S. dollars to decrease and demand for British pounds to increase and that both of these graphs describe that event. Approximately what is Y1 ?
A) $0.50
B) $0.71
C) $0.83
D) $1.20
E) $1.40
Unlock Deck
Unlock for access to all 172 flashcards in this deck.
Unlock Deck
k this deck
56
If the interest rates in China fall relative to interest rates in the United States and, at the same time, U.S. consumer demand for Chinese goods decreases, the demand curve in the figure above
A) will not shift because interest rates are not related to exchange rates.
B) will not shift because interest rates only affect the supply curve.
C) can either increase from D1 to D2 or decrease from D1 to D3.
D) will increase from D1 to D2.
E) will decrease from D1 to D3.
A) will not shift because interest rates are not related to exchange rates.
B) will not shift because interest rates only affect the supply curve.
C) can either increase from D1 to D2 or decrease from D1 to D3.
D) will increase from D1 to D2.
E) will decrease from D1 to D3.
Unlock Deck
Unlock for access to all 172 flashcards in this deck.
Unlock Deck
k this deck
57
The figure below depicts the three possible aggregate demand curves.
If the Bank of Canada (the Canadian central bank)_____ Canadian dollar(s), the Canadian dollar will depreciate and the aggregate demand curve will shift from AD2 to____ .
A) devalues the; AD1
B) prints more; AD1
C) decreases the supply of; AD3
D) increases the supply of; AD3
E) prints less; AD3
If the Bank of Canada (the Canadian central bank)_____ Canadian dollar(s), the Canadian dollar will depreciate and the aggregate demand curve will shift from AD2 to____ .
A) devalues the; AD1
B) prints more; AD1
C) decreases the supply of; AD3
D) increases the supply of; AD3
E) prints less; AD3
Unlock Deck
Unlock for access to all 172 flashcards in this deck.
Unlock Deck
k this deck
58
If the interest rates in China rise relative to interest rates in the United States, the demand curve in the figure above
A) will not shift because interest rates are not related to exchange rates.
B) will not shift because interest rates only affect the supply curve.
C) can either increase from D1 to D2 or decrease from D1 to D3.
D) will increase from D1 to D2.
E) will decrease from D1 to D3.
A) will not shift because interest rates are not related to exchange rates.
B) will not shift because interest rates only affect the supply curve.
C) can either increase from D1 to D2 or decrease from D1 to D3.
D) will increase from D1 to D2.
E) will decrease from D1 to D3.
Unlock Deck
Unlock for access to all 172 flashcards in this deck.
Unlock Deck
k this deck
59
The arrows in Figures A–D represent possible movements of the exchange rate (euros per U.S. dollar) and the quantity of U.S. dollars buyers are willing and able to buy. Use these figures to answer the next questions
-A depreciation of the euro against the U.S. dollar is represented by Figure____ , and a depreciation of the U.S. dollar against the euro is represented by Figure ____.
A) A; C
B) C; A
C) B; D
D) D; B
E) A; D
-A depreciation of the euro against the U.S. dollar is represented by Figure____ , and a depreciation of the U.S. dollar against the euro is represented by Figure ____.
A) A; C
B) C; A
C) B; D
D) D; B
E) A; D
Unlock Deck
Unlock for access to all 172 flashcards in this deck.
Unlock Deck
k this deck
60
If interest rates in the United States rise relative to interest rates in Mexico and, at the same time, Mexican consumer demand for U.S. goods decreases, the demand curve in the figure above
A) will not shift because interest rates are not related to exchange rates.
B) will not shift because interest rates only affect the supply curve.
C) can either increase from D1 to D2 or decrease from D1 to D3, depending on the relative magnitude of the two effects.
D) will increase from D1 to D2.
E) will decrease from D1 to D3.
Unlock Deck
Unlock for access to all 172 flashcards in this deck.
Unlock Deck
k this deck
61
The following two graphs depict the equilibrium price of a pound of grapes in California and West virginia, respectively. Assume the type and quality of the grapes being sold in the two states are identical. Further, assume grape sellers incur zero costs to transport grapes between the two states and there are no other barriers to trade. Use these graphs to answer the next questions
-According to the law of one price, the supply curve in the California grape market will shift to the______ , and the supply curve in the West Virginia grape market will_____ .
A) right; also shift to the right
B) left; shift to the right
C) right; shift to the left
D) left; also shift to the left
E) left; not shift
Unlock Deck
Unlock for access to all 172 flashcards in this deck.
Unlock Deck
k this deck
62
The following graph depicts the market for potatoes in West Virginia. Assume there are similar markets for potatoes in all other U.S. states and that the potatoes sold in all states are identical.
Further, assume potato sellers incur zero costs to transport potatoes between any U.S. states and that there are no other barriers to trade. Use this graph to answer the next question.
-Suppose the equilibrium price of a pound of potatoes in all U.S. states is initially $1.20. Which scenario could cause a shift in West Virginia from S1 to S2 as shown in the graph?
A) Potato farmers in other states produce unusually large crops of potatoes, causing the price in those states to fall to $1.00.
B) Potato farmers in other states produce unusually small crops of potatoes, causing the price in those states to rise to $1.50.
C) Demand for potatoes increases in West Virginia, causing the price there to rise to $1.50.
D) Demand for potatoes falls in other states, causing the price in those states to fall to $1.00.
E) Demand for potatoes falls in West Virginia, causing the price there to fall to $1.00.
Unlock Deck
Unlock for access to all 172 flashcards in this deck.
Unlock Deck
k this deck
63
According to the theory of purchasing power parity, why should identical goods have the same price in different locations?
A) To prevent price gouging, international law mandates that identical goods must be sold for the same currency-adjusted price across all locations.
B) If the goods were two different prices, it would cause an increase in supply of the good at the low-price location and a decrease in supply of the good at the high-price location, which would cause the prices in each location to converge to the same price.
C) If the goods were two different prices, it would cause an increase in supply of the good at the high-price location and a decrease in supply of the good at the low-price location, which would cause the prices in each location to converge to the same price.
D) If the goods were two different prices, it would cause a decrease in demand of the good at the low-price location and an increase in demand of the good at the high-price location, which would cause the prices in each location to converge to the same price.
E) If the goods were two different prices, it would cause an increase in demand of the good solely at the low-price location until that good reached the same price as the good in the high-price location.
Unlock Deck
Unlock for access to all 172 flashcards in this deck.
Unlock Deck
k this deck
64
Assuming the theory of purchasing power parity holds, what is the exchange rate between the United States and Mexico if the price of an identical Under Armour shirt costs $25 in the United States and 350 pesos in Mexico rounded to the nearest penny)?
A) $0.07 per peso
B) $14.00 per peso
C) $0.70 per peso
D) $0.88 per peso
E) $0.14 per peso
A) $0.07 per peso
B) $14.00 per peso
C) $0.70 per peso
D) $0.88 per peso
E) $0.14 per peso
Unlock Deck
Unlock for access to all 172 flashcards in this deck.
Unlock Deck
k this deck
65
________exchange rates are exchange rates that are determined by the market forces of supply and demand for currency.
A) Rigid
B) Stock
C) Government-determined
D) Pegged
E) Floating
A) Rigid
B) Stock
C) Government-determined
D) Pegged
E) Floating
Unlock Deck
Unlock for access to all 172 flashcards in this deck.
Unlock Deck
k this deck
66
In order to maintain a pegged exchange rate in China,
A) the Chinese government must prevent Chinese citizens from trading goods or services with other countries.
B) the Chinese government must prevent Chinese citizens from purchasing assets denominated in foreign currencies.
C) the Chinese government must adjust the supply of the yuan in world markets.
D) at least one foreign country must also maintain a pegged exchange rate.
E) no other country with which China shares a geographical border can maintain a pegged exchange rate.
Unlock Deck
Unlock for access to all 172 flashcards in this deck.
Unlock Deck
k this deck
67
The following two graphs depict the equilibrium price of a pound of grapes in California and West virginia, respectively. Assume the type and quality of the grapes being sold in the two states are identical. Further, assume grape sellers incur zero costs to transport grapes between the two states and there are no other barriers to trade. Use these graphs to answer the next questions
-According to the law of one price, the price of grapes will
A) increase in California and decrease in West Virginia.
B) increase in California and increase in West Virginia.
C) not change in either California or West Virginia.
D) decrease in California and increase in West Virginia.
E) decrease in California and decrease in West Virginia.
Unlock Deck
Unlock for access to all 172 flashcards in this deck.
Unlock Deck
k this deck
68
Assuming the theory of purchasing power parity holds, if the exchange rate between the United States and Japan is $0.011 per yen ¥), then how much does a $400 Microsoft Xbox cost in Japanese yen?
A) ¥27,273
B) ¥31,818
C) ¥36,364
D) ¥44,000
E) ¥46,467
A) ¥27,273
B) ¥31,818
C) ¥36,364
D) ¥44,000
E) ¥46,467
Unlock Deck
Unlock for access to all 172 flashcards in this deck.
Unlock Deck
k this deck
69
Floating exchange rates can also be referred to as ________exchange rates.
A) flexible
B) real
C) fixed
D) pegged
E) specialized
A) flexible
B) real
C) fixed
D) pegged
E) specialized
Unlock Deck
Unlock for access to all 172 flashcards in this deck.
Unlock Deck
k this deck
70
The following two graphs depict the equilibrium price of a pound of grapes in California and West virginia, respectively. Assume the type and quality of the grapes being sold in the two states are identical. Further, assume grape sellers incur zero costs to transport grapes between the two states and there are no other barriers to trade. Use these graphs to answer the next questions
-Which of the following pairs of prices is consistent with the law of one price?
A) California price: $0.50; West Virginia price: $0.80
B) California price: $0.80; West Virginia price: $0.80
C) California price: $1.20; West Virginia price: $1.20
D) California price: $1.35; West Virginia price: $1.35
E) California price: $1.50; West Virginia price: $1.50
Unlock Deck
Unlock for access to all 172 flashcards in this deck.
Unlock Deck
k this deck
71
If the theory of purchasing power parity holds, then how much does an Egyptian tapestry cost in the United States if the same tapestry sells for 15,000 Egyptian pounds in Egypt and the exchange rate is $0.14 per Egyptian pound?
A) $12,000
B) $2,100
C) $107,143
D) $15,000
E) $3,148
A) $12,000
B) $2,100
C) $107,143
D) $15,000
E) $3,148
Unlock Deck
Unlock for access to all 172 flashcards in this deck.
Unlock Deck
k this deck
72
According to the law of _____, after accounting for transportation costs and trade barriers, identical goods in different locations must sell for the same price.
A) supply
B) demand
C) one price
D) currency equivocation
E) diminishing marginal product
A) supply
B) demand
C) one price
D) currency equivocation
E) diminishing marginal product
Unlock Deck
Unlock for access to all 172 flashcards in this deck.
Unlock Deck
k this deck
73
_________exchange rates are exchange rates that are fixed at a certain level through the actions of a government.
A) Variable
B) Flexible
C) Pegged
D) Speculated
E) Real
A) Variable
B) Flexible
C) Pegged
D) Speculated
E) Real
Unlock Deck
Unlock for access to all 172 flashcards in this deck.
Unlock Deck
k this deck
74
The national government or central bank of country X might take steps to purposefully depreciate its currency because
A) country X wants its currency to command more respect from international news reporters.
B) consumers in country X would be able to purchase more goods from producers in country Y.
C) producers in country X would be able to sell more goods to consumers in country Y.
D) a depreciated currency would benefit both consumers and producers in country X.
E) an appreciated currency would harm both consumers and producers in country Y.
Unlock Deck
Unlock for access to all 172 flashcards in this deck.
Unlock Deck
k this deck
75
The following two graphs depict the equilibrium price of a pound of flax seed in Kentucky and West virginia, respectively. Assume the type and quality of the flax seed being sold in the two states are identical. Further, assume flax seed sellers incur zero costs to transport flax seed between the two states and that there are no other barriers to trade. Use these graphs to answer the next questions
-Suppose the price of a pound of flax seed in West Virginia is currently $1.00. The law of one price suggests that because the price of a pound of flax seed is $1.20 in Kentucky, the price of a pound of flax seed will be_______ in West Virginia after sellers adjust their supplies in both markets.
A) $1.20
B) $1.00
C) $0.80
D) between $1.20 and $1.00
E) between $1.00 and $0.80
Unlock Deck
Unlock for access to all 172 flashcards in this deck.
Unlock Deck
k this deck
76
Suppose market forces outside of the control of the Chinese government are causing the price of Chinese yuan in terms of Japanese yen to rise. In order to maintain the current value of the yuan, the Chinese government must
A) file a pegging application with one of the three international currency-management agencies.
B) ban Chinese firms from hiring Japanese workers.
C) use tax incentives to encourage Chinese firms to hire more Japanese workers.
D) get official approval from the World Trade Organization.
E) buy yen with newly created yuan.
Unlock Deck
Unlock for access to all 172 flashcards in this deck.
Unlock Deck
k this deck
77
Assuming the theory of purchasing power parity holds, if the exchange rate between the United States and Europe is $1.33 per euro, then how much does a 35 euro bottle of French champagne cost in U.S. dollars?
A) $26.60
B) $46.55
C) $35.00
D) $3.80
E) $38.99
A) $26.60
B) $46.55
C) $35.00
D) $3.80
E) $38.99
Unlock Deck
Unlock for access to all 172 flashcards in this deck.
Unlock Deck
k this deck
78
The following two graphs depict the equilibrium price of a pound of flax seed in Kentucky and West virginia, respectively. Assume the type and quality of the flax seed being sold in the two states are identical. Further, assume flax seed sellers incur zero costs to transport flax seed between the two states and that there are no other barriers to trade. Use these graphs to answer the next questions
-Suppose the price of a pound of flax seed is currently $1.20 in both Kentucky and West Virginia. Further, suppose there is a decrease in demand for flax seed in Kentucky but not in West Virginia. Before flax seed sellers are able to adjust the relative quantity of flax seed supplied in the two states, the decrease in demand causes the equilibrium price of a pound of flax seed in Kentucky to change by $0.20. The law of one price suggests that the price of a pound of flax seed will be______ in West Virginia after sellers adjust the relative quantity of flax seed supplied in the two states.
A) $1.00
B) between $1.20 and $1.00
C) between $1.00 and $0.80
D) less than $0.80
E) higher than $1.20
Unlock Deck
Unlock for access to all 172 flashcards in this deck.
Unlock Deck
k this deck
79
If the Central Reserve Bank of Peru (the Peruvian central bank) were to take steps to devalue the sol (the Peruvian currency) in foreign currency markets, the Peruvian aggregate demand curve would ______in the short run, and the Peruvian short-run aggregate supply curve would ____in the long run.
A) not change; not change
B) not change; shift leftward
C) shift rightward; not change
D) shift rightward; shift leftward
E) shift leftward; shift rightward
A) not change; not change
B) not change; shift leftward
C) shift rightward; not change
D) shift rightward; shift leftward
E) shift leftward; shift rightward
Unlock Deck
Unlock for access to all 172 flashcards in this deck.
Unlock Deck
k this deck
80
Pegged exchange rates can also be referred to as ____exchange rates.
A) variable
B) fixed
C) flexible
D) specialized
E) nominal
A) variable
B) fixed
C) flexible
D) specialized
E) nominal
Unlock Deck
Unlock for access to all 172 flashcards in this deck.
Unlock Deck
k this deck
Unlock Deck
Unlock for access to all 172 flashcards in this deck.


