Deck 16: Asking and Answering Questions About More Than Two Means
Full screen (f)
Question
A course work of a student is dedicated to the investigation of sleep. To begin with, it is important to establish whether there is a difference in the average duration of sleep for people of different age groups. For this purpose the student considers several random samples to study four age groups. 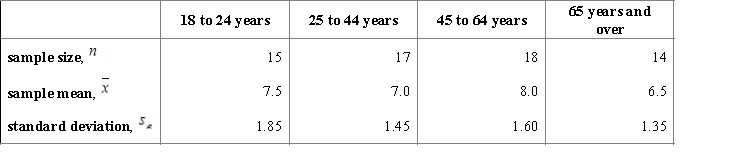 Carry out an ANOVA test and find the F and P values.
A) ,
,  ,
,  , and P-value is between 0.05 and 0.10.
B) ,
,  ,
,  , and P-value is between 0.025 and 0.05.
C) ,
,  ,
,  , and P-value is less than 0.01.
D) ,
,  ,
,  , and P-value is less than 0.01.
Carry out an ANOVA test and find the F and P values.A)
, , , and P-value is between 0.05 and 0.10.B)
, , , and P-value is between 0.025 and 0.05.C)
, , , and P-value is less than 0.01.D)
, , , and P-value is less than 0.01. Question
When issuing a textbook, there is always a number of defective copies. The publishing house conducts a study to determine whether the number of defective copies depends on the format of the textbook. For the study, three random samples of textbook editions for the different book sizes were generated: a large portrait, a portrait, and a US letter, each of is the editions has approximately equal number of copies. The number of defective copies for each edition is indicated in the table below. 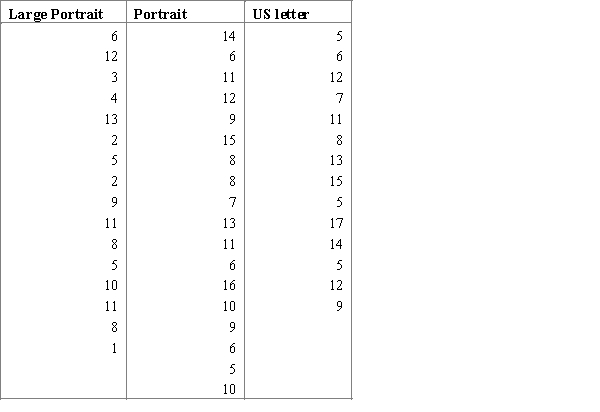 Carry out an ANOVA F test and interpret the results using the 95% confidence level.
A) ,
,  ,
,  , and p-value is less than 0.05.We reject the null hypothesis and can conclude that the average number of defective copies is not the same for the different textbook formats.
B) ,
,  ,
,  , and p-value is greater than 0.05.We don't reject the null hypothesis and can conclude that the average number of defective copies is the same for the different textbook formats.
C) ,
,  ,
,  , and p-value is less than 0.05.We reject the null hypothesis and can conclude that the average number of defective copies is not the same for the different textbook formats.
D) ,
,  ,
,  , and p-value is greater than 0.05.We don't reject the null hypothesis and can conclude that the average number of defective copies is the same for the different textbook formats.
Carry out an ANOVA F test and interpret the results using the 95% confidence level.A)
, , , and p-value is less than 0.05.We reject the null hypothesis and can conclude that the average number of defective copies is not the same for the different textbook formats.B)
, , , and p-value is greater than 0.05.We don't reject the null hypothesis and can conclude that the average number of defective copies is the same for the different textbook formats.C)
, , , and p-value is less than 0.05.We reject the null hypothesis and can conclude that the average number of defective copies is not the same for the different textbook formats.D)
, , , and p-value is greater than 0.05.We don't reject the null hypothesis and can conclude that the average number of defective copies is the same for the different textbook formats. Question
A researcher wants to know if people of different age groups spend the same time on purchasing goods and services. The researcher considers four age groups and conducts a survey using random sample for each of these groups. Each person answered the question, how many hours, on average, he or she usually spends on purchasing goods and services during a week. The results are represented in the table below. 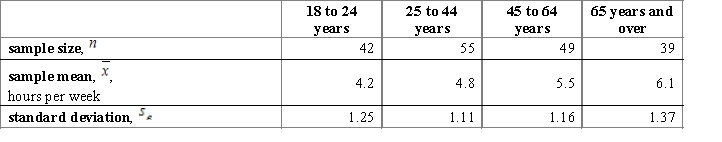 Chose the correct null and alternative hypotheses statements.
A)The null hypothesis is , and the alternative is Hα: at least two of μ's are different.
B)The null hypothesis is , and the alternative is Hα: all μ are equal.
C)The null hypothesis is ,
,  ,
,  ,
,  , and the alternative is Hα: all μ are equal.
D)The null hypothesis is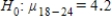 ,
,  ,
,  ,
,  , and the alternative is
  ,
,  .
.
Chose the correct null and alternative hypotheses statements.
A)The null hypothesis is
, and the alternative is Hα: at least two of μ's are different.B)The null hypothesis is
, and the alternative is Hα: all μ are equal.C)The null hypothesis is
, , , , and the alternative is Hα: all μ are equal.D)The null hypothesis is
, , , , and the alternative is , . Question
The two main human blood group systems are the ABO and Rhesus (Rh) systems. According to the information of the American Red Cross ( "https://www.redcrossblood.org"), Rhesus Negative blood type is more rare than Rhesus Positive. A Researcher wants to know if the proportion of people with Rh (-) is equal for each ABO human blood type. To exclude the spread of people through the different ABO types, the researcher generates 10 random samples of equal size (100 people) for each of the ABO types, and draws attention to the number of people with RhD(-).The summary results of the blood test are represented in the table below. 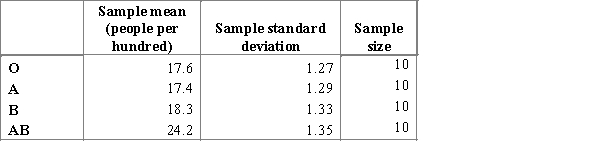 Chose the correct null and alternative hypotheses statements for the F-test.
A)The null hypothesis is , and the alternative is Hα:all p are equal.
B)The null hypothesis is , and the alternative is Hα: all μ are equal.
C)The null hypothesis is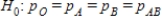 , and the alternative is Hα: at least two of p's are different.
D)The null hypothesis is , and the alternative is Hα: at least two of μ's are different.
Chose the correct null and alternative hypotheses statements for the F-test.A)The null hypothesis is
, and the alternative is Hα:all p are equal.B)The null hypothesis is
, and the alternative is Hα: all μ are equal.C)The null hypothesis is
, and the alternative is Hα: at least two of p's are different.D)The null hypothesis is
, and the alternative is Hα: at least two of μ's are different. Question
A researcher wants to know if people of different age groups spend the same time on purchasing goods and services. The researcher considers four age groups and conducts a survey using a random sample for each of these groups. Each person in the samples answers the question about how many hours does he or she spend per week on average on purchasing goods and services. The results are represented in the table below. 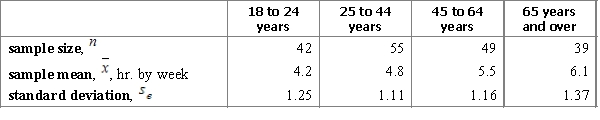 Carry out an ANOVA F-test and interpret the results using the 95% confidence level.
A) ,
,  ,
,  , and p-value is very close to 0.We accept the null hypothesis and can conclude that time spending on purchasing goods and services is the same for all age groups.
B) ,
,  ,
,  , and p-value is very close to 0.We reject the null hypothesis and can conclude that time spending on purchasing goods and services is not the same for all age groups.
C) ,
,  ,
,  , and p-value is less than 0.05.We accept the null hypothesis and can conclude that time spending on purchasing goods and services is the same for all age groups.
D) ,
,  ,
,  , and p-value is greater than 0.05.We reject the null hypothesis and can conclude that time spending on purchasing goods and services is not the same for all age groups.
Carry out an ANOVA F-test and interpret the results using the 95% confidence level.A)
, , , and p-value is very close to 0.We accept the null hypothesis and can conclude that time spending on purchasing goods and services is the same for all age groups.B)
, , , and p-value is very close to 0.We reject the null hypothesis and can conclude that time spending on purchasing goods and services is not the same for all age groups.C)
, , , and p-value is less than 0.05.We accept the null hypothesis and can conclude that time spending on purchasing goods and services is the same for all age groups.D)
, , , and p-value is greater than 0.05.We reject the null hypothesis and can conclude that time spending on purchasing goods and services is not the same for all age groups. Question
At a large construction website, a construction service company has four teams that carry out facing works. The management of the company has decided to find out whether they work at the same speed or not. For each team, a sample of several typical pieces of work was generated and the number of days spent on its implementation was analyzed. Data for this analysis are presented below. 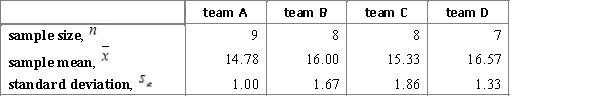 Carry out an ANOVA F-test and interpret the results using the 95% confidence level.
A) ,
,  ,
,  , and p-value is greater than 0.10.We reject the null hypothesis and can conclude that the implementing time differs for the teams.
B) ,
,  ,
,  , and p-value is less than 0.05.We don't reject the null hypothesis and cannot conclude that the implementing time differs for the teams.
C) ,
,  ,
,  , and p-value is less than 0.05.We reject the null hypothesis and can conclude that the implementing time differs for the teams.
D) ,
,  ,
,  , and p-value is greater than 0.10.We don't reject the null hypothesis and cannot conclude that the implementing time differs for the teams.
Carry out an ANOVA F-test and interpret the results using the 95% confidence level.
A)
, , , and p-value is greater than 0.10.We reject the null hypothesis and can conclude that the implementing time differs for the teams.B)
, , , and p-value is less than 0.05.We don't reject the null hypothesis and cannot conclude that the implementing time differs for the teams.C)
, , , and p-value is less than 0.05.We reject the null hypothesis and can conclude that the implementing time differs for the teams.D)
, , , and p-value is greater than 0.10.We don't reject the null hypothesis and cannot conclude that the implementing time differs for the teams. Question
Question
The two main human blood group systems are the ABO and Rhesus (Rh) systems. According to the information of the American Red Cross ("https://www.redcrossblood.org" ), Rhesus Negative blood type is more rare than Rhesus Positive. A researcher wants to find out if the proportion of people with Rh(-) is equal for each ABO human blood type. The researcher consequently generates 10 random samples of equal size (100 people) four times, and pays attention to the number of people with RhD(-)The results of the blood test are represented in the table below.  The researcher notices that the sample means (people per hundred) are very different and he cannot use the null hypothesis
  . What did the researcher do wrong that he got the data unsuitable for the F-test? Choose the correct statement. What should the researcher do to make it possible to apply the F-test for the study?
A)He should change the null hypothesis to and carry out an ANOVA F-test.
B)He should take more people to the study, since the distributions of ABO group types are not normal.
C)The distribution of people in the ABO types is not normal, and we cannot use the F-test for this distribution.
D)He should generate independent random samples of equal size for each type of ABO blood to avoid the influence of the ABO blood types distribution.
The researcher notices that the sample means (people per hundred) are very different and he cannot use the null hypothesis . What did the researcher do wrong that he got the data unsuitable for the F-test? Choose the correct statement. What should the researcher do to make it possible to apply the F-test for the study?A)He should change the null hypothesis to
and carry out an ANOVA F-test.B)He should take more people to the study, since the distributions of ABO group types are not normal.
C)The distribution of people in the ABO types is not normal, and we cannot use the F-test for this distribution.
D)He should generate independent random samples of equal size for each type of ABO blood to avoid the influence of the ABO blood types distribution.
Question
Question
A researcher wants to find out if the best sprinters of the planet improve the racing time at world championships in the 100 meters running discipline among men. He considers the results of the final racings of the last three world championships and compares the average time in each final racing. These data are represented in the table below ("https://www.iaaf.org/results/iaaf-world-championships-in-athletics"). 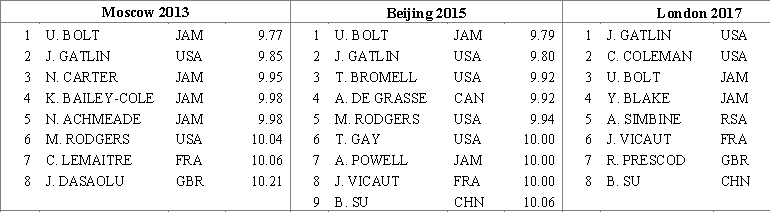
Chose the correct null and alternative hypotheses statements.
A)The null hypothesis is , and the alternative is
  : at least two of p's are different.
B)The null hypothesis is , and the alternative is
  : all μ are equal.
C)The null hypothesis is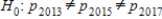 , and the alternative is
  : all p are equal.
D)The null hypothesis is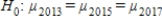 , and the alternative is
  : at least two of μ's are different.
Chose the correct null and alternative hypotheses statements.
A)The null hypothesis is
, and the alternative is : at least two of p's are different.B)The null hypothesis is
, and the alternative is : all μ are equal.C)The null hypothesis is
, and the alternative is : all p are equal.D)The null hypothesis is
, and the alternative is : at least two of μ's are different. Question
Before releasing a new product, a small company wants to compare the prices in the market for similar products from other brands presented in the same field. To do this, research has been conducted, and information has been collected for three similar brands. The information is presented in the table below. 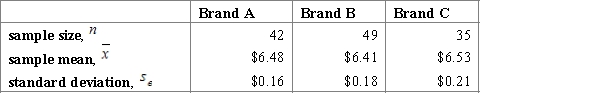 Carry out an ANOVA test and find the F and P values.
A) ,
,  ,
,  , and P-value is less than 0.01.
B) ,
,  ,
,  , and P-value is greater than 0.10.
C) ,
,  ,
,  , and P-value is slightly greater than 0.01.
D) ,
,  ,
,  , and P-value is greater than 0.10.
Carry out an ANOVA test and find the F and P values.A)
, , , and P-value is less than 0.01.B)
, , , and P-value is greater than 0.10.C)
, , , and P-value is slightly greater than 0.01.D)
, , , and P-value is greater than 0.10. Question
Meteorologists study the climate of Texas. Using the data from the website ("http://www.usclimatedata.com") they estimate the average precipitation in inches for three cities: Austin, Houston and San Antonio. Using a multiple comparison procedure the meteorologists identify the differences between the average precipitation level, in inches per month, for the considered three cities, and construct the Tukey-Kramer confidence interval for 95% Studentized range critical value.  Help the meteorologists to draw a correct conclusion about the differences between the average precipitation levels in these cities.
A) (Austin and San Antonio), and
  (Houston) differs from
  and
and  .
.
B) (Austin and Houston), and
  (San Antonio) differs from
  and
and  .
.
C) (Houston and San Antonio), and
  (Austin) differs from
  and
and  .
.
D)All three μ's are different
Help the meteorologists to draw a correct conclusion about the differences between the average precipitation levels in these cities.A)
(Austin and San Antonio), and (Houston) differs from and .B)
(Austin and Houston), and (San Antonio) differs from and .C)
(Houston and San Antonio), and (Austin) differs from and .D)All three μ's are different
Question
A course work of a student is dedicated to the investigation of sleep. To begin with, it is important to establish whether there is a difference in the average duration of sleep for people of different age groups. For this purpose, the student considers several random samples to study four age groups.  Using a multiple comparison procedure identify differences between mean durations of sleep for considered age groups. Use 95% Tukey-Kramer confidence interval.
A)Using the 95% Studentized range critical value , we can calculate the CI:
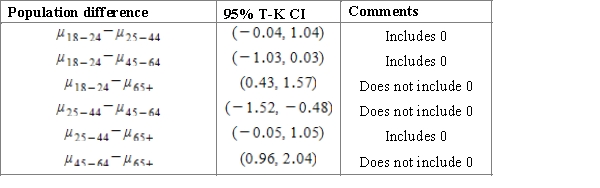
B)Using the 95% Studentized range critical value , we can calculate the CI:
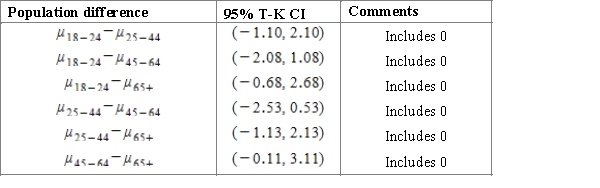
C)Using the 95% Studentized range critical value , we can calculate the CI:
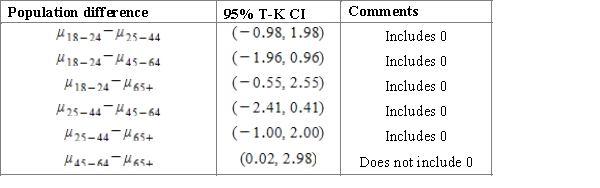
D)Using the 95% Studentized range critical value , we can calculate the CI:
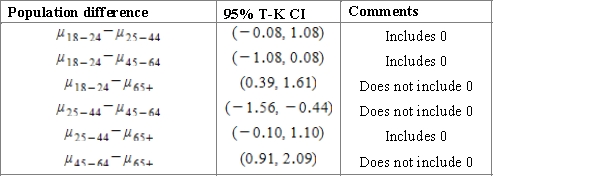
E)Using the 95% Studentized range critical value , we can calculate the CI:
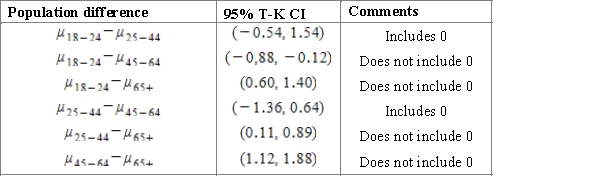
Using a multiple comparison procedure identify differences between mean durations of sleep for considered age groups. Use 95% Tukey-Kramer confidence interval.A)Using the 95% Studentized range critical value
, we can calculate the CI: B)Using the 95% Studentized range critical value
, we can calculate the CI: C)Using the 95% Studentized range critical value
, we can calculate the CI: D)Using the 95% Studentized range critical value
, we can calculate the CI: E)Using the 95% Studentized range critical value
, we can calculate the CI: Question
Professor wants to know whether her students have equally absorbed the themes of the learning term. During the term she conducted three in-class tests. The average scores of students were 71.8, 81.5 and 75.8 (with maximum of 100 points). Using the information above answer the question how should the professor define the difference between the three average in-class test scores.
A)Professor should set the null hypothesis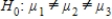 and conduct an F test.
B)Professor should set the null hypothesis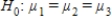 and conduct an F test.
C)Professor should set the null hypothesis and conduct an F test.
D)Professor should set the null hypothesis and conduct an F test.
A)Professor should set the null hypothesis
and conduct an F test.B)Professor should set the null hypothesis
and conduct an F test.C)Professor should set the null hypothesis
and conduct an F test.D)Professor should set the null hypothesis
and conduct an F test. Question
A researcher wants to find out if the best sprinters of the planet improve the racing time at world championships in the 100 meters running discipline among men. He considers the results of the final racings of the last three world championships and compares the average time in each final racing. These data are represented in the table below ("https://www.iaaf.org/results/iaaf-world-championships-in-athletics"). 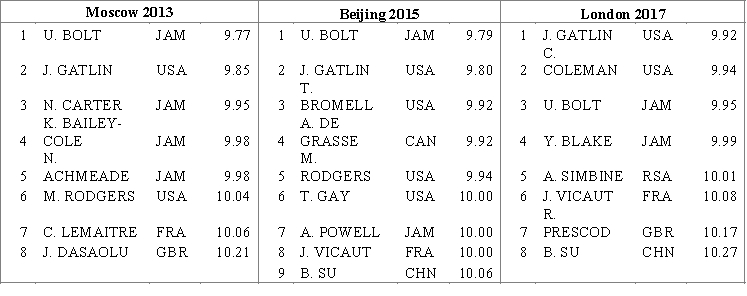
Carry out an ANOVA test and find the F and P values.
A) ,
,  ,
,  , and P-value slightly greater than 0.05.
B) ,
,  ,
,  , and P-value is greater than 0.10.
C) ,
,  ,
,  , and P-value slightly smaller than 0.05.
D) ,
,  ,
,  , and P-value is greater than 0.10.
Carry out an ANOVA test and find the F and P values.
A)
, , , and P-value slightly greater than 0.05.B)
, , , and P-value is greater than 0.10.C)
, , , and P-value slightly smaller than 0.05.D)
, , , and P-value is greater than 0.10. Question
Meteorologists study the climate of Texas. Using the data from the website ("http://www.usclimatedata.com" ), they estimate the average precipitation in inches for three cities: Austin, Dallas and San Antonio. The table below represents the summary data for the study. 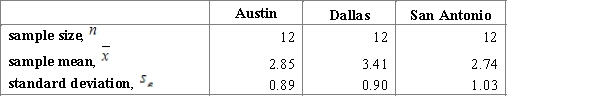 Using a multiple comparison procedure identify differences between average precipitation for considered age cities. Use 95% Tukey-Kramer confidence interval.
A)We used and obtained following table.
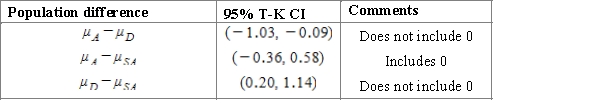
B)We used and obtained following table.
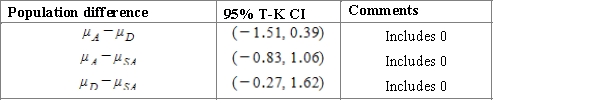
C)We used and obtained following table.
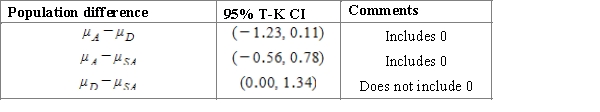
D)We used and obtained following table.
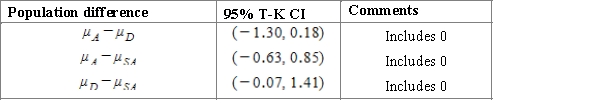
E)We used and obtained following table.
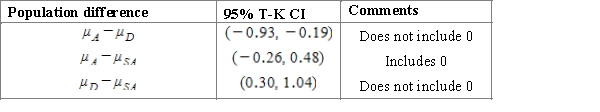
Using a multiple comparison procedure identify differences between average precipitation for considered age cities. Use 95% Tukey-Kramer confidence interval.A)We used
and obtained following table. B)We used
and obtained following table. C)We used
and obtained following table. D)We used
and obtained following table. E)We used
and obtained following table. Question
A company has three branches, A, B, and C, located in different cities. Management of the company needs to estimate the efficiency of the work of each branch. The study considers the profit of each branch per a month (in million dollars) during the last year. Suppose that the samples are independent and have normal distributions. Results of the study are represented below. 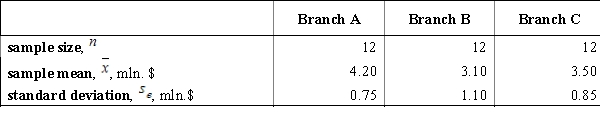 Carry out an ANOVA test and find the F and P values.
A) ,
,  ,
,  , and P-value is between 0.025 and 0.05.
B) ,
,  ,
,  , and P-value is between 0.05 and 0.10.
C) ,
,  ,
,  , and P-value is between 0.01 and 0.025.
D) ,
,  ,
,  , and P-value is less than 0.01.
Carry out an ANOVA test and find the F and P values.A)
, , , and P-value is between 0.025 and 0.05.B)
, , , and P-value is between 0.05 and 0.10.C)
, , , and P-value is between 0.01 and 0.025.D)
, , , and P-value is less than 0.01. Question
A market researcher wants to compare market prices for the same product made by several popular manufacturers. A random sample has been generated for the product of each manufactory. The information is presented in the table below. 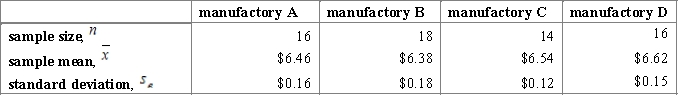 Carry out multiple comparison procedure and interpret the results using 95% Tukey-Kramer confidence interval.
A)The mean prices for the manufactories A and B differ from the prices for the manufactories C and D.
B)The mean price for the manufactory B differs from the mean prices for the manufactories C and D, the mean price for the manufactory A differs from the mean price for the manufactory D.
C)The mean price for the manufactory B differs from the mean prices for the manufactories C and D.
D)The mean price for the manufactory B differs from the mean price for the manufactory D.
Carry out multiple comparison procedure and interpret the results using 95% Tukey-Kramer confidence interval.A)The mean prices for the manufactories A and B differ from the prices for the manufactories C and D.
B)The mean price for the manufactory B differs from the mean prices for the manufactories C and D, the mean price for the manufactory A differs from the mean price for the manufactory D.
C)The mean price for the manufactory B differs from the mean prices for the manufactories C and D.
D)The mean price for the manufactory B differs from the mean price for the manufactory D.
Question
Question
Professor is interested if the average scores of her students in the math class are equal during the learning term or not. She considers the scores of her students for three in-class tests, end-of-course exam and the final score. The final score is calculated by the following formula:  .
. 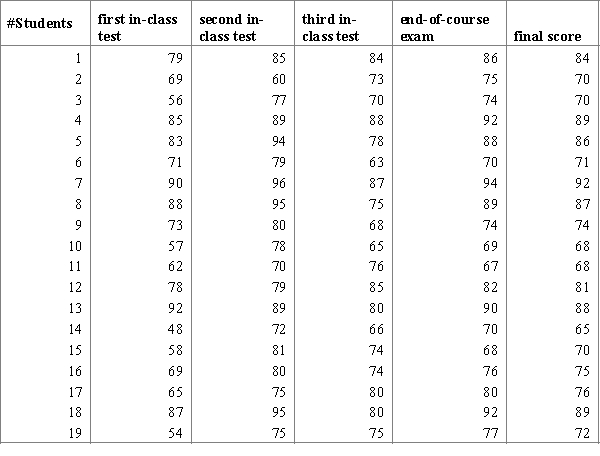 Is it possible for the professor to carry out an ANOVA F-test using all five sample treatments? Choose the correct statement.
A)The final score depends on the other variables, so she cannot carry out an ANOVA F-test for these samples.
B)The sample standard error for first in-class test is significantly greater than the standard error for the other samples, so she cannot carry out an ANOVA F-test for these samples.
C)The sample distributions are not normal, so she cannot carry out an ANOVA F-test for these samples.
D)She can carry out an ANOVA F-test for these samples.
. Is it possible for the professor to carry out an ANOVA F-test using all five sample treatments? Choose the correct statement.A)The final score depends on the other variables, so she cannot carry out an ANOVA F-test for these samples.
B)The sample standard error for first in-class test is significantly greater than the standard error for the other samples, so she cannot carry out an ANOVA F-test for these samples.
C)The sample distributions are not normal, so she cannot carry out an ANOVA F-test for these samples.
D)She can carry out an ANOVA F-test for these samples.
Question
When issuing a textbook, there is always a number of defective copies. The publishing house conducts a study to determine whether the number of defective copies depends on the format of the textbook. For the study, three random samples of textbook editions for the different book sizes were generated: a large portrait, a portrait, and a US letter, each of the editions has approximately equal number of copies. Twenty-one textbooks of each format were used for the study. Table containing summary data is presented below. 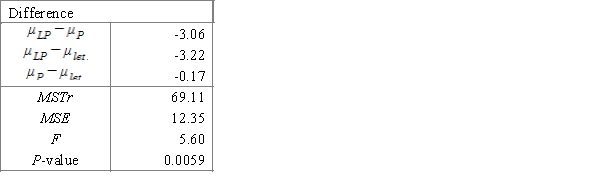 Using a multiple comparison procedure identify differences between average number of defective copies. Use 95% Tukey-Kramer confidence interval.
A)We used and obtained following table.
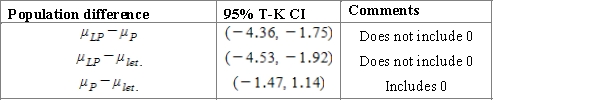
B)We used and obtained following table.
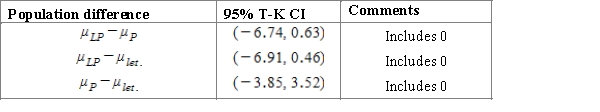
C)We used and obtained following table.
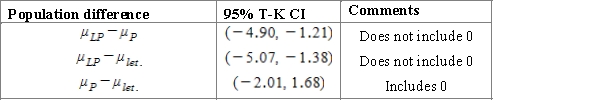
D)We used and obtained following table.
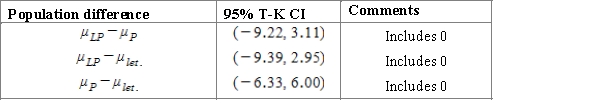
E)We used and obtained following table.
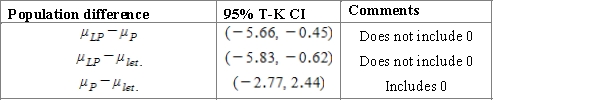
Using a multiple comparison procedure identify differences between average number of defective copies. Use 95% Tukey-Kramer confidence interval. A)We used
and obtained following table. B)We used
and obtained following table. C)We used
and obtained following table. D)We used
and obtained following table. E)We used
and obtained following table. Question
Researcher investigates the average life expectancy of Americans by their ethnicity. He generates four random samples for each of the major ethnicity groups: White, African-American, Hispanic and Asian-American. The table below represents the summary data for the study. 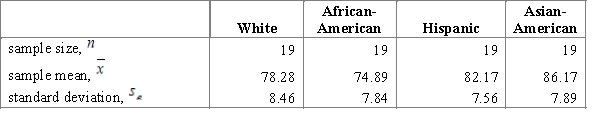 Using a multiple comparison procedure identify differences between average precipitation for considered age cities. Use 95% Tukey-Kramer confidence interval.
A)We used and obtained the following table.
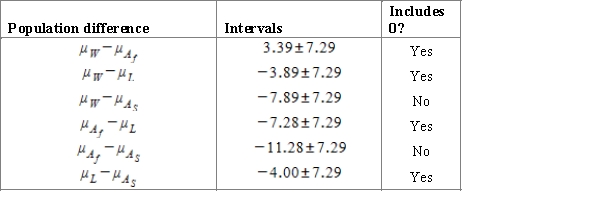
B)We used and obtained the following table.
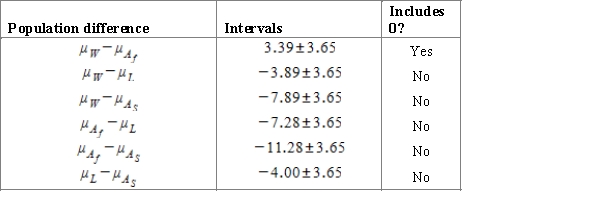
C)We used and obtained the following table.
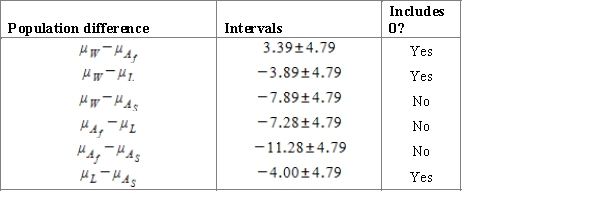
D)We used and obtained the following table.
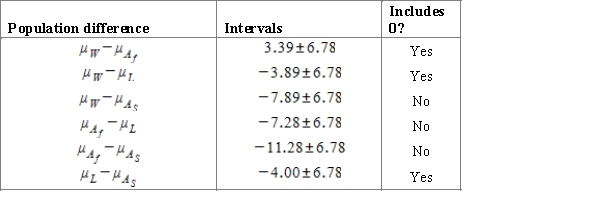
E)We used and obtained the following table.
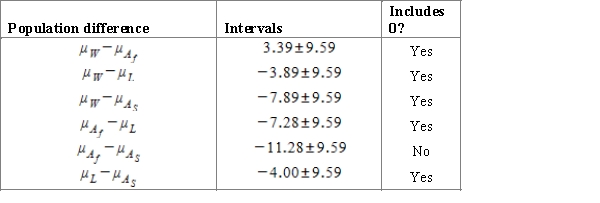
Using a multiple comparison procedure identify differences between average precipitation for considered age cities. Use 95% Tukey-Kramer confidence interval.A)We used
and obtained the following table. B)We used
and obtained the following table. C)We used
and obtained the following table. D)We used
and obtained the following table. E)We used
and obtained the following table. Question
A company manufacturing details for the large machinery updates its milling machines. When at the first factory all the milling machines were replaced with the new ones, it was decided to conduct a study in order to define whether the average production time of one detail had decreased. For this purpose, at each of the company's factories (note that Factory A has only new milling machines and three other factories have both old and new milling machines), a sample determining the average production time of one detail had been generated. The result of this study is shown on the following underscoring pattern. 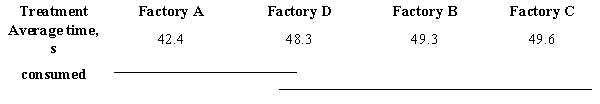 Interpret this underscoring pattern.
A)Average time of making one detail for the factories A and D differ from the average time for the factories B and C.
B)Average time of making one detail for all the factories is the same.
C)Average time of making one detail for the factory A differs from the average time for the factories B, C and D.
D)Average time of making one detail for the factory A differs from the average time for the factories B and C, and other three factories have equal average time.
Interpret this underscoring pattern.A)Average time of making one detail for the factories A and D differ from the average time for the factories B and C.
B)Average time of making one detail for all the factories is the same.
C)Average time of making one detail for the factory A differs from the average time for the factories B, C and D.
D)Average time of making one detail for the factory A differs from the average time for the factories B and C, and other three factories have equal average time.
Question
A technical support call center works every day, including weekends and public holidays. In order to test the expediency of working in weekends and public holidays, it is necessary to compare the intensity of calls coming to the call center within one working hour on a working day, on a weekend and on a public holiday. Three random samples of the numbers of calls received during an hour for working days, weekends and holidays were randomly generated. These samples can be considered representative for the population. The summary data are presented below. 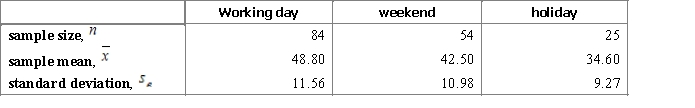 Carry out an ANOVA F test and interpret the results using the 95% confidence level.
A) ,
,  ,
,  , and P-value is less than 0.05.We reject the null hypothesis and can conclude that the average number of calls is not the same for different types of days.
B) ,
,  ,
,  , and P-value is greater than 0.05.We do not reject the null hypothesis and can conclude that the average number of calls is the same for different types of days.
C) ,
,  ,
,  , and P-value is less than 0.05.We reject the null hypothesis and can conclude that the average number of calls is not the same for different types of days.
D) ,
,  ,
,  , and P-value is greater than 0.05.We do not reject the null hypothesis and can conclude that the average number of calls is the same for different types of days.
Carry out an ANOVA F test and interpret the results using the 95% confidence level.
A)
, , , and P-value is less than 0.05.We reject the null hypothesis and can conclude that the average number of calls is not the same for different types of days.B)
, , , and P-value is greater than 0.05.We do not reject the null hypothesis and can conclude that the average number of calls is the same for different types of days.C)
, , , and P-value is less than 0.05.We reject the null hypothesis and can conclude that the average number of calls is not the same for different types of days.D)
, , , and P-value is greater than 0.05.We do not reject the null hypothesis and can conclude that the average number of calls is the same for different types of days. Question
Below are the input data for four F-tests. Choose a situation where the application of the F-test is most justified.
A)Comparing three samples: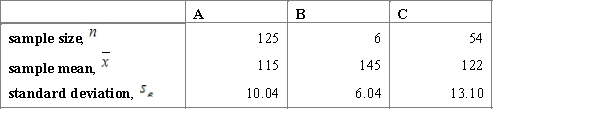
B)Comparing five samples: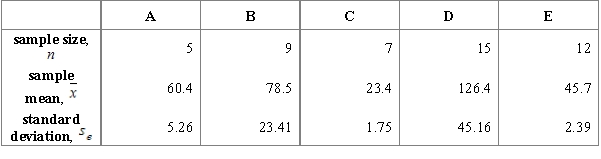
C)Comparing three samples: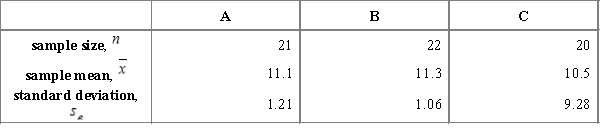
D)Comparing three samples: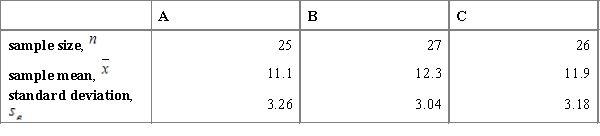
A)Comparing three samples:
B)Comparing five samples:
C)Comparing three samples:
D)Comparing three samples:

Unlock Deck
Sign up to unlock the cards in this deck!
Unlock Deck
Unlock Deck
1/25
Play
Full screen (f)
Deck 16: Asking and Answering Questions About More Than Two Means
1
A course work of a student is dedicated to the investigation of sleep. To begin with, it is important to establish whether there is a difference in the average duration of sleep for people of different age groups. For this purpose the student considers several random samples to study four age groups. Carry out an ANOVA test and find the F and P values.
A) , , , and P-value is between 0.05 and 0.10.
B) , , , and P-value is between 0.025 and 0.05.
C) , , , and P-value is less than 0.01.
D) , , , and P-value is less than 0.01.
Carry out an ANOVA test and find the F and P values.A)
, , , and P-value is between 0.05 and 0.10.B)
, , , and P-value is between 0.025 and 0.05.C)
, , , and P-value is less than 0.01.D)
, , , and P-value is less than 0.01. , , , and P-value is between 0.05 and 0.10. 2
When issuing a textbook, there is always a number of defective copies. The publishing house conducts a study to determine whether the number of defective copies depends on the format of the textbook. For the study, three random samples of textbook editions for the different book sizes were generated: a large portrait, a portrait, and a US letter, each of is the editions has approximately equal number of copies. The number of defective copies for each edition is indicated in the table below. Carry out an ANOVA F test and interpret the results using the 95% confidence level.
A) , , , and p-value is less than 0.05.We reject the null hypothesis and can conclude that the average number of defective copies is not the same for the different textbook formats.
B) , , , and p-value is greater than 0.05.We don't reject the null hypothesis and can conclude that the average number of defective copies is the same for the different textbook formats.
C) , , , and p-value is less than 0.05.We reject the null hypothesis and can conclude that the average number of defective copies is not the same for the different textbook formats.
D) , , , and p-value is greater than 0.05.We don't reject the null hypothesis and can conclude that the average number of defective copies is the same for the different textbook formats.
Carry out an ANOVA F test and interpret the results using the 95% confidence level.A)
, , , and p-value is less than 0.05.We reject the null hypothesis and can conclude that the average number of defective copies is not the same for the different textbook formats.B)
, , , and p-value is greater than 0.05.We don't reject the null hypothesis and can conclude that the average number of defective copies is the same for the different textbook formats.C)
, , , and p-value is less than 0.05.We reject the null hypothesis and can conclude that the average number of defective copies is not the same for the different textbook formats.D)
, , , and p-value is greater than 0.05.We don't reject the null hypothesis and can conclude that the average number of defective copies is the same for the different textbook formats. , , , and p-value is less than 0.05.We reject the null hypothesis and can conclude that the average number of defective copies is not the same for the different textbook formats. 3
A researcher wants to know if people of different age groups spend the same time on purchasing goods and services. The researcher considers four age groups and conducts a survey using random sample for each of these groups. Each person answered the question, how many hours, on average, he or she usually spends on purchasing goods and services during a week. The results are represented in the table below. Chose the correct null and alternative hypotheses statements.
A)The null hypothesis is , and the alternative is Hα: at least two of μ's are different.
B)The null hypothesis is , and the alternative is Hα: all μ are equal.
C)The null hypothesis is , , , , and the alternative is Hα: all μ are equal.
D)The null hypothesis is , , , , and the alternative is , .
Chose the correct null and alternative hypotheses statements.
A)The null hypothesis is
, and the alternative is Hα: at least two of μ's are different.B)The null hypothesis is
, and the alternative is Hα: all μ are equal.C)The null hypothesis is
, , , , and the alternative is Hα: all μ are equal.D)The null hypothesis is
, , , , and the alternative is , .The null hypothesis is , and the alternative is Hα: at least two of μ's are different.
, and the alternative is Hα: at least two of μ's are different. 4
The two main human blood group systems are the ABO and Rhesus (Rh) systems. According to the information of the American Red Cross ( "https://www.redcrossblood.org"), Rhesus Negative blood type is more rare than Rhesus Positive. A Researcher wants to know if the proportion of people with Rh (-) is equal for each ABO human blood type. To exclude the spread of people through the different ABO types, the researcher generates 10 random samples of equal size (100 people) for each of the ABO types, and draws attention to the number of people with RhD(-).The summary results of the blood test are represented in the table below. Chose the correct null and alternative hypotheses statements for the F-test.
A)The null hypothesis is , and the alternative is Hα:all p are equal.
B)The null hypothesis is , and the alternative is Hα: all μ are equal.
C)The null hypothesis is , and the alternative is Hα: at least two of p's are different.
D)The null hypothesis is , and the alternative is Hα: at least two of μ's are different.
Chose the correct null and alternative hypotheses statements for the F-test.A)The null hypothesis is
, and the alternative is Hα:all p are equal.B)The null hypothesis is
, and the alternative is Hα: all μ are equal.C)The null hypothesis is
, and the alternative is Hα: at least two of p's are different.D)The null hypothesis is
, and the alternative is Hα: at least two of μ's are different. Unlock Deck
Unlock for access to all 25 flashcards in this deck.
Unlock Deck
k this deck
5
A researcher wants to know if people of different age groups spend the same time on purchasing goods and services. The researcher considers four age groups and conducts a survey using a random sample for each of these groups. Each person in the samples answers the question about how many hours does he or she spend per week on average on purchasing goods and services. The results are represented in the table below. Carry out an ANOVA F-test and interpret the results using the 95% confidence level.
A) , , , and p-value is very close to 0.We accept the null hypothesis and can conclude that time spending on purchasing goods and services is the same for all age groups.
B) , , , and p-value is very close to 0.We reject the null hypothesis and can conclude that time spending on purchasing goods and services is not the same for all age groups.
C) , , , and p-value is less than 0.05.We accept the null hypothesis and can conclude that time spending on purchasing goods and services is the same for all age groups.
D) , , , and p-value is greater than 0.05.We reject the null hypothesis and can conclude that time spending on purchasing goods and services is not the same for all age groups.
Carry out an ANOVA F-test and interpret the results using the 95% confidence level.A)
, , , and p-value is very close to 0.We accept the null hypothesis and can conclude that time spending on purchasing goods and services is the same for all age groups.B)
, , , and p-value is very close to 0.We reject the null hypothesis and can conclude that time spending on purchasing goods and services is not the same for all age groups.C)
, , , and p-value is less than 0.05.We accept the null hypothesis and can conclude that time spending on purchasing goods and services is the same for all age groups.D)
, , , and p-value is greater than 0.05.We reject the null hypothesis and can conclude that time spending on purchasing goods and services is not the same for all age groups. Unlock Deck
Unlock for access to all 25 flashcards in this deck.
Unlock Deck
k this deck
6
At a large construction website, a construction service company has four teams that carry out facing works. The management of the company has decided to find out whether they work at the same speed or not. For each team, a sample of several typical pieces of work was generated and the number of days spent on its implementation was analyzed. Data for this analysis are presented below. Carry out an ANOVA F-test and interpret the results using the 95% confidence level.
A) , , , and p-value is greater than 0.10.We reject the null hypothesis and can conclude that the implementing time differs for the teams.
B) , , , and p-value is less than 0.05.We don't reject the null hypothesis and cannot conclude that the implementing time differs for the teams.
C) , , , and p-value is less than 0.05.We reject the null hypothesis and can conclude that the implementing time differs for the teams.
D) , , , and p-value is greater than 0.10.We don't reject the null hypothesis and cannot conclude that the implementing time differs for the teams.
Carry out an ANOVA F-test and interpret the results using the 95% confidence level.
A)
, , , and p-value is greater than 0.10.We reject the null hypothesis and can conclude that the implementing time differs for the teams.B)
, , , and p-value is less than 0.05.We don't reject the null hypothesis and cannot conclude that the implementing time differs for the teams.C)
, , , and p-value is less than 0.05.We reject the null hypothesis and can conclude that the implementing time differs for the teams.D)
, , , and p-value is greater than 0.10.We don't reject the null hypothesis and cannot conclude that the implementing time differs for the teams. Unlock Deck
Unlock for access to all 25 flashcards in this deck.
Unlock Deck
k this deck
7
A recruitment agency provides a study of the average amount of time people work in IT companies. Four companies were considered for the study: big old company A, big new company B, small old company C and small new company D. In this study, a company is considered as new if it has been founded less than 20 years ago and considered as old if has been founded more than 50 years; small company has about 200 employees and big company has more than 1,000 employees. Is it correct to conduct an F-test for these four companies? Choose the correct statement.
A)For new companies, distribution of the amount of time people workthere is not normal because the population is very small.We cannot use F-test.
B)If you generate the random sample of equal size for each company, then all conditions for applying the F-test will be met.We can use F-test.
C)For new companies, distribution of the amount of time people work there is limited by the age of the company and therefore certainly has smaller standard deviation.We cannot use F-test.
D)Big companies will have large samples and therefore the samples will be dependent.We cannot use F-test.
Unlock Deck
Unlock for access to all 25 flashcards in this deck.
Unlock Deck
k this deck
8
The two main human blood group systems are the ABO and Rhesus (Rh) systems. According to the information of the American Red Cross ("https://www.redcrossblood.org" ), Rhesus Negative blood type is more rare than Rhesus Positive. A researcher wants to find out if the proportion of people with Rh(-) is equal for each ABO human blood type. The researcher consequently generates 10 random samples of equal size (100 people) four times, and pays attention to the number of people with RhD(-)The results of the blood test are represented in the table below. The researcher notices that the sample means (people per hundred) are very different and he cannot use the null hypothesis . What did the researcher do wrong that he got the data unsuitable for the F-test? Choose the correct statement. What should the researcher do to make it possible to apply the F-test for the study?
A)He should change the null hypothesis to and carry out an ANOVA F-test.
B)He should take more people to the study, since the distributions of ABO group types are not normal.
C)The distribution of people in the ABO types is not normal, and we cannot use the F-test for this distribution.
D)He should generate independent random samples of equal size for each type of ABO blood to avoid the influence of the ABO blood types distribution.
The researcher notices that the sample means (people per hundred) are very different and he cannot use the null hypothesis . What did the researcher do wrong that he got the data unsuitable for the F-test? Choose the correct statement. What should the researcher do to make it possible to apply the F-test for the study?A)He should change the null hypothesis to
and carry out an ANOVA F-test.B)He should take more people to the study, since the distributions of ABO group types are not normal.
C)The distribution of people in the ABO types is not normal, and we cannot use the F-test for this distribution.
D)He should generate independent random samples of equal size for each type of ABO blood to avoid the influence of the ABO blood types distribution.
Unlock Deck
Unlock for access to all 25 flashcards in this deck.
Unlock Deck
k this deck
9
A graduate student of the college conducted the following research. She considered four consulting companies and selected 13-15 approximately similar vacancies in each of these companies, which were posted on the official websites during the last year. The student was interested in the information about the wages indicated in the vacancies. Assume that you know that the student decided to conduct an F-test to compare the interested values, and draw the null hypothesis for this test in plain English.
A)The null hypothesis is that the average wages in all consulting companies for a position of interest are equal.
B)The null hypothesis is that the average wages in the four companies considered are equal.
C)The null hypothesis is that the average wages in the four samples of vacancies for a position of interest are equal.
D)The null hypothesis is that the average wages in the four companies considered for a position of interest are equal.
Unlock Deck
Unlock for access to all 25 flashcards in this deck.
Unlock Deck
k this deck
10
A researcher wants to find out if the best sprinters of the planet improve the racing time at world championships in the 100 meters running discipline among men. He considers the results of the final racings of the last three world championships and compares the average time in each final racing. These data are represented in the table below ("https://www.iaaf.org/results/iaaf-world-championships-in-athletics").
Chose the correct null and alternative hypotheses statements.
A)The null hypothesis is , and the alternative is : at least two of p's are different.
B)The null hypothesis is , and the alternative is : all μ are equal.
C)The null hypothesis is , and the alternative is : all p are equal.
D)The null hypothesis is , and the alternative is : at least two of μ's are different.
Chose the correct null and alternative hypotheses statements.
A)The null hypothesis is
, and the alternative is : at least two of p's are different.B)The null hypothesis is
, and the alternative is : all μ are equal.C)The null hypothesis is
, and the alternative is : all p are equal.D)The null hypothesis is
, and the alternative is : at least two of μ's are different. Unlock Deck
Unlock for access to all 25 flashcards in this deck.
Unlock Deck
k this deck
11
Before releasing a new product, a small company wants to compare the prices in the market for similar products from other brands presented in the same field. To do this, research has been conducted, and information has been collected for three similar brands. The information is presented in the table below. Carry out an ANOVA test and find the F and P values.
A) , , , and P-value is less than 0.01.
B) , , , and P-value is greater than 0.10.
C) , , , and P-value is slightly greater than 0.01.
D) , , , and P-value is greater than 0.10.
Carry out an ANOVA test and find the F and P values.A)
, , , and P-value is less than 0.01.B)
, , , and P-value is greater than 0.10.C)
, , , and P-value is slightly greater than 0.01.D)
, , , and P-value is greater than 0.10. Unlock Deck
Unlock for access to all 25 flashcards in this deck.
Unlock Deck
k this deck
12
Meteorologists study the climate of Texas. Using the data from the website ("http://www.usclimatedata.com") they estimate the average precipitation in inches for three cities: Austin, Houston and San Antonio. Using a multiple comparison procedure the meteorologists identify the differences between the average precipitation level, in inches per month, for the considered three cities, and construct the Tukey-Kramer confidence interval for 95% Studentized range critical value. Help the meteorologists to draw a correct conclusion about the differences between the average precipitation levels in these cities.
A) (Austin and San Antonio), and (Houston) differs from and .
B) (Austin and Houston), and (San Antonio) differs from and .
C) (Houston and San Antonio), and (Austin) differs from and .
D)All three μ's are different
Help the meteorologists to draw a correct conclusion about the differences between the average precipitation levels in these cities.A)
(Austin and San Antonio), and (Houston) differs from and .B)
(Austin and Houston), and (San Antonio) differs from and .C)
(Houston and San Antonio), and (Austin) differs from and .D)All three μ's are different
Unlock Deck
Unlock for access to all 25 flashcards in this deck.
Unlock Deck
k this deck
13
A course work of a student is dedicated to the investigation of sleep. To begin with, it is important to establish whether there is a difference in the average duration of sleep for people of different age groups. For this purpose, the student considers several random samples to study four age groups. Using a multiple comparison procedure identify differences between mean durations of sleep for considered age groups. Use 95% Tukey-Kramer confidence interval.
A)Using the 95% Studentized range critical value , we can calculate the CI:
B)Using the 95% Studentized range critical value , we can calculate the CI:
C)Using the 95% Studentized range critical value , we can calculate the CI:
D)Using the 95% Studentized range critical value , we can calculate the CI:
E)Using the 95% Studentized range critical value , we can calculate the CI:
Using a multiple comparison procedure identify differences between mean durations of sleep for considered age groups. Use 95% Tukey-Kramer confidence interval.A)Using the 95% Studentized range critical value
, we can calculate the CI: B)Using the 95% Studentized range critical value
, we can calculate the CI: C)Using the 95% Studentized range critical value
, we can calculate the CI: D)Using the 95% Studentized range critical value
, we can calculate the CI: E)Using the 95% Studentized range critical value
, we can calculate the CI: Unlock Deck
Unlock for access to all 25 flashcards in this deck.
Unlock Deck
k this deck
14
Professor wants to know whether her students have equally absorbed the themes of the learning term. During the term she conducted three in-class tests. The average scores of students were 71.8, 81.5 and 75.8 (with maximum of 100 points). Using the information above answer the question how should the professor define the difference between the three average in-class test scores.
A)Professor should set the null hypothesis and conduct an F test.
B)Professor should set the null hypothesis and conduct an F test.
C)Professor should set the null hypothesis and conduct an F test.
D)Professor should set the null hypothesis and conduct an F test.
A)Professor should set the null hypothesis
and conduct an F test.B)Professor should set the null hypothesis
and conduct an F test.C)Professor should set the null hypothesis
and conduct an F test.D)Professor should set the null hypothesis
and conduct an F test. Unlock Deck
Unlock for access to all 25 flashcards in this deck.
Unlock Deck
k this deck
15
A researcher wants to find out if the best sprinters of the planet improve the racing time at world championships in the 100 meters running discipline among men. He considers the results of the final racings of the last three world championships and compares the average time in each final racing. These data are represented in the table below ("https://www.iaaf.org/results/iaaf-world-championships-in-athletics").
Carry out an ANOVA test and find the F and P values.
A) , , , and P-value slightly greater than 0.05.
B) , , , and P-value is greater than 0.10.
C) , , , and P-value slightly smaller than 0.05.
D) , , , and P-value is greater than 0.10.
Carry out an ANOVA test and find the F and P values.
A)
, , , and P-value slightly greater than 0.05.B)
, , , and P-value is greater than 0.10.C)
, , , and P-value slightly smaller than 0.05.D)
, , , and P-value is greater than 0.10. Unlock Deck
Unlock for access to all 25 flashcards in this deck.
Unlock Deck
k this deck
16
Meteorologists study the climate of Texas. Using the data from the website ("http://www.usclimatedata.com" ), they estimate the average precipitation in inches for three cities: Austin, Dallas and San Antonio. The table below represents the summary data for the study. Using a multiple comparison procedure identify differences between average precipitation for considered age cities. Use 95% Tukey-Kramer confidence interval.
A)We used and obtained following table.
B)We used and obtained following table.
C)We used and obtained following table.
D)We used and obtained following table.
E)We used and obtained following table.
Using a multiple comparison procedure identify differences between average precipitation for considered age cities. Use 95% Tukey-Kramer confidence interval.A)We used
and obtained following table. B)We used
and obtained following table. C)We used
and obtained following table. D)We used
and obtained following table. E)We used
and obtained following table. Unlock Deck
Unlock for access to all 25 flashcards in this deck.
Unlock Deck
k this deck
17
A company has three branches, A, B, and C, located in different cities. Management of the company needs to estimate the efficiency of the work of each branch. The study considers the profit of each branch per a month (in million dollars) during the last year. Suppose that the samples are independent and have normal distributions. Results of the study are represented below. Carry out an ANOVA test and find the F and P values.
A) , , , and P-value is between 0.025 and 0.05.
B) , , , and P-value is between 0.05 and 0.10.
C) , , , and P-value is between 0.01 and 0.025.
D) , , , and P-value is less than 0.01.
Carry out an ANOVA test and find the F and P values.A)
, , , and P-value is between 0.025 and 0.05.B)
, , , and P-value is between 0.05 and 0.10.C)
, , , and P-value is between 0.01 and 0.025.D)
, , , and P-value is less than 0.01. Unlock Deck
Unlock for access to all 25 flashcards in this deck.
Unlock Deck
k this deck
18
A market researcher wants to compare market prices for the same product made by several popular manufacturers. A random sample has been generated for the product of each manufactory. The information is presented in the table below. Carry out multiple comparison procedure and interpret the results using 95% Tukey-Kramer confidence interval.
A)The mean prices for the manufactories A and B differ from the prices for the manufactories C and D.
B)The mean price for the manufactory B differs from the mean prices for the manufactories C and D, the mean price for the manufactory A differs from the mean price for the manufactory D.
C)The mean price for the manufactory B differs from the mean prices for the manufactories C and D.
D)The mean price for the manufactory B differs from the mean price for the manufactory D.
Carry out multiple comparison procedure and interpret the results using 95% Tukey-Kramer confidence interval.A)The mean prices for the manufactories A and B differ from the prices for the manufactories C and D.
B)The mean price for the manufactory B differs from the mean prices for the manufactories C and D, the mean price for the manufactory A differs from the mean price for the manufactory D.
C)The mean price for the manufactory B differs from the mean prices for the manufactories C and D.
D)The mean price for the manufactory B differs from the mean price for the manufactory D.
Unlock Deck
Unlock for access to all 25 flashcards in this deck.
Unlock Deck
k this deck
19
When you research question about the difference between three or more population means, the null hypothesis states that all the means are equal. Should the alternative hypothesis always state that at least two population means are not equal or it can vary? Explain why, or why not.
A)The alternative hypothesis can only state that at least two population means are not equal, because we are not interested in cases when one population mean is greater than other population means.
B)The alternative hypothesis can only state that all population means are not equal, because we cannot rank the population means from the smallest to the largest before the study.
C)The alternative hypothesis can only state that all population means are not equal, because we need the null and the alternative hypotheses to present all sample space.
D)Any statement suitable for the particular research can be stated as an alternative hypothesis.
Unlock Deck
Unlock for access to all 25 flashcards in this deck.
Unlock Deck
k this deck
20
Professor is interested if the average scores of her students in the math class are equal during the learning term or not. She considers the scores of her students for three in-class tests, end-of-course exam and the final score. The final score is calculated by the following formula: . Is it possible for the professor to carry out an ANOVA F-test using all five sample treatments? Choose the correct statement.
A)The final score depends on the other variables, so she cannot carry out an ANOVA F-test for these samples.
B)The sample standard error for first in-class test is significantly greater than the standard error for the other samples, so she cannot carry out an ANOVA F-test for these samples.
C)The sample distributions are not normal, so she cannot carry out an ANOVA F-test for these samples.
D)She can carry out an ANOVA F-test for these samples.
. Is it possible for the professor to carry out an ANOVA F-test using all five sample treatments? Choose the correct statement.A)The final score depends on the other variables, so she cannot carry out an ANOVA F-test for these samples.
B)The sample standard error for first in-class test is significantly greater than the standard error for the other samples, so she cannot carry out an ANOVA F-test for these samples.
C)The sample distributions are not normal, so she cannot carry out an ANOVA F-test for these samples.
D)She can carry out an ANOVA F-test for these samples.
Unlock Deck
Unlock for access to all 25 flashcards in this deck.
Unlock Deck
k this deck
21
When issuing a textbook, there is always a number of defective copies. The publishing house conducts a study to determine whether the number of defective copies depends on the format of the textbook. For the study, three random samples of textbook editions for the different book sizes were generated: a large portrait, a portrait, and a US letter, each of the editions has approximately equal number of copies. Twenty-one textbooks of each format were used for the study. Table containing summary data is presented below. Using a multiple comparison procedure identify differences between average number of defective copies. Use 95% Tukey-Kramer confidence interval.
A)We used and obtained following table.
B)We used and obtained following table.
C)We used and obtained following table.
D)We used and obtained following table.
E)We used and obtained following table.
Using a multiple comparison procedure identify differences between average number of defective copies. Use 95% Tukey-Kramer confidence interval. A)We used
and obtained following table. B)We used
and obtained following table. C)We used
and obtained following table. D)We used
and obtained following table. E)We used
and obtained following table. Unlock Deck
Unlock for access to all 25 flashcards in this deck.
Unlock Deck
k this deck
22
Researcher investigates the average life expectancy of Americans by their ethnicity. He generates four random samples for each of the major ethnicity groups: White, African-American, Hispanic and Asian-American. The table below represents the summary data for the study. Using a multiple comparison procedure identify differences between average precipitation for considered age cities. Use 95% Tukey-Kramer confidence interval.
A)We used and obtained the following table.
B)We used and obtained the following table.
C)We used and obtained the following table.
D)We used and obtained the following table.
E)We used and obtained the following table.
Using a multiple comparison procedure identify differences between average precipitation for considered age cities. Use 95% Tukey-Kramer confidence interval.A)We used
and obtained the following table. B)We used
and obtained the following table. C)We used
and obtained the following table. D)We used
and obtained the following table. E)We used
and obtained the following table. Unlock Deck
Unlock for access to all 25 flashcards in this deck.
Unlock Deck
k this deck
23
A company manufacturing details for the large machinery updates its milling machines. When at the first factory all the milling machines were replaced with the new ones, it was decided to conduct a study in order to define whether the average production time of one detail had decreased. For this purpose, at each of the company's factories (note that Factory A has only new milling machines and three other factories have both old and new milling machines), a sample determining the average production time of one detail had been generated. The result of this study is shown on the following underscoring pattern. Interpret this underscoring pattern.
A)Average time of making one detail for the factories A and D differ from the average time for the factories B and C.
B)Average time of making one detail for all the factories is the same.
C)Average time of making one detail for the factory A differs from the average time for the factories B, C and D.
D)Average time of making one detail for the factory A differs from the average time for the factories B and C, and other three factories have equal average time.
Interpret this underscoring pattern.A)Average time of making one detail for the factories A and D differ from the average time for the factories B and C.
B)Average time of making one detail for all the factories is the same.
C)Average time of making one detail for the factory A differs from the average time for the factories B, C and D.
D)Average time of making one detail for the factory A differs from the average time for the factories B and C, and other three factories have equal average time.
Unlock Deck
Unlock for access to all 25 flashcards in this deck.
Unlock Deck
k this deck
24
A technical support call center works every day, including weekends and public holidays. In order to test the expediency of working in weekends and public holidays, it is necessary to compare the intensity of calls coming to the call center within one working hour on a working day, on a weekend and on a public holiday. Three random samples of the numbers of calls received during an hour for working days, weekends and holidays were randomly generated. These samples can be considered representative for the population. The summary data are presented below. Carry out an ANOVA F test and interpret the results using the 95% confidence level.
A) , , , and P-value is less than 0.05.We reject the null hypothesis and can conclude that the average number of calls is not the same for different types of days.
B) , , , and P-value is greater than 0.05.We do not reject the null hypothesis and can conclude that the average number of calls is the same for different types of days.
C) , , , and P-value is less than 0.05.We reject the null hypothesis and can conclude that the average number of calls is not the same for different types of days.
D) , , , and P-value is greater than 0.05.We do not reject the null hypothesis and can conclude that the average number of calls is the same for different types of days.
Carry out an ANOVA F test and interpret the results using the 95% confidence level.
A)
, , , and P-value is less than 0.05.We reject the null hypothesis and can conclude that the average number of calls is not the same for different types of days.B)
, , , and P-value is greater than 0.05.We do not reject the null hypothesis and can conclude that the average number of calls is the same for different types of days.C)
, , , and P-value is less than 0.05.We reject the null hypothesis and can conclude that the average number of calls is not the same for different types of days.D)
, , , and P-value is greater than 0.05.We do not reject the null hypothesis and can conclude that the average number of calls is the same for different types of days. Unlock Deck
Unlock for access to all 25 flashcards in this deck.
Unlock Deck
k this deck
25
Below are the input data for four F-tests. Choose a situation where the application of the F-test is most justified.
A)Comparing three samples:
B)Comparing five samples:
C)Comparing three samples:
D)Comparing three samples:
A)Comparing three samples:
B)Comparing five samples:
C)Comparing three samples:
D)Comparing three samples:
Unlock Deck
Unlock for access to all 25 flashcards in this deck.
Unlock Deck
k this deck
Unlock Deck
Unlock for access to all 25 flashcards in this deck.


