Deck 11: Asking and Answering Questions About the Difference Between Two Proportions
Full screen (f)
Question
Question
A study was carried out to see if seniors were more likely than freshmen to favor banning cell phones at school. Which of the following hypotheses should be tested to answer this question?
A)
B)
C)
D)
E)
A)
B)
C)
D)
E)
Question
Question
Question
Question
Each person in a random sample of 200 students and a random sample of 150 faculty at a large university was asked "Do you take public transportation to campus?" Fifty-eight percent of the students and 46% of the faculty responded "Yes". This data was used to carry out a test of the hypotheses  . The value of the test statistic was z = 2.226. For a significance level of 0.01, which of the following is correct?
A) should be rejected; there is convincing evidence that the proportion of people who take public transportation to campus is different for students and faculty.
B) should be rejected; there is convincing evidence that the proportion of people who take public transportation to campus is the same for students and faculty.
C) should not be rejected; there is not convincing evidence that the proportion of people who take public transportation to campus is different for students and faculty.
D) should not be rejected; there is not convincing evidence that the proportion of people who take public transportation to campus is the same for students and faculty.
E)There is not enough information provided to be able to decide whether should be rejected or not.
. The value of the test statistic was z = 2.226. For a significance level of 0.01, which of the following is correct? A)
should be rejected; there is convincing evidence that the proportion of people who take public transportation to campus is different for students and faculty.B)
should be rejected; there is convincing evidence that the proportion of people who take public transportation to campus is the same for students and faculty.C)
should not be rejected; there is not convincing evidence that the proportion of people who take public transportation to campus is different for students and faculty.D)
should not be rejected; there is not convincing evidence that the proportion of people who take public transportation to campus is the same for students and faculty.E)There is not enough information provided to be able to decide whether
should be rejected or not. Question
Question
When constructing a confidence interval for the difference of two population proportions, the appropriate standard error of  is
is  .
.
is . Question
A 90% confidence interval for  is (-0.05, -0.002). Which of the following is the 95% confidence interval calculated from the same data?
A)(-0.058, 0.005)
B)(-0.055, 0.003)
C)(0.003, 0.055)
D)(0.005, 0.058)
E)(0.01, 0.06)
is (-0.05, -0.002). Which of the following is the 95% confidence interval calculated from the same data? A)(-0.058, 0.005)
B)(-0.055, 0.003)
C)(0.003, 0.055)
D)(0.005, 0.058)
E)(0.01, 0.06)
Question
For which of the following sample sizes and  values would it be appropriate to use
to estimate a difference in population proportions?
I.
II.
III.
A)I only
B)II only
C)III only
D)II and III only
E)I, II, and III
values would it be appropriate to useto estimate a difference in population proportions?
I.
II.
III.
A)I only
B)II only
C)III only
D)II and III only
E)I, II, and III
Question
Question
A hotel chain is interested in evaluating reservation processes. Guests can reserve a room by using either a telephone system (T) or an online system (O) that is accessed through the hotel's web site. Independent random samples of 90 guests who reserved a room by phone and 68 guests who reserved a room online were selected. Of those who reserved by phone, 61 reported that they were satisfied with the reservation process. Of those who reserved online, 44 reported that they were satisfied. Based on these data, is it reasonable to conclude that the proportion who are satisfied is greater for those who reserve a room online? Which of the following hypotheses should be tested to answer this question?
A)
B)
C)
D)
E)
A)
B)
C)
D)
E)
Question
Question
One method of human locomotion that appears to have no function except to express joy is skipping, a skill usually learned in early and middle childhood. In surveys gathered over a 3-year period, University students were asked, "Approximately how long ago did you last spontaneously skip?" The total sample sizes and the numbers who responded "Less than 1 week ago" are given in the table below: 
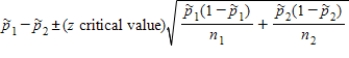
a)Construct a 95% confidence interval for the difference in the population proportions of males and females responding "Less than 1 week." Assume that it is reasonable to regard these samples as representative of the corresponding populations.
b)Does there appear to be a difference between the proportions of men and women responding "Less than 1 week?" Provide statistical justification for your answer.
Question
Question
Question
Question
One method of human locomotion that appears to have no function except to express joy is hopping, a skill usually learned in early and middle childhood. In surveys gathered over a 3-year period, University students were asked, "Approximately how long ago did you last spontaneously hop?" The total sample sizes and the numbers who responded "Less than 1 week ago" are given in the table below: 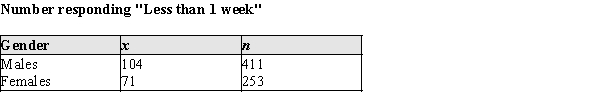
a)Construct a 95% confidence interval for the difference in the population proportions of males and females responding "Less than 1 week." Assume that it is reasonable to regard these samples as representative of the corresponding populations.
b)Does there appear to be a difference between the proportions of men and women responding "Less than 1 week?" Provide statistical justification for your answer.
Question
The hypothesis  is equivalent to the hypothesis
  .
.
is equivalent to the hypothesis . Question
In many animal societies, a role assumed by the adult male is a sentry, warning adult females and juveniles of approaching predators. Some students of animal behavior believe that in human society this role is active also. An interesting variation of this theory is that the human female accepts this role. In one 4-month study in Seattle, an investigator observed people crossing the street at an intersection with no traffic control. The observed behavior was the scanning behavior ("looking both ways") of adult males and females. The investigator reasoned that if the adult female accepted the protection of the adult male, the scanning rate when alone would be greater than when accompanied by an adult female. Data from this study is given below. 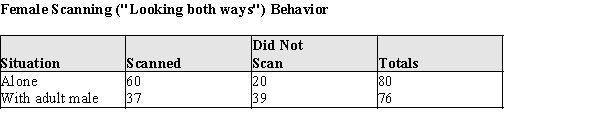 Do these data support the investigator's hypothesis that the female scanning rate would be less when accompanied by a male? Assume that it is reasonable to regard these samples as representative of the corresponding populations. Provide statistical justification for your answer.
Do these data support the investigator's hypothesis that the female scanning rate would be less when accompanied by a male? Assume that it is reasonable to regard these samples as representative of the corresponding populations. Provide statistical justification for your answer. Question
An article describes an experiment that investigated if car following behavior for motorcyclists in conditions A is less dangerous than in conditions B. Motorcyclists were randomly assigned to one of two groups. The 60 participants in the first group were placed in conditions A while driving in a simulator. The 60 participants in the second group were placed in conditions B while driving in a simulator. The motorcyclists were instructed to pay attention to neighboring traffic, maintain two car lengths from a virtual lead vehicle, and avoid crashes. Of the motorcyclists from the group A, 38 avoided crashes. Of the motorcyclists from the group B, 17 avoided crashes. Does these suggest that car following driving in conditions A is less dangerous than car following driving in conditions B? Carry out large-sample z test for a difference in treatment proportions and interpret the conclusion in context.
A) ;
;  ; reject H0.The proportion of motorcyclists who avoided crashes while driving in conditions A is significantly greater than the proportion of motorcyclists who avoided crashes while driving in conditions B.We can conclude that car following driving in conditions A is less dangerous than car following driving in conditions B.
B) ;
;  ; fail to reject H0.The proportion of motorcyclists who avoided crashes while driving in conditions B is greater than the proportion of motorcyclists who avoided crashes while driving in conditions A.We can conclude that car following driving in conditions B is less dangerous than car following driving in conditions A.
C) ;
;  ; reject H0.The proportion of motorcyclists who avoided crashes while driving in conditions B is significantly greater than the proportion of motorcyclists who avoided crashes while driving in conditions A.We can conclude that car following driving in conditions A is less dangerous than car following driving in conditions B.
D) ;
;  ; fail to reject H0.There is no evidence that the proportion of motorcyclists who avoided crashes while driving in conditions A is greater than the proportion of motorcyclists who avoided crashes while driving in conditions B.We can conclude that level of danger of car following driving in conditions A and level of danger of car following driving in conditions B could be equal.
E) ;
;  ; reject H0.The proportion of motorcyclists who avoided crashes while driving in conditions A is significantly greater than the proportion of motorcyclists who avoided crashes while driving in conditions B.We can conclude that car following driving in conditions B is less dangerous than car following driving in conditions A.
A)
; ; reject H0.The proportion of motorcyclists who avoided crashes while driving in conditions A is significantly greater than the proportion of motorcyclists who avoided crashes while driving in conditions B.We can conclude that car following driving in conditions A is less dangerous than car following driving in conditions B.B)
; ; fail to reject H0.The proportion of motorcyclists who avoided crashes while driving in conditions B is greater than the proportion of motorcyclists who avoided crashes while driving in conditions A.We can conclude that car following driving in conditions B is less dangerous than car following driving in conditions A.C)
; ; reject H0.The proportion of motorcyclists who avoided crashes while driving in conditions B is significantly greater than the proportion of motorcyclists who avoided crashes while driving in conditions A.We can conclude that car following driving in conditions A is less dangerous than car following driving in conditions B.D)
; ; fail to reject H0.There is no evidence that the proportion of motorcyclists who avoided crashes while driving in conditions A is greater than the proportion of motorcyclists who avoided crashes while driving in conditions B.We can conclude that level of danger of car following driving in conditions A and level of danger of car following driving in conditions B could be equal.E)
; ; reject H0.The proportion of motorcyclists who avoided crashes while driving in conditions A is significantly greater than the proportion of motorcyclists who avoided crashes while driving in conditions B.We can conclude that car following driving in conditions B is less dangerous than car following driving in conditions A. Question
Question
A group of people received the same treatment. Then the members of the initial group were randomly assigned to two new groups. Would the proportion of success be the same for the two groups? The variable  represents the observed proportion for the group 1 and the variable
  represents the observed proportion for the group 2. What does it mean when the
  ?
?
A)The observed proportion of success would necessarily be the same for these groups.The value represents the null hypothesis, which is not rejected.There is not convincing evidence the treatment proportions are different.
B)The observed proportion wouldn't necessarily be the same for these groups.The value represents the null hypothesis, which is rejected.There is a convincing evidence that the proportion for the group 1 is greater than the proportion for the group 2.
C)The observed proportion wouldn't necessarily be the same for these groups.The value represents the null hypothesis, which is rejected.There is a convincing evidence that the proportion for the group 2 is greater than the proportion for the group 1.
D) a. The observed proportion of success would necessarily be the same for these groups. The value p1-p2=0
represents the null hypothesis, which is not rejected. There is not convincing evidence the treatment proportions are different.
represents the observed proportion for the group 1 and the variable represents the observed proportion for the group 2. What does it mean when the ? A)The observed proportion of success would necessarily be the same for these groups.The value
represents the null hypothesis, which is not rejected.There is not convincing evidence the treatment proportions are different.B)The observed proportion wouldn't necessarily be the same for these groups.The value
represents the null hypothesis, which is rejected.There is a convincing evidence that the proportion for the group 1 is greater than the proportion for the group 2.C)The observed proportion wouldn't necessarily be the same for these groups.The value
represents the null hypothesis, which is rejected.There is a convincing evidence that the proportion for the group 2 is greater than the proportion for the group 1.D) a. The observed proportion of success would necessarily be the same for these groups. The value p1-p2=0
represents the null hypothesis, which is not rejected. There is not convincing evidence the treatment proportions are different.
Question
Question
Question
Question
Question
One of the most striking human accomplishments is the achievement of intelligible speech by age five. Deficits in speech acquisition often occur when a child has hearing difficulty or does is slow to develop the motor functions associated with speech. Other deficits in speech acquisition are of unknown origin. It has been hypothesized that a family history of speech communication disorder might be a factor in speech delay. The theory is that if members of the family have difficulty communicating, this may increase the probability of a speech deficit in a young family member. A random sample of healthy two-year-olds was followed over the course of a year. At age 3, each child was classified as having a speech delay or not. These data, cross-classified by a family history of speech communication disorder, is given in the table below: 
a)At the .05 significance level, do the data provide evidence of the hypothesized developmental differences? Provide statistical evidence for your conclusion.
b)Is this an observational or experimental study? Justify your response in a few sentences.
a)At the .05 significance level, do the data provide evidence of the hypothesized developmental differences? Provide statistical evidence for your conclusion.
b)Is this an observational or experimental study? Justify your response in a few sentences.
Question
The report describes the results of a survey of 739 automobile owners age 18 to 29 and 564 automobile owners age 30 to 49 in a certain metropolitan area. Survey participants were asked if they own an automobile that is equipped with an electrical engine; 42% of the automobile owners age 18 to 29 and 36% of the automobile owners age 30 to 49 said "yes". Suppose you want to decide if there is evidence that the proportion of owners of automobiles equipped with electrical engine is different for age 18 to 29 and age 30 to 49.
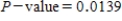
What is the value of the test statistics and what is the associated P-value? If a significance level of 0.05 is selected for the test, will you reject or fail to reject the null hypothesis?
A) ;
;  ; We reject H0; Assuming that the samples are representative of the populations of interest, we would conclude that the proportion of owners of automobiles equipped with electrical engine differs for age 18 to 29 and age 30 to 49.
B) ;
;  ; We reject H0; Assuming that the samples are representative of the populations of interest, we would conclude that the proportion of owners of automobiles equipped with electrical engine differs for age 18 to 29 and age 30 to 49.
C) ;
;  ; We fail to reject H0; Assuming that the samples are representative of the populations of interest, we would conclude that there is no evidence the proportion of owners of automobiles equipped with electrical engine differs for age 18 to 29 and age 30 to 49.
D) ;
;  ; We fail to reject H0; Assuming that the samples are representative of the populations of interest, we would conclude that there is no evidence the proportion of owners of automobiles equipped with electrical engine differs for age 18 to 29 and age 30 to 49.
E) ;
;  ; We reject H0; Assuming that the samples are representative of the populations of interest, we would conclude that the proportion of owners of automobiles equipped with electrical engine differs for age 18 to 29 and age 30 to 49.
What is the value of the test statistics and what is the associated P-value? If a significance level of 0.05 is selected for the test, will you reject or fail to reject the null hypothesis?
A)
; ; We reject H0; Assuming that the samples are representative of the populations of interest, we would conclude that the proportion of owners of automobiles equipped with electrical engine differs for age 18 to 29 and age 30 to 49.B)
; ; We reject H0; Assuming that the samples are representative of the populations of interest, we would conclude that the proportion of owners of automobiles equipped with electrical engine differs for age 18 to 29 and age 30 to 49.C)
; ; We fail to reject H0; Assuming that the samples are representative of the populations of interest, we would conclude that there is no evidence the proportion of owners of automobiles equipped with electrical engine differs for age 18 to 29 and age 30 to 49.D)
; ; We fail to reject H0; Assuming that the samples are representative of the populations of interest, we would conclude that there is no evidence the proportion of owners of automobiles equipped with electrical engine differs for age 18 to 29 and age 30 to 49.E)
; ; We reject H0; Assuming that the samples are representative of the populations of interest, we would conclude that the proportion of owners of automobiles equipped with electrical engine differs for age 18 to 29 and age 30 to 49. Question
Question
Question
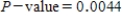
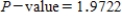
One of the most striking human accomplishments is the achievement of intelligible speech by age five. Deficits in speech acquisition often occur when a child has hearing difficulty or is slow to develop the motor functions associated with speech. Other deficits in speech acquisition are of unknown origin. Males generally develop physiologically at a slower rate than females, and in a recent large study of speech development in young children investigators hypothesized that a greater proportion of boys would have speech deficits for this reason. A random sample of healthy two-year-olds was followed over the course of a year. At age 3, each child was classified as having a speech delay or not. The data by gender is given in the table below: 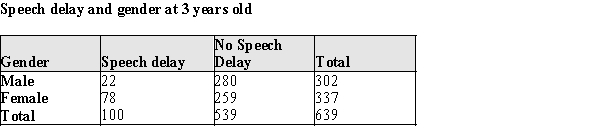
a)At the .05 significance level, do the data provide evidence of the hypothesized developmental differences? Provide statistical evidence for your conclusion.
b)Is this an observational or experimental study? Justify your response in a few sentences.
a)At the .05 significance level, do the data provide evidence of the hypothesized developmental differences? Provide statistical evidence for your conclusion.
b)Is this an observational or experimental study? Justify your response in a few sentences.
Question
Question
Question
An article describes the results of an experiment. Patients suffering from chronic somatic diseases were randomly assigned to the two groups. One group was a control group of patients who received treatment A. Of the 58 patients in this group, 9 reported improvements at the end of the study period. Patients in the second group received treatment B. Of the 33 patients in this group, 4 reported improvements at the end of the study period.
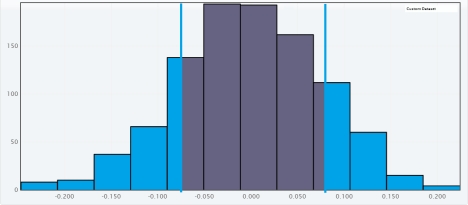
Do these data provide evidence that the proportion of success for patients who received treatment A differs from the proportion of success for patients who received treatment B? Use a randomization test to select the appropriate output for one set of 1000 simulated proportions and carry out a hypothesis test for a difference in proportions. Use a significance level of 0.05.
A)
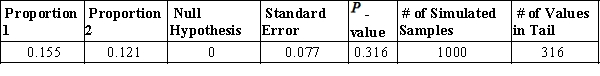 The approximate
  -value is 0.316.Since it is lower than
  , we reject
  for a significance level of 0.05 .There is significant difference between the proportion of success for patients who received treatment A and the proportion of success for patients who received treatment B.
B)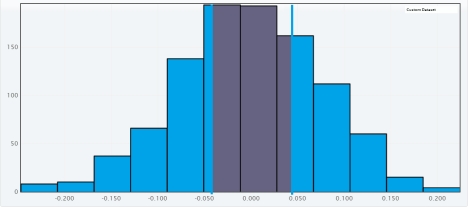
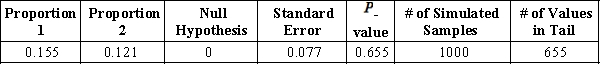 The approximate
  -value is 0.655.Since it is greater than
  , we fail to reject
  for a significance level of 0.05.There is not convincing evidence that there is difference between the proportion of success for patients who received treatment A and the proportion of success for patients who received treatment B.
C)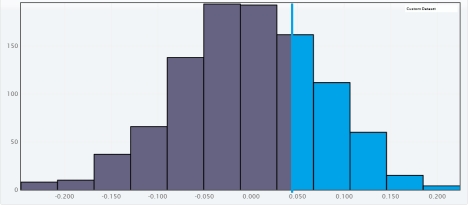
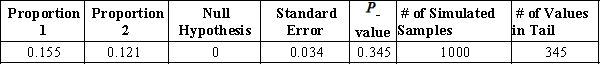
The approximate -value is 0.345.Since it is greater than
  , we reject
  for a significance level of 0.05.There is significant difference between the proportion of success fot patients who received treatment A and the proportion of success for patients who received treatment B.
D)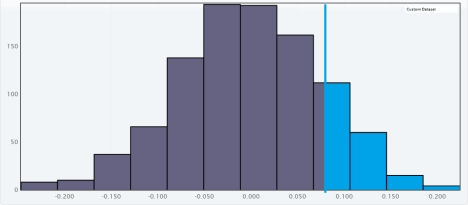
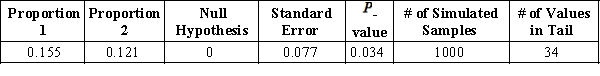
The approximate -value is 0.034.Since it is lower than
  , we reject
  for a significance level of 0.05.There is significant difference between the proportion of success for patients who received treatment A and the proportion of success for patients who received treatment B.
E)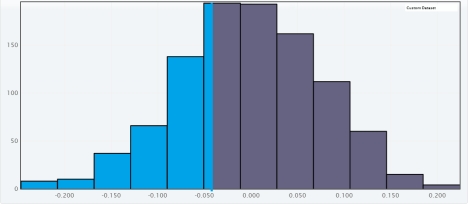
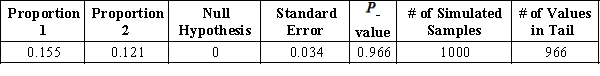
The approximate -value is 0.966.Since it is greater than
  , we reject for a significance level of 0.05 .There is not convincing evidence that there is difference between the proportion of success for patients who received treatment A and the proportion of success for patients who received treatment B.
Do these data provide evidence that the proportion of success for patients who received treatment A differs from the proportion of success for patients who received treatment B? Use a randomization test to select the appropriate output for one set of 1000 simulated proportions and carry out a hypothesis test for a difference in proportions. Use a significance level of 0.05.
A)
The approximate -value is 0.316.Since it is lower than , we reject for a significance level of 0.05 .There is significant difference between the proportion of success for patients who received treatment A and the proportion of success for patients who received treatment B.B)
The approximate -value is 0.655.Since it is greater than , we fail to reject for a significance level of 0.05.There is not convincing evidence that there is difference between the proportion of success for patients who received treatment A and the proportion of success for patients who received treatment B.C)
The approximate
-value is 0.345.Since it is greater than , we reject for a significance level of 0.05.There is significant difference between the proportion of success fot patients who received treatment A and the proportion of success for patients who received treatment B.D)
The approximate
-value is 0.034.Since it is lower than , we reject for a significance level of 0.05.There is significant difference between the proportion of success for patients who received treatment A and the proportion of success for patients who received treatment B.E)
The approximate
-value is 0.966.Since it is greater than , we reject for a significance level of 0.05 .There is not convincing evidence that there is difference between the proportion of success for patients who received treatment A and the proportion of success for patients who received treatment B. Question
An article describes the results of an experiment. Students were randomly assigned to the two groups. One group was a control group of students who used source A while preparing for the test. Of the 54 students in this group, 31 passed the test. Those in the second group used source B while preparing for the test. Of the 48 students in the supplement group, 17 passed the test. Construct and interpret a 95% confidence interval for the difference in the proportion of students who passed the test using source A and the proportion of students who passed the test using source B.
A)CI: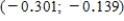 ; Because both endpoints of the interval are negative, you would conclude that the proportion of students who passed the test using source B is greater than the proportion of students who passed the test using source A by somewhere between 0.139 and 0.301.
B)CI: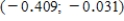 ; Because both endpoints of the interval are negative, you would conclude that the proportion of students who passed the test using source B is greater than the proportion of students who passed the test using source A by somewhere between 0.031 and 0.409.
C)CI: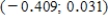 ; Because 0 is included in the confidence interval, you can conclude that the proportion of students who passed the test using source A and the proportion of students who passed the test using source B could be equal.
D)CI: ; Because both endpoints of the interval are positive, you would conclude that the proportion of students who passed the test using source A is greater than the proportion of students who passed the test using source B by somewhere between 0.031 and 0.409.
E)CI: ; Because both endpoints of the interval are positive, you would conclude that the proportion of students who passed the test using source A is greater than the proportion of students who passed the test using source B by somewhere between 0.139 and 0.301.
A)CI:
; Because both endpoints of the interval are negative, you would conclude that the proportion of students who passed the test using source B is greater than the proportion of students who passed the test using source A by somewhere between 0.139 and 0.301.B)CI:
; Because both endpoints of the interval are negative, you would conclude that the proportion of students who passed the test using source B is greater than the proportion of students who passed the test using source A by somewhere between 0.031 and 0.409.C)CI:
; Because 0 is included in the confidence interval, you can conclude that the proportion of students who passed the test using source A and the proportion of students who passed the test using source B could be equal.D)CI:
; Because both endpoints of the interval are positive, you would conclude that the proportion of students who passed the test using source A is greater than the proportion of students who passed the test using source B by somewhere between 0.031 and 0.409.E)CI:
; Because both endpoints of the interval are positive, you would conclude that the proportion of students who passed the test using source A is greater than the proportion of students who passed the test using source B by somewhere between 0.139 and 0.301. Question
A study is conducted at a university to determine if it's test-preparation seminar improves the proportion of students who pass the AP Statistics exam. The following summary data were obtained.  Is there evidence to support the claim that the proportion of passing grades is higher for those who attended the seminar? Compute the test statistic for this test.
A)2.182
B)0.0145
C)1.976
D)1.847
Is there evidence to support the claim that the proportion of passing grades is higher for those who attended the seminar? Compute the test statistic for this test.A)2.182
B)0.0145
C)1.976
D)1.847
Question
In many animal societies, a role assumed by the adult male is a sentry, warning adult females and juveniles of approaching predators. Some students of animal behavior believe that this occurs in human society also. In one 4-month study in Seattle an investigator observed people crossing the street at an intersection with no traffic control. The observed behavior was the scanning behavior ("looking both ways") of adult males and females. The investigator reasoned that if the adult male assumed a protective sentry role, the scanning rate when alone would be less than when accompanied by an adult female. Data from this study is given below. 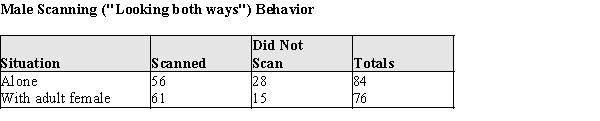 Do these data support the investigator's hypothesis that the male scanning rate would be greater when accompanied by a female? Assume that is reasonable to regard these samples as representative of the corresponding populations. Provide statistical justification for your answer.
Do these data support the investigator's hypothesis that the male scanning rate would be greater when accompanied by a female? Assume that is reasonable to regard these samples as representative of the corresponding populations. Provide statistical justification for your answer. Question
Question
Question
Question

Unlock Deck
Sign up to unlock the cards in this deck!
Unlock Deck
Unlock Deck
1/42
Play
Full screen (f)
Deck 11: Asking and Answering Questions About the Difference Between Two Proportions
1
The standard deviation of p1 − p2 used in the large sample test of p1 − p2 is the same as the standard deviation used in the large sample confidence interval for p1 − p2.
False
2
A study was carried out to see if seniors were more likely than freshmen to favor banning cell phones at school. Which of the following hypotheses should be tested to answer this question?
A)
B)
C)
D)
E)
A)
B)
C)
D)
E)
3
A study is conducted to determine whether the proportion of airline passengers complaining with post-flight respiratory symptoms is larger for flights that do not circulate cabin air than for flights that do circulate the air. After checking to make sure that all of the necessary conditions were met, we calculated the value of the z test statistic to be z = 0.84. Which of the following is the P-value associated with this test?
A)0
B)0.2005
C)0.401
D)0.7995
E)0.599
A)0
B)0.2005
C)0.401
D)0.7995
E)0.599
0.2005
4
A study seeks to determine whether the proportion of Dutch boys who listen to music at high volume is greater than this proportion for Dutch girls. After checking to make sure that all of the necessary conditions were met, we calculated the value of the z test statistic to be z = 2.999. Which of the following is the P-value associated with this test?
A)0
B)0.0014
C)0.0028
D)0.9986
E)0.9972
A)0
B)0.0014
C)0.0028
D)0.9986
E)0.9972
Unlock Deck
Unlock for access to all 42 flashcards in this deck.
Unlock Deck
k this deck
5
A study by the Poultry Research Center seeks to determine if diet affects the onset of egg laying in juvenile Rhode Island Red hens. In a group of 34 hens that were fed scratch grain, 12 were laying eggs at 13 weeks of age. In a second, independent group of 25 hens that were fed on layer pellets, 4 hens were laying at 13 weeks of age. The 95% confidence interval for the difference in laying proportions at 13 weeks is:
A)0.19 ± 0.13
B)0 ± 0.13
C)8 ± 10
D)0.16 ± 0.06
E)0.19 ± 0.22
A)0.19 ± 0.13
B)0 ± 0.13
C)8 ± 10
D)0.16 ± 0.06
E)0.19 ± 0.22
Unlock Deck
Unlock for access to all 42 flashcards in this deck.
Unlock Deck
k this deck
6
Each person in a random sample of 200 students and a random sample of 150 faculty at a large university was asked "Do you take public transportation to campus?" Fifty-eight percent of the students and 46% of the faculty responded "Yes". This data was used to carry out a test of the hypotheses . The value of the test statistic was z = 2.226. For a significance level of 0.01, which of the following is correct?
A) should be rejected; there is convincing evidence that the proportion of people who take public transportation to campus is different for students and faculty.
B) should be rejected; there is convincing evidence that the proportion of people who take public transportation to campus is the same for students and faculty.
C) should not be rejected; there is not convincing evidence that the proportion of people who take public transportation to campus is different for students and faculty.
D) should not be rejected; there is not convincing evidence that the proportion of people who take public transportation to campus is the same for students and faculty.
E)There is not enough information provided to be able to decide whether should be rejected or not.
. The value of the test statistic was z = 2.226. For a significance level of 0.01, which of the following is correct? A)
should be rejected; there is convincing evidence that the proportion of people who take public transportation to campus is different for students and faculty.B)
should be rejected; there is convincing evidence that the proportion of people who take public transportation to campus is the same for students and faculty.C)
should not be rejected; there is not convincing evidence that the proportion of people who take public transportation to campus is different for students and faculty.D)
should not be rejected; there is not convincing evidence that the proportion of people who take public transportation to campus is the same for students and faculty.E)There is not enough information provided to be able to decide whether
should be rejected or not. Unlock Deck
Unlock for access to all 42 flashcards in this deck.
Unlock Deck
k this deck
7
Two samples are said to be independent when the selection of the individuals in one sample has no bearing on the selection of those in the other sample.
Unlock Deck
Unlock for access to all 42 flashcards in this deck.
Unlock Deck
k this deck
8
When constructing a confidence interval for the difference of two population proportions, the appropriate standard error of is .
is . Unlock Deck
Unlock for access to all 42 flashcards in this deck.
Unlock Deck
k this deck
9
A 90% confidence interval for is (-0.05, -0.002). Which of the following is the 95% confidence interval calculated from the same data?
A)(-0.058, 0.005)
B)(-0.055, 0.003)
C)(0.003, 0.055)
D)(0.005, 0.058)
E)(0.01, 0.06)
is (-0.05, -0.002). Which of the following is the 95% confidence interval calculated from the same data? A)(-0.058, 0.005)
B)(-0.055, 0.003)
C)(0.003, 0.055)
D)(0.005, 0.058)
E)(0.01, 0.06)
Unlock Deck
Unlock for access to all 42 flashcards in this deck.
Unlock Deck
k this deck
10
For which of the following sample sizes and values would it be appropriate to use
to estimate a difference in population proportions?
I.
II.
III.
A)I only
B)II only
C)III only
D)II and III only
E)I, II, and III
values would it be appropriate to useto estimate a difference in population proportions?
I.
II.
III.
A)I only
B)II only
C)III only
D)II and III only
E)I, II, and III
Unlock Deck
Unlock for access to all 42 flashcards in this deck.
Unlock Deck
k this deck
11
When comparing two population means, it is important to make the distinction between independent samples and paired samples. What makes two samples independent?
Unlock Deck
Unlock for access to all 42 flashcards in this deck.
Unlock Deck
k this deck
12
A hotel chain is interested in evaluating reservation processes. Guests can reserve a room by using either a telephone system (T) or an online system (O) that is accessed through the hotel's web site. Independent random samples of 90 guests who reserved a room by phone and 68 guests who reserved a room online were selected. Of those who reserved by phone, 61 reported that they were satisfied with the reservation process. Of those who reserved online, 44 reported that they were satisfied. Based on these data, is it reasonable to conclude that the proportion who are satisfied is greater for those who reserve a room online? Which of the following hypotheses should be tested to answer this question?
A)
B)
C)
D)
E)
A)
B)
C)
D)
E)
Unlock Deck
Unlock for access to all 42 flashcards in this deck.
Unlock Deck
k this deck
13
The P-value for a hypothesis test concerning the difference in two population proportions is always calculated by finding the area to the right of the test statistic, regardless of the alternative hypothesis.
Unlock Deck
Unlock for access to all 42 flashcards in this deck.
Unlock Deck
k this deck
14
One method of human locomotion that appears to have no function except to express joy is skipping, a skill usually learned in early and middle childhood. In surveys gathered over a 3-year period, University students were asked, "Approximately how long ago did you last spontaneously skip?" The total sample sizes and the numbers who responded "Less than 1 week ago" are given in the table below:
a)Construct a 95% confidence interval for the difference in the population proportions of males and females responding "Less than 1 week." Assume that it is reasonable to regard these samples as representative of the corresponding populations.
b)Does there appear to be a difference between the proportions of men and women responding "Less than 1 week?" Provide statistical justification for your answer.
Unlock Deck
Unlock for access to all 42 flashcards in this deck.
Unlock Deck
k this deck
15
A study determined that in 2009, 38% of those in a random sample of 100 adult Americans had accounts with some type of social web site. In a similar survey conducted in 2012, 53% reported having accounts. Suppose that the 2012 figure was also based on a random sample of size 100. The 95% confidence interval for the difference in population proportions, P2012-P2009 , is:
A)0.15 ± 0.088
B)0.29 ± 0.136
C)0.15 ± 0.136
D)0.29 ± 0.88
E)0.00 ± 0.136
A)0.15 ± 0.088
B)0.29 ± 0.136
C)0.15 ± 0.136
D)0.29 ± 0.88
E)0.00 ± 0.136
Unlock Deck
Unlock for access to all 42 flashcards in this deck.
Unlock Deck
k this deck
16
A researcher would like to learn about the difference in proportions of students and faculty who support textbook price caps. The researcher gathers a random sample of 500 students and 500 faculty members and asks whether or not they support textbook price caps. Of the 500 students, 378 say they support capping textbook prices and of the 500 faculty members 256 say they support capping prices.
a.Determine if the large sample confidence interval procedure can be used for estimation.
b.Create a 95% confidence interval for the difference of the population proportions.
c.Interpret the confidence interval.
a.Determine if the large sample confidence interval procedure can be used for estimation.
b.Create a 95% confidence interval for the difference of the population proportions.
c.Interpret the confidence interval.
Unlock Deck
Unlock for access to all 42 flashcards in this deck.
Unlock Deck
k this deck
17
To learn about the proportion of college students who are registered to vote, surveys were conducted in 2010 and in 2011. Suppose that in 2010, 39% of the people in a representative sample of 450 college students were registered to vote. In 2011, 33% of the people in a representative sample of 235 college students were registered to vote. For the 99% confidence level, determine the margin of error of the difference of the proportions.
A)0.0751
B)0.0495
C)0.0989
D)0.4131
E)0.0383
A)0.0751
B)0.0495
C)0.0989
D)0.4131
E)0.0383
Unlock Deck
Unlock for access to all 42 flashcards in this deck.
Unlock Deck
k this deck
18
One method of human locomotion that appears to have no function except to express joy is hopping, a skill usually learned in early and middle childhood. In surveys gathered over a 3-year period, University students were asked, "Approximately how long ago did you last spontaneously hop?" The total sample sizes and the numbers who responded "Less than 1 week ago" are given in the table below:
a)Construct a 95% confidence interval for the difference in the population proportions of males and females responding "Less than 1 week." Assume that it is reasonable to regard these samples as representative of the corresponding populations.
b)Does there appear to be a difference between the proportions of men and women responding "Less than 1 week?" Provide statistical justification for your answer.
Unlock Deck
Unlock for access to all 42 flashcards in this deck.
Unlock Deck
k this deck
19
The hypothesis is equivalent to the hypothesis .
is equivalent to the hypothesis . Unlock Deck
Unlock for access to all 42 flashcards in this deck.
Unlock Deck
k this deck
20
In many animal societies, a role assumed by the adult male is a sentry, warning adult females and juveniles of approaching predators. Some students of animal behavior believe that in human society this role is active also. An interesting variation of this theory is that the human female accepts this role. In one 4-month study in Seattle, an investigator observed people crossing the street at an intersection with no traffic control. The observed behavior was the scanning behavior ("looking both ways") of adult males and females. The investigator reasoned that if the adult female accepted the protection of the adult male, the scanning rate when alone would be greater than when accompanied by an adult female. Data from this study is given below. Do these data support the investigator's hypothesis that the female scanning rate would be less when accompanied by a male? Assume that it is reasonable to regard these samples as representative of the corresponding populations. Provide statistical justification for your answer.
Do these data support the investigator's hypothesis that the female scanning rate would be less when accompanied by a male? Assume that it is reasonable to regard these samples as representative of the corresponding populations. Provide statistical justification for your answer. Unlock Deck
Unlock for access to all 42 flashcards in this deck.
Unlock Deck
k this deck
21
An article describes an experiment that investigated if car following behavior for motorcyclists in conditions A is less dangerous than in conditions B. Motorcyclists were randomly assigned to one of two groups. The 60 participants in the first group were placed in conditions A while driving in a simulator. The 60 participants in the second group were placed in conditions B while driving in a simulator. The motorcyclists were instructed to pay attention to neighboring traffic, maintain two car lengths from a virtual lead vehicle, and avoid crashes. Of the motorcyclists from the group A, 38 avoided crashes. Of the motorcyclists from the group B, 17 avoided crashes. Does these suggest that car following driving in conditions A is less dangerous than car following driving in conditions B? Carry out large-sample z test for a difference in treatment proportions and interpret the conclusion in context.
A) ; ; reject H0.The proportion of motorcyclists who avoided crashes while driving in conditions A is significantly greater than the proportion of motorcyclists who avoided crashes while driving in conditions B.We can conclude that car following driving in conditions A is less dangerous than car following driving in conditions B.
B) ; ; fail to reject H0.The proportion of motorcyclists who avoided crashes while driving in conditions B is greater than the proportion of motorcyclists who avoided crashes while driving in conditions A.We can conclude that car following driving in conditions B is less dangerous than car following driving in conditions A.
C) ; ; reject H0.The proportion of motorcyclists who avoided crashes while driving in conditions B is significantly greater than the proportion of motorcyclists who avoided crashes while driving in conditions A.We can conclude that car following driving in conditions A is less dangerous than car following driving in conditions B.
D) ; ; fail to reject H0.There is no evidence that the proportion of motorcyclists who avoided crashes while driving in conditions A is greater than the proportion of motorcyclists who avoided crashes while driving in conditions B.We can conclude that level of danger of car following driving in conditions A and level of danger of car following driving in conditions B could be equal.
E) ; ; reject H0.The proportion of motorcyclists who avoided crashes while driving in conditions A is significantly greater than the proportion of motorcyclists who avoided crashes while driving in conditions B.We can conclude that car following driving in conditions B is less dangerous than car following driving in conditions A.
A)
; ; reject H0.The proportion of motorcyclists who avoided crashes while driving in conditions A is significantly greater than the proportion of motorcyclists who avoided crashes while driving in conditions B.We can conclude that car following driving in conditions A is less dangerous than car following driving in conditions B.B)
; ; fail to reject H0.The proportion of motorcyclists who avoided crashes while driving in conditions B is greater than the proportion of motorcyclists who avoided crashes while driving in conditions A.We can conclude that car following driving in conditions B is less dangerous than car following driving in conditions A.C)
; ; reject H0.The proportion of motorcyclists who avoided crashes while driving in conditions B is significantly greater than the proportion of motorcyclists who avoided crashes while driving in conditions A.We can conclude that car following driving in conditions A is less dangerous than car following driving in conditions B.D)
; ; fail to reject H0.There is no evidence that the proportion of motorcyclists who avoided crashes while driving in conditions A is greater than the proportion of motorcyclists who avoided crashes while driving in conditions B.We can conclude that level of danger of car following driving in conditions A and level of danger of car following driving in conditions B could be equal.E)
; ; reject H0.The proportion of motorcyclists who avoided crashes while driving in conditions A is significantly greater than the proportion of motorcyclists who avoided crashes while driving in conditions B.We can conclude that car following driving in conditions B is less dangerous than car following driving in conditions A. Unlock Deck
Unlock for access to all 42 flashcards in this deck.
Unlock Deck
k this deck
22
When testing hypotheses concerning differences in treatment effects from an experiment, the test statistic used for comparing two treatments is the same as the test statistic used for comparing differences between two population means from a sample study.
Unlock Deck
Unlock for access to all 42 flashcards in this deck.
Unlock Deck
k this deck
23
A group of people received the same treatment. Then the members of the initial group were randomly assigned to two new groups. Would the proportion of success be the same for the two groups? The variable represents the observed proportion for the group 1 and the variable represents the observed proportion for the group 2. What does it mean when the ?
A)The observed proportion of success would necessarily be the same for these groups.The value represents the null hypothesis, which is not rejected.There is not convincing evidence the treatment proportions are different.
B)The observed proportion wouldn't necessarily be the same for these groups.The value represents the null hypothesis, which is rejected.There is a convincing evidence that the proportion for the group 1 is greater than the proportion for the group 2.
C)The observed proportion wouldn't necessarily be the same for these groups.The value represents the null hypothesis, which is rejected.There is a convincing evidence that the proportion for the group 2 is greater than the proportion for the group 1.
D) a. The observed proportion of success would necessarily be the same for these groups. The value p1-p2=0
represents the null hypothesis, which is not rejected. There is not convincing evidence the treatment proportions are different.
represents the observed proportion for the group 1 and the variable represents the observed proportion for the group 2. What does it mean when the ? A)The observed proportion of success would necessarily be the same for these groups.The value
represents the null hypothesis, which is not rejected.There is not convincing evidence the treatment proportions are different.B)The observed proportion wouldn't necessarily be the same for these groups.The value
represents the null hypothesis, which is rejected.There is a convincing evidence that the proportion for the group 1 is greater than the proportion for the group 2.C)The observed proportion wouldn't necessarily be the same for these groups.The value
represents the null hypothesis, which is rejected.There is a convincing evidence that the proportion for the group 2 is greater than the proportion for the group 1.D) a. The observed proportion of success would necessarily be the same for these groups. The value p1-p2=0
represents the null hypothesis, which is not rejected. There is not convincing evidence the treatment proportions are different.
Unlock Deck
Unlock for access to all 42 flashcards in this deck.
Unlock Deck
k this deck
24
A marketing strategist would like to estimate the difference between the proportion of men who list "Action" as their favorite movie genre and the proportion of women who list "Action" as their favorite genre. The strategist gathers a random sample of 300 men and 200 women. Of the men, 156 indicate that "Action" is their favorite genre; of the women, 87 indicate that "Action" is their favorite.
a.Determine if the large sample confidence interval procedures can be used for estimation.
b.Create a 95% confidence interval for the difference of the population proportions.
c.Interpret the confidence interval.
d.Based on the confidence interval, is it possible that the two population proportions are equal?
Unlock Deck
Unlock for access to all 42 flashcards in this deck.
Unlock Deck
k this deck
25
Compare the results of the survey and the experiment. The report describes the results of a survey of 739 automobile owners age 18 to 29 and
564 automobile owners age 30 to 49 in a certain metropolitan area. Survey participants were asked if they own an automobile that is equipped with an electrical engine; 42% of the automobile owners age 18 to 29 and 36% of the automobile owners age 30 to 49 said "yes".
An article describes an experiment that investigated if sending or receiving text messages is more distracting than programming navigation devices. Drivers were randomly assigned to one of two groups. The 60 drivers in the cell phone group sent or received messages while driving in a simulator. The 60 drivers in the navigator group programmed navigator devices while driving in a simulator. The drivers were instructed to exit the highway when they came to a rest stop. Of the drivers programming the navigator devices, 38 noticed the rest stop and exited. For the drivers sending and receiving messages, 17 noticed the rest stop and exited.
What is the difference between these two types of data?
A)The survey consists of two samples.One sample is independent random sample from the populations of interest.Another sample is definitely set.Sample sizes are large.The experiment consists of two treatments.Individuals or objects are randomly assigned to one treatment.Another treatment is definitely set.The number of individuals or objects in each of the treatment is large.
B)The survey consists of two samples.One sample is independent random sample from the populations of interest.Another sample is definitely set.Sample sizes are large.The experiment consists of two treatments.Individuals or objects are randomly assigned to treatments.The number of individuals or objects in each of the treatment is large.
C)The survey consists of two samples that are independent random samples from the populations of interest.Sample sizes are large.The experiment consists of two treatments.Individuals or objects are randomly assigned to one treatment.Another treatment is definitely set.The number of individuals or objects in each of the treatment is large.
D)The survey consists of two samples that are independent random samples from the populations of interest.Sample sizes are large.The experiment consists of two treatments.Individuals or objects are randomly assigned to treatments.The number of individuals or objects in each of the treatment is large.
E)The survey consists of two treatments.Individuals or objects are randomly assigned to treatments.The number of individuals or objects in each of the treatment is large.The experiment consists of two samples that are independent random samples from the populations of interest.Sample sizes are large.
Unlock Deck
Unlock for access to all 42 flashcards in this deck.
Unlock Deck
k this deck
26
A marketing strategist would like to determine if a difference in the proportions of men and women who indicate "Action" as their favorite movie genre exists. The strategist gathers a random sample of 300 men and 200 women. Of the men, 156 indicate that "Action" is their favorite genre; of the women, 87 indicate that "Action" is their favorite.
a.What are the hypotheses the researcher should use?
b.Are the assumptions for a large sample test?
c.What is the P-value for the hypothesis test?
d.What conclusion can be drawn?
a.What are the hypotheses the researcher should use?
b.Are the assumptions for a large sample test?
c.What is the P-value for the hypothesis test?
d.What conclusion can be drawn?
Unlock Deck
Unlock for access to all 42 flashcards in this deck.
Unlock Deck
k this deck
27
A study compared flu vaccine administered by injection and flu vaccine administered as a nasal spray. Each of 4,000 children under the age of 5 who participated in the study received both a nasal spray and an injection, but only one was the real vaccine and the other was salt water. At the end of the flu season, it was determined that of the 2,000 children receiving the real vaccine by nasal spray, 10.1% got the flu. Of the 2,000 children receiving the real vaccine by injection, 15.6% got the flu. The 95% confidence interval for the difference in treatment proportions is:
A) 0.00±0/021
B) 0.055±0.017
C) 0.055±0.024
D) 0.055±0.021
E) 0.00±0.023
A) 0.00±0/021
B) 0.055±0.017
C) 0.055±0.024
D) 0.055±0.021
E) 0.00±0.023
Unlock Deck
Unlock for access to all 42 flashcards in this deck.
Unlock Deck
k this deck
28
One of the most striking human accomplishments is the achievement of intelligible speech by age five. Deficits in speech acquisition often occur when a child has hearing difficulty or does is slow to develop the motor functions associated with speech. Other deficits in speech acquisition are of unknown origin. It has been hypothesized that a family history of speech communication disorder might be a factor in speech delay. The theory is that if members of the family have difficulty communicating, this may increase the probability of a speech deficit in a young family member. A random sample of healthy two-year-olds was followed over the course of a year. At age 3, each child was classified as having a speech delay or not. These data, cross-classified by a family history of speech communication disorder, is given in the table below:
a)At the .05 significance level, do the data provide evidence of the hypothesized developmental differences? Provide statistical evidence for your conclusion.
b)Is this an observational or experimental study? Justify your response in a few sentences.
a)At the .05 significance level, do the data provide evidence of the hypothesized developmental differences? Provide statistical evidence for your conclusion.
b)Is this an observational or experimental study? Justify your response in a few sentences.
Unlock Deck
Unlock for access to all 42 flashcards in this deck.
Unlock Deck
k this deck
29
The report describes the results of a survey of 739 automobile owners age 18 to 29 and 564 automobile owners age 30 to 49 in a certain metropolitan area. Survey participants were asked if they own an automobile that is equipped with an electrical engine; 42% of the automobile owners age 18 to 29 and 36% of the automobile owners age 30 to 49 said "yes". Suppose you want to decide if there is evidence that the proportion of owners of automobiles equipped with electrical engine is different for age 18 to 29 and age 30 to 49.
What is the value of the test statistics and what is the associated P-value? If a significance level of 0.05 is selected for the test, will you reject or fail to reject the null hypothesis?
A) ; ; We reject H0; Assuming that the samples are representative of the populations of interest, we would conclude that the proportion of owners of automobiles equipped with electrical engine differs for age 18 to 29 and age 30 to 49.
B) ; ; We reject H0; Assuming that the samples are representative of the populations of interest, we would conclude that the proportion of owners of automobiles equipped with electrical engine differs for age 18 to 29 and age 30 to 49.
C) ; ; We fail to reject H0; Assuming that the samples are representative of the populations of interest, we would conclude that there is no evidence the proportion of owners of automobiles equipped with electrical engine differs for age 18 to 29 and age 30 to 49.
D) ; ; We fail to reject H0; Assuming that the samples are representative of the populations of interest, we would conclude that there is no evidence the proportion of owners of automobiles equipped with electrical engine differs for age 18 to 29 and age 30 to 49.
E) ; ; We reject H0; Assuming that the samples are representative of the populations of interest, we would conclude that the proportion of owners of automobiles equipped with electrical engine differs for age 18 to 29 and age 30 to 49.
What is the value of the test statistics and what is the associated P-value? If a significance level of 0.05 is selected for the test, will you reject or fail to reject the null hypothesis?
A)
; ; We reject H0; Assuming that the samples are representative of the populations of interest, we would conclude that the proportion of owners of automobiles equipped with electrical engine differs for age 18 to 29 and age 30 to 49.B)
; ; We reject H0; Assuming that the samples are representative of the populations of interest, we would conclude that the proportion of owners of automobiles equipped with electrical engine differs for age 18 to 29 and age 30 to 49.C)
; ; We fail to reject H0; Assuming that the samples are representative of the populations of interest, we would conclude that there is no evidence the proportion of owners of automobiles equipped with electrical engine differs for age 18 to 29 and age 30 to 49.D)
; ; We fail to reject H0; Assuming that the samples are representative of the populations of interest, we would conclude that there is no evidence the proportion of owners of automobiles equipped with electrical engine differs for age 18 to 29 and age 30 to 49.E)
; ; We reject H0; Assuming that the samples are representative of the populations of interest, we would conclude that the proportion of owners of automobiles equipped with electrical engine differs for age 18 to 29 and age 30 to 49. Unlock Deck
Unlock for access to all 42 flashcards in this deck.
Unlock Deck
k this deck
30
An article describes the results of an experiment. Patients with gluten-related disorders were randomly assigned to one of two groups. One group was a control group who received treatment A. Of the 73 patients in this group, 42 reported improvements at the end of the study period. Those in the second group received treatment B. Of the 98 patients in the supplement group, 69 reported improvements at the end of the study period.
Is it possible to use the large-sample z test and the large-sample z confidence interval to draw conclusions about a difference in treatment proportions? Why?
A)It is possible to use the large-sample z test, because the treatment groups are large enough.It is impossible to use the large-sample z confidence interval to draw conclusions, since patients are randomly assigned to the treatment groups.
B)It is impossible to use the large-sample z test, because the treatment groups are not large enough.But it is possible to use the large-sample z confidence interval to draw conclusions, since patients are randomly assigned to the treatment groups.
C)It is impossible to use both the large-sample z test and the large-sample z confidence interval, since the treatment groups are not large enough, and patients are randomly assigned to the treatment groups.
D)It is possible to use both the large-sample z test and the large-sample z confidence interval, since the treatment groups are large enough, and patients are randomly assigned to the treatment groups.
Unlock Deck
Unlock for access to all 42 flashcards in this deck.
Unlock Deck
k this deck
31
A researcher would like to determine if a higher proportion of students than faculty support caps on textbook prices. The researcher gathers a random sample of 500 students and 500 faculty members and asks whether or not they support textbook price caps. Of the 500 students, 378 say they support capping textbook prices and of the 500 faculty members 256 say they support capping prices.
a.What are the hypotheses the researcher should use?
b.Are the assumptions met for a large sample test?
c.What is the P-value for the hypothesis test?
d.What conclusion can be drawn?
a.What are the hypotheses the researcher should use?
b.Are the assumptions met for a large sample test?
c.What is the P-value for the hypothesis test?
d.What conclusion can be drawn?
Unlock Deck
Unlock for access to all 42 flashcards in this deck.
Unlock Deck
k this deck
32
One of the most striking human accomplishments is the achievement of intelligible speech by age five. Deficits in speech acquisition often occur when a child has hearing difficulty or is slow to develop the motor functions associated with speech. Other deficits in speech acquisition are of unknown origin. Males generally develop physiologically at a slower rate than females, and in a recent large study of speech development in young children investigators hypothesized that a greater proportion of boys would have speech deficits for this reason. A random sample of healthy two-year-olds was followed over the course of a year. At age 3, each child was classified as having a speech delay or not. The data by gender is given in the table below:
a)At the .05 significance level, do the data provide evidence of the hypothesized developmental differences? Provide statistical evidence for your conclusion.
b)Is this an observational or experimental study? Justify your response in a few sentences.
a)At the .05 significance level, do the data provide evidence of the hypothesized developmental differences? Provide statistical evidence for your conclusion.
b)Is this an observational or experimental study? Justify your response in a few sentences.
Unlock Deck
Unlock for access to all 42 flashcards in this deck.
Unlock Deck
k this deck
33
An article describes a study of the effectiveness of a fabric device that acts like a support stocking for a weak or damaged heart. In the study, 88 people who consented to treatment were assigned at random to either a standard treatment consisting of drugs or the experimental treatment that consisted of drugs plus surgery to install the stocking. After two years, 32% of the 41 patients receiving the stocking had improved, while 24% of the patients receiving the standard treatment had improved. Do these data provide evidence that the proportion of patients who improve is significantly higher for the experimental treatment than for the standard treatment? After checking to make sure that all of the necessary conditions were met, we calculated the value of the z test statistic to be z = 0.84. Which of the following is the P-value associated with this test?
A)0
B)0.20
C)0.41
D)0.10
E)0.01
A)0
B)0.20
C)0.41
D)0.10
E)0.01
Unlock Deck
Unlock for access to all 42 flashcards in this deck.
Unlock Deck
k this deck
34
An article describes an experiment that investigated if car following behavior for motorcyclists in conditions A is less dangerous than in conditions B. Motorcyclists were randomly assigned to one of two groups. The 60 participants in the first group were placed in conditions A while driving in a simulator. The 60 participants in the second group were placed in conditions B while driving in a simulator. The motorcyclists were instructed to pay attention to neighboring traffic, maintain two car lengths from a virtual lead vehicle, and avoid crashes. Of the motorcyclists from the group A, 38 avoided crashes. Of the motorcyclists from the group B, 17 avoided crashes. Use the given information to construct and interpret a 95% confidence interval for the difference in the proportions of motorcyclists who would avoid crashes.
A)CI: (0.083; 0.517) Because both endpoints of the interval are positive, you would conclude that the proportion of motorcyclists who avoided crashes while driving in conditions A is greater than the proportion of motorcyclists who avoided crashes while driving in conditions B by somewhere between 0.083 and 0.517.
B)CI: (-0.183; 0.517) Because 0 is included in the confidence interval, you would conclude that the proportion of motorcyclists who avoided crashes while driving in conditions A and the proportion of motorcyclists who avoided crashes while driving in conditions B could be equal.
C)CI: (-0.517; 0.083) Because 0 is included in the confidence interval, you would conclude that the proportion of motorcyclists who avoided crashes while driving in conditions A and the proportion of motorcyclists who avoided crashes while driving in conditions B could be equal.
D)CI: (0.183; 0.517) Because both endpoints of the interval are positive, you would conclude that the proportion of motorcyclists who avoided crashes while driving in conditions A is greater than the proportion of motorcyclists who avoided crashes while driving in conditions B by somewhere between 0.183 and 0.517.
E)CI: (-0.517; -0.083) Because both endpoints of the interval are negative, you would conclude that the proportion of motorcyclists who avoided crashes while driving in conditions B is greater the proportion of motorcyclists who avoided crashes while driving in conditions A by somewhere between 0.083 and 0.517.
Unlock Deck
Unlock for access to all 42 flashcards in this deck.
Unlock Deck
k this deck
35
An article describes the results of an experiment. Patients suffering from chronic somatic diseases were randomly assigned to the two groups. One group was a control group of patients who received treatment A. Of the 58 patients in this group, 9 reported improvements at the end of the study period. Patients in the second group received treatment B. Of the 33 patients in this group, 4 reported improvements at the end of the study period.
Do these data provide evidence that the proportion of success for patients who received treatment A differs from the proportion of success for patients who received treatment B? Use a randomization test to select the appropriate output for one set of 1000 simulated proportions and carry out a hypothesis test for a difference in proportions. Use a significance level of 0.05.
A)
The approximate -value is 0.316.Since it is lower than , we reject for a significance level of 0.05 .There is significant difference between the proportion of success for patients who received treatment A and the proportion of success for patients who received treatment B.
B) The approximate -value is 0.655.Since it is greater than , we fail to reject for a significance level of 0.05.There is not convincing evidence that there is difference between the proportion of success for patients who received treatment A and the proportion of success for patients who received treatment B.
C)
The approximate -value is 0.345.Since it is greater than , we reject for a significance level of 0.05.There is significant difference between the proportion of success fot patients who received treatment A and the proportion of success for patients who received treatment B.
D)
The approximate -value is 0.034.Since it is lower than , we reject for a significance level of 0.05.There is significant difference between the proportion of success for patients who received treatment A and the proportion of success for patients who received treatment B.
E)
The approximate -value is 0.966.Since it is greater than , we reject for a significance level of 0.05 .There is not convincing evidence that there is difference between the proportion of success for patients who received treatment A and the proportion of success for patients who received treatment B.
Do these data provide evidence that the proportion of success for patients who received treatment A differs from the proportion of success for patients who received treatment B? Use a randomization test to select the appropriate output for one set of 1000 simulated proportions and carry out a hypothesis test for a difference in proportions. Use a significance level of 0.05.
A)
The approximate -value is 0.316.Since it is lower than , we reject for a significance level of 0.05 .There is significant difference between the proportion of success for patients who received treatment A and the proportion of success for patients who received treatment B.B)
The approximate -value is 0.655.Since it is greater than , we fail to reject for a significance level of 0.05.There is not convincing evidence that there is difference between the proportion of success for patients who received treatment A and the proportion of success for patients who received treatment B.C)
The approximate
-value is 0.345.Since it is greater than , we reject for a significance level of 0.05.There is significant difference between the proportion of success fot patients who received treatment A and the proportion of success for patients who received treatment B.D)
The approximate
-value is 0.034.Since it is lower than , we reject for a significance level of 0.05.There is significant difference between the proportion of success for patients who received treatment A and the proportion of success for patients who received treatment B.E)
The approximate
-value is 0.966.Since it is greater than , we reject for a significance level of 0.05 .There is not convincing evidence that there is difference between the proportion of success for patients who received treatment A and the proportion of success for patients who received treatment B. Unlock Deck
Unlock for access to all 42 flashcards in this deck.
Unlock Deck
k this deck
36
An article describes the results of an experiment. Students were randomly assigned to the two groups. One group was a control group of students who used source A while preparing for the test. Of the 54 students in this group, 31 passed the test. Those in the second group used source B while preparing for the test. Of the 48 students in the supplement group, 17 passed the test. Construct and interpret a 95% confidence interval for the difference in the proportion of students who passed the test using source A and the proportion of students who passed the test using source B.
A)CI: ; Because both endpoints of the interval are negative, you would conclude that the proportion of students who passed the test using source B is greater than the proportion of students who passed the test using source A by somewhere between 0.139 and 0.301.
B)CI: ; Because both endpoints of the interval are negative, you would conclude that the proportion of students who passed the test using source B is greater than the proportion of students who passed the test using source A by somewhere between 0.031 and 0.409.
C)CI: ; Because 0 is included in the confidence interval, you can conclude that the proportion of students who passed the test using source A and the proportion of students who passed the test using source B could be equal.
D)CI: ; Because both endpoints of the interval are positive, you would conclude that the proportion of students who passed the test using source A is greater than the proportion of students who passed the test using source B by somewhere between 0.031 and 0.409.
E)CI: ; Because both endpoints of the interval are positive, you would conclude that the proportion of students who passed the test using source A is greater than the proportion of students who passed the test using source B by somewhere between 0.139 and 0.301.
A)CI:
; Because both endpoints of the interval are negative, you would conclude that the proportion of students who passed the test using source B is greater than the proportion of students who passed the test using source A by somewhere between 0.139 and 0.301.B)CI:
; Because both endpoints of the interval are negative, you would conclude that the proportion of students who passed the test using source B is greater than the proportion of students who passed the test using source A by somewhere between 0.031 and 0.409.C)CI:
; Because 0 is included in the confidence interval, you can conclude that the proportion of students who passed the test using source A and the proportion of students who passed the test using source B could be equal.D)CI:
; Because both endpoints of the interval are positive, you would conclude that the proportion of students who passed the test using source A is greater than the proportion of students who passed the test using source B by somewhere between 0.031 and 0.409.E)CI:
; Because both endpoints of the interval are positive, you would conclude that the proportion of students who passed the test using source A is greater than the proportion of students who passed the test using source B by somewhere between 0.139 and 0.301. Unlock Deck
Unlock for access to all 42 flashcards in this deck.
Unlock Deck
k this deck
37
A study is conducted at a university to determine if it's test-preparation seminar improves the proportion of students who pass the AP Statistics exam. The following summary data were obtained. Is there evidence to support the claim that the proportion of passing grades is higher for those who attended the seminar? Compute the test statistic for this test.
A)2.182
B)0.0145
C)1.976
D)1.847
Is there evidence to support the claim that the proportion of passing grades is higher for those who attended the seminar? Compute the test statistic for this test.A)2.182
B)0.0145
C)1.976
D)1.847
Unlock Deck
Unlock for access to all 42 flashcards in this deck.
Unlock Deck
k this deck
38
In many animal societies, a role assumed by the adult male is a sentry, warning adult females and juveniles of approaching predators. Some students of animal behavior believe that this occurs in human society also. In one 4-month study in Seattle an investigator observed people crossing the street at an intersection with no traffic control. The observed behavior was the scanning behavior ("looking both ways") of adult males and females. The investigator reasoned that if the adult male assumed a protective sentry role, the scanning rate when alone would be less than when accompanied by an adult female. Data from this study is given below. Do these data support the investigator's hypothesis that the male scanning rate would be greater when accompanied by a female? Assume that is reasonable to regard these samples as representative of the corresponding populations. Provide statistical justification for your answer.
Do these data support the investigator's hypothesis that the male scanning rate would be greater when accompanied by a female? Assume that is reasonable to regard these samples as representative of the corresponding populations. Provide statistical justification for your answer. Unlock Deck
Unlock for access to all 42 flashcards in this deck.
Unlock Deck
k this deck
39
Would it be appropriate to use large sample hypothesis testing procedures for the following dataset? Why or why not?
A random sample of 45 people was asked to indicate if they would return a lost wallet. Of the 45 sampled, 39 indicated that they would return the wallet.
A random sample of 45 people was asked to indicate if they would return a lost wallet. Of the 45 sampled, 39 indicated that they would return the wallet.
Unlock Deck
Unlock for access to all 42 flashcards in this deck.
Unlock Deck
k this deck
40
An article describes the results of an experiment. Students of WEB programming courses were randomly assigned to the two groups. One group was a control group of students who were trained by the teacher A. Of the 69 students in this group, 17 passed the final exam. Those in the second group were trained by the teacher B. Of the 131 students in the supplement group, 9 passed the final exam.
Based on the given data, what can you learn about the difference in the proportion of students who passed the exam after being trained by the teacher A and those who passed the exam after being trained by the teacher B? Calculate and interpret a 95% bootstrap confidence interval for the difference in proportions.
A)The 95% confidence interval based on the bootstrap resampling is (0.068; 0.288).Based on the data from this experiment, you can be 95% confident that the actual difference in the proportions of students who passed the exam after being trained by the teacher A and those who passed the exam after being trained by the teacher B is between 0.068 and 0.288.Both endpoints of the interval are positive, and you can conclude that the proportion of students who passed the exam after being trained by the teacher A is greater than the proportion of students who passed the exam after being trained by the teacher B.
B)The 95% confidence interval based on the bootstrap resampling is (-0.068; 0.288).Based on the data from this experiment, you can be 95% confident that the actual difference in the proportions of students who passed the exam after being trained by the teacher A and those who passed the exam after being trained by the teacher B is between -0.068 and 0.288.Zero is contained in this interval, indicating that it is plausible that there is no difference in the population proportions.
C)The 95% confidence interval based on the bootstrap resampling is (-0.288; 0.068).Based on the data from this experiment, you can be 95% confident that the actual difference in the proportions of students who passed the exam after being trained by the teacher A and those who passed the exam after being trained by the teacher B is between -0.228 and 0.068.Zero is contained in this interval, indicating that it is plausible that there is no difference in the population proportions.
D)The 95% confidence interval based on the bootstrap resampling is (-0.228; -0.068).Based on the data from this experiment, you can be 95% confident that the actual difference in the proportions of students who passed the exam after being trained by the teacher A and those who passed the exam after being trained by the teacher B is between -0.228 and -0.068.Both endpoints of the interval are negative, you can conclude that the proportion of students who passed the exam after being trained by the teacher A is greater than the proportion of students who passed the exam after being trained by the teacher B.
E)The 95% confidence interval based on the bootstrap resampling is (-0.228; -0.068).Based on the data from this experiment, you can be 95% confident that the actual difference in the proportions of students who passed the exam after being trained by the teacher A and those who passed the exam after being trained by the teacher B is between -0.228 and -0.068.Both endpoints of the interval are negative, you can conclude that the proportion of students who passed the exam after being trained by the teacher B is greater than the proportion of students who passed the exam after being trained by the teacher A.
Unlock Deck
Unlock for access to all 42 flashcards in this deck.
Unlock Deck
k this deck
41
A researcher would like to determine if the proportion of patients who indicate that they are happy with a hospital emergency room service is significantly different for those who receive treatment from a female nurse rather than a male nurse. As patients are admitted for treatment, they are randomly assigned to a nurse and prior to discharge are asked to indicate if they were happy or unhappy with the treatment they received. The following results were obtained:
Female Nurse
Male Nurse
n = 35
n = 35
Number Happy: 21
Number Happy: 22
Find a 99% confidence interval for the difference of treatment proportions.
Female Nurse
Male Nurse
n = 35
n = 35
Number Happy: 21
Number Happy: 22
Find a 99% confidence interval for the difference of treatment proportions.
Unlock Deck
Unlock for access to all 42 flashcards in this deck.
Unlock Deck
k this deck
42
A researcher would like to determine if the proportion of patients who indicate that they are happy with a hospital emergency room service is significantly different for those who receive treatment from a female nurse rather than a male nurse. As patients are admitted for treatment, they are randomly assigned to a nurse and prior to discharge are asked to indicate if they were happy or unhappy with the treatment they received. The following results were obtained:
Female Nurse
Male Nurse
n = 35
n = 35
Number Happy: 21
Number Happy: 22
Perform a hypothesis test to determine if a significant difference exists.
Female Nurse
Male Nurse
n = 35
n = 35
Number Happy: 21
Number Happy: 22
Perform a hypothesis test to determine if a significant difference exists.
Unlock Deck
Unlock for access to all 42 flashcards in this deck.
Unlock Deck
k this deck
Unlock Deck
Unlock for access to all 42 flashcards in this deck.


