Deck 14: Learning From Categorical Data
Full screen (f)
Question
Exhibit 11-1
In baseball, hits can be one of four types: singles, doubles, triples, or home runs. In the last baseball season, 64% of the hits were singles, 20% were doubles, 2% were triples, and 14% were home runs.
Spring training games are played in March before the regular season to help the players get in shape. A sports writer thinks that perhaps the distribution of types of hits is different in these games. The sportswriter gathers a random sample of 251 hits from spring training games. Here is the distribution of types of hits for these games:
Refer to Exhibit 11-1. At the .05 level of significance, test the hypothesis that the proportions of the different types of hits in the spring is the same as for last year's season.
Question
Question
Question
Question
Question
Question
Question
A random sample of 120 sixth-graders were asked to pick their preference from five different flavors of ice cream. the results are show below.  A hypothesis test will be carried out to determine if there is evidence that the five flavors are not equally preferred. The test statistic will have a chi-square distribution with how many degrees of freedom (df)?
A)3
B)4
C)5
D)8
E)119
A hypothesis test will be carried out to determine if there is evidence that the five flavors are not equally preferred. The test statistic will have a chi-square distribution with how many degrees of freedom (df)?A)3
B)4
C)5
D)8
E)119
Question
Question
Each person in a random sample of 105 ice cream eaters was asked to "vote for" a preferred flavor from the flavors listed in the table below. 
What is the value of the test statistic for the hypothesis that, given these flavor choices, ice cream eaters have no flavor preference?
A)1.00
B)8.01
C)2.55
D)4.67
E)2.14
What is the value of the test statistic for the hypothesis that, given these flavor choices, ice cream eaters have no flavor preference?
A)1.00
B)8.01
C)2.55
D)4.67
E)2.14
Question
Question
Question
What is the approximate P-value for  and df = 5?
A)0.095
B)0.020
C)0.057
D)0.088
E)0.040
and df = 5? A)0.095
B)0.020
C)0.057
D)0.088
E)0.040
Question
Does including a gift with a request for a donation influence the proportion who will make a donation? This question was investigated in a recent study. Letters were sent to a large number of potential donors in Japan. The letter requested a donation for funding schools in Mali. The letter recipients were assigned at random to one of three groups. Those in the first group received a letter with no gift. Those in the second group received a letter that included a small gift (a postcard), and those in the third group received a letter with a larger gift (four postcards). The response of interest was whether or not the letter resulted in a donation.  We wish to perform a hypothesis test to determine if there is convincing evidence that the proportions for the two donation categories are not the same for all three types of requests.What is the value of the test statistic for this test?
A)12.388
B)5.207
C)9.502
D)11.411
E)14.141
We wish to perform a hypothesis test to determine if there is convincing evidence that the proportions for the two donation categories are not the same for all three types of requests.What is the value of the test statistic for this test?A)12.388
B)5.207
C)9.502
D)11.411
E)14.141
Question
Exhibit 11-1
In baseball, hits can be one of four types: singles, doubles, triples, or home runs. In the last baseball season, 64% of the hits were singles, 20% were doubles, 2% were triples, and 14% were home runs.
Spring training games are played in March before the regular season to help the players get in shape. A sports writer thinks that perhaps the distribution of types of hits is different in these games. The sportswriter gathers a random sample of 251 hits from spring training games. Here is the distribution of types of hits for these games:
Refer to Exhibit 11-1. Write a short paragraph that could be added to a popular baseball magazine that explains your results. Since your audience cannot be assumed to know any statistics, you must explain your conclusions and reasoning in "plain English."
Question
Question
Each person in a random sample of 54 students living in the dorms at a large university was asked whether he or she preferred to study in the dorm room, in the dorm's study lounge, or at the university library. The resulting data is summarized in the table below.  In a hypothesis test to determine if there is evidence that the three locations are not equally preferred by students at the university who live in the dorms, what is the expected count for the library category?
A)10
B)12
C)18
D)54
E)20
In a hypothesis test to determine if there is evidence that the three locations are not equally preferred by students at the university who live in the dorms, what is the expected count for the library category?A)10
B)12
C)18
D)54
E)20
Question
A local newspaper asked each person in a random sample of 44 subscribers which section of the paper he or she read first. The resulting data are shown in the accompanying table.  A chi-square test is to be performed to determine if the data provides evidence that the proportions choosing each of the sections are not the same. If the null hypothesis is that there is no difference in the proportions, what is the expected frequency of those who read the Business section first?
A)8
B)44
C)11
D)4
E)There is not enough information to determine the expected frequency.
A chi-square test is to be performed to determine if the data provides evidence that the proportions choosing each of the sections are not the same. If the null hypothesis is that there is no difference in the proportions, what is the expected frequency of those who read the Business section first?A)8
B)44
C)11
D)4
E)There is not enough information to determine the expected frequency.
Question
Use a calculator to determine which of the following combinations of  and df has a P-value of 0.130.
A)
B)
C)
D)
E)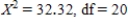
and df has a P-value of 0.130. A)
B)
C)
D)
E)
Question
Each person in a random sample of university students was asked which of five flavors of ice cream he or she preferred. The resulting data was used to test the null hypothesis  . The P-value associated with this test was 0.067. If a significance level of 0.05 is used for the test, which of the following is an appropriate conclusion?
A)Fail to reject , there is convincing evidence that there is no preference for one flavor of ice cream over another.
B)Fail to reject , there is not convincing evidence that there is a preference for one flavor of ice cream over another.
C)Reject , there is convincing evidence that there is no preference for one flavor of ice cream over another.
D)Reject , there is convincing evidence that there is a preference for one flavor of ice cream over another.
E)Based on the information given, it is not possible to determine whether should be rejected or not.
. The P-value associated with this test was 0.067. If a significance level of 0.05 is used for the test, which of the following is an appropriate conclusion? A)Fail to reject
, there is convincing evidence that there is no preference for one flavor of ice cream over another.B)Fail to reject
, there is not convincing evidence that there is a preference for one flavor of ice cream over another.C)Reject
, there is convincing evidence that there is no preference for one flavor of ice cream over another.D)Reject
, there is convincing evidence that there is a preference for one flavor of ice cream over another.E)Based on the information given, it is not possible to determine whether
should be rejected or not. Question
Question
Juvenile free-living ground squirrels utilize responses known as "alarm calls;" that is, vocalizations elicited by a predator. These calls can alert others to danger from a predator. Newly weaned squirrels emerge from the nest at about 25 days of age and enter a noisier world than they are used to. Do the squirrels emerge with automatic responses to alarm signals, or are the responses learned? To answer this question, a biologist played recordings of alarm calls for three populations (by age) of squirrels and observed the squirrels' responses. She reasoned that if the responses were not different for the different age groups, the squirrels must be responding by instinct. On the other hand, if the responses differ with the age of the squirrels the young squirrels must be learning to respond to the alarm calls. Her data for the responses to a whistle chorus, categorized by age, is presented below: 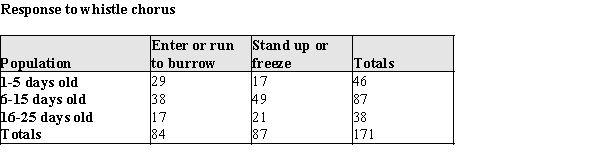 Is there convincing evidence that the responses to a chorus of whistles are different for the different age groups? Test the relevant hypothesis at the .05 level.
Is there convincing evidence that the responses to a chorus of whistles are different for the different age groups? Test the relevant hypothesis at the .05 level. Question
Scandinavian researchers investigated the effects of hunting male bears on succeeding generations. (The effects of hunting females on successive generations are well documented.) They hypothesized that when a male is killed a new male will move in, and maximize his reproductive success by killing existing cubs (so that the females will conceive sooner.) A random sample of radio tagged females was monitored and data on the number of bear cubs surviving 1.5 years were gathered. In the southern area, hunters killed bears legally; in the northern area, no hunting took place. The data on cub survival in this sample are reproduced below. The researcher suspects an association between the location of the females and cub survival. 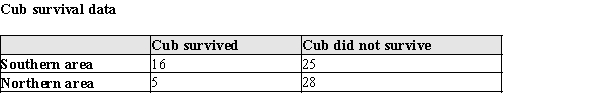
a)What is the appropriate null hypothesis for this investigation? (You may state this hypothesis in ordinary English if you wish.)b)Using the hypothesis from part (a), test the null hypothesis using the appropriate chi-square procedure.
a)What is the appropriate null hypothesis for this investigation? (You may state this hypothesis in ordinary English if you wish.)b)Using the hypothesis from part (a), test the null hypothesis using the appropriate chi-square procedure.
Question
Some people believe that criminals who plead guilty will, on average, get lighter sentences. The following table summarizes data from a random sample of San Francisco defendants in burglary cases.  If the null hypothesis is that the plea and the sentencing fate are independent, perform the calculations to find the expected number of individuals who plead not guilty and are sent to prison. Show your work.
If the null hypothesis is that the plea and the sentencing fate are independent, perform the calculations to find the expected number of individuals who plead not guilty and are sent to prison. Show your work. Question
Black bears (Ursus americanus), and their use of National Parks can be a problem for humans. Bear travels are governed by the need for food, as well as a high degree of natural curiosity. Some humans inadvertently or purposefully feed the bears, leading them to harass the human population. When bears become troublesome, one strategy is to transplant them--that is, take them far from home and hope they don't find their way back. In a study of the success of this transplantation strategy, researchers kept track of the troublesome bears' fate over the course of a 10-year period of transplantations. One question of interest was whether the strategy worked equally well for "experienced" and "inexperienced" bears. "Experienced" bears are bears being transplanted a second time after wandering back and being troublesome again. The relevant data are presented in the table below. 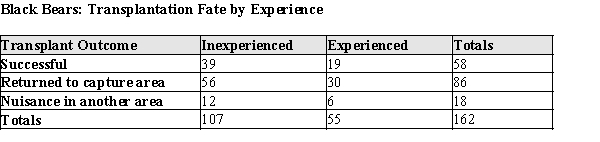 Test the hypothesis that the transplant outcome and the "experience level" of the population of troublesome bears are independent. For purposes of this question, you may assume that the captured bears are a random sample of the troublesome bear population.
Test the hypothesis that the transplant outcome and the "experience level" of the population of troublesome bears are independent. For purposes of this question, you may assume that the captured bears are a random sample of the troublesome bear population. Question
A question of interest to game managers is the hunting strategy of predators. Do they just take the first prey that comes along, or are the selective? In a study of winter prey selection in a National Park, radio-tagged wolves were observed to have killed prey according to the table below. Wolves were identified as the predators by their tracks in the snow. At the most recent census in the National Park there were about 3,500 white-tailed deer, 1,000 elk, and 500 moose. 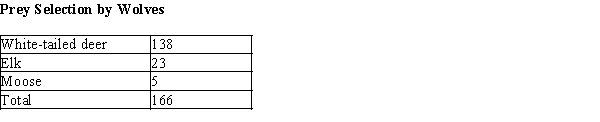 Do these data provide sufficient evidence at the .05 level that the wolves are not selecting their prey at random? That is, is there evidence that the proportion of deer, elk, and moose killed by wolves are not in the same proportion as in the park population? Justify your response with an appropriate statistical analysis.
Do these data provide sufficient evidence at the .05 level that the wolves are not selecting their prey at random? That is, is there evidence that the proportion of deer, elk, and moose killed by wolves are not in the same proportion as in the park population? Justify your response with an appropriate statistical analysis. Question
Identify situation when the chi-square goodness-of-fit test is appropriate.
A)Student investigates the distribution of people with different ABO types of blood.He generates random sample of people and obtains following distribution of types.
B)Student wants to know what kind of movies do young people in his city prefer.He asks random people of his faculty in the University about the favorite movie genre and obtains following results.
C)Student carries out the study about the factors involved into the market price creation.First, he needs to know the distribution of the prices for some certain good.He takes a random sample of prices of the ice-cream in the different areas of his city.He obtains following information.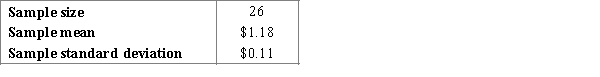
D)Student wants to know what kind of dog breeds do people in his dog club prefer.He generates the representative random sample of the people in his club asking about their favorite dog breed and obtains following results.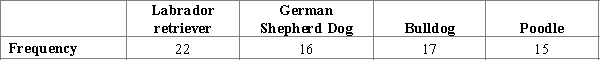
Question
As every airline passenger knows, there are never enough armrests! Over the course of 20 flights occurring over a variety of weekdays, nights, and weekends, researchers selected a random sample of passengers that had been seated next to individuals of opposite gender. The passengers were surveyed as they left the boarding area. The researchers were interested in the level of agitation felt when their "seat-mate" used the common armrest. Only one person was randomly selected to be interviewed from a seat-mate pair, and couples were excluded from the survey. The question of interest was whether males and females are equally bothered by their opposite gender's use of the common armrest. The table below summarizes data gathered from interviewing the passengers. 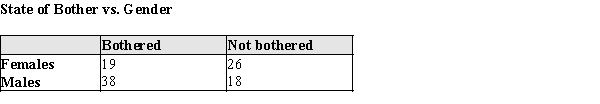
a)What is the appropriate null hypothesis for this investigation? (You may state this hypothesis in ordinary English if you wish.)b)Using the hypothesis from part (a), test the null hypothesis using the appropriate chi-square procedure.
a)What is the appropriate null hypothesis for this investigation? (You may state this hypothesis in ordinary English if you wish.)b)Using the hypothesis from part (a), test the null hypothesis using the appropriate chi-square procedure.
Question
Question
Some people believe that criminals who plead guilty will, on average, get lighter sentences. The following table summarizes data from a random sample of San Francisco defendants in burglary cases. 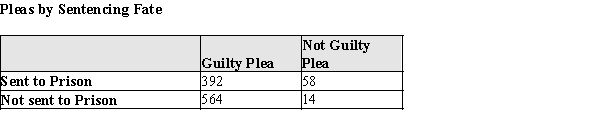 If the null hypothesis is that the plea and the sentencing fate are independent, perform the calculations to find the expected number of individuals who plead guilty and are sent to prison. Show your work.
If the null hypothesis is that the plea and the sentencing fate are independent, perform the calculations to find the expected number of individuals who plead guilty and are sent to prison. Show your work. Question
The authorship of ancient writings is frequently in dispute. One method for judging authorship of writings from the Classical Greek period is to analyze the proportion of sentences containing the word, γα'ρ. (γα'ρ is an article, something like "a," "an," and "the" in English.) If a particular collection of works has markedly different frequencies of use of γα'ρ, this would be considered evidence against the same author having written all the works.
In the table below, data from random samples of 200 sentences each from 4 works are presented. The alleged author is one Philo Judaeus , a philosopher writing in ancient Alexandria, Egypt.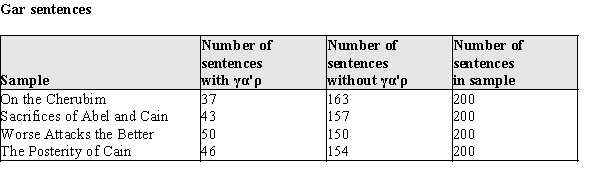
a)At the .05 level of significance, test the hypothesis that the frequencies of the use of γα'ρ is the same for these 4 works.
b)Write a short paragraph that could be added to a history or Classics Studies textbook that explains your results. Since your audience cannot be assumed to know any statistics, you must explain your conclusions and reasoning in, so to speak, "plain English."
Question
Question
A question of interest to game managers is the hunting strategy of predators. Do they just take the first prey that comes along, or are the selective? In a study of winter prey selection in a National Park, radio-tagged cougars were observed to have killed prey according to the table below. At the most recent census in the National Park there were about 3,500 white-tailed deer, 1,000 elk, and 500 moose. 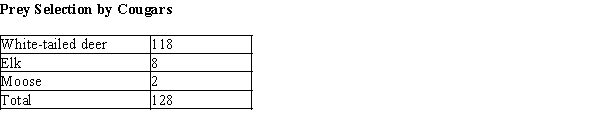 Do these data provide sufficient evidence at the .05 level that the cougars are not selecting their prey at random? That is, is there evidence that the proportion of deer, elk, and moose killed by cougars are not in the same proportion as in the park population? Justify your response with an appropriate statistical analysis.
Do these data provide sufficient evidence at the .05 level that the cougars are not selecting their prey at random? That is, is there evidence that the proportion of deer, elk, and moose killed by cougars are not in the same proportion as in the park population? Justify your response with an appropriate statistical analysis. Question
Black bears (Ursus americanus), and their use of National Parks can be a problem for humans. Bear travels are governed by the need for food, as well as a high degree of natural curiosity. Some humans inadvertently or purposefully feed the bears, leading them to harass the human population. When bears become troublesome, one strategy is to transplant them--that is, take them far from home and hope they don't find their way back. In a study of the success of this transplantation strategy, researchers kept track of the troublesome bears' fate over the course of a 10-year period of transplantations. One question of interest was whether the strategy worked equally well for male and female bears. The relevant data are presented in the table below. 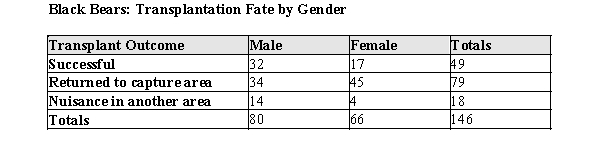 Test the hypothesis that the transplant outcome and the gender of the population of troublesome bears are independent. For purposes of this question, you may assume that the captured bears are a random sample of the troublesome bear population.
Test the hypothesis that the transplant outcome and the gender of the population of troublesome bears are independent. For purposes of this question, you may assume that the captured bears are a random sample of the troublesome bear population. Question
The authorship of ancient writings is frequently in dispute. One method for judging authorship of writings from the Classical Greek period is to analyze the proportion of sentences containing the word, γα'ρ. (γα'ρ is an article, something like "a," "an," and "the" in English.) If a particular collection of works has markedly different frequencies of use of γα'ρ, this would be considered evidence against the same author having written all the works.
In the table below, data from random samples of 200 sentences each from 4 works are presented. The alleged author of these works is Xenophon (c. 428 -
c.45 BCE), a Greek soldier.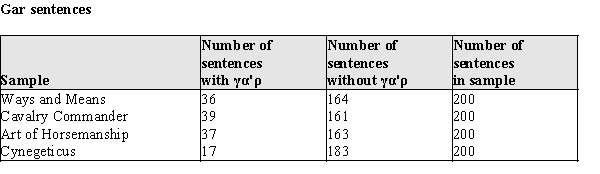 a)At the .05 level of significance, test the hypothesis that the frequencies of the use of γα'ρ is the same for these 4 works.b)Write a short paragraph that could be added to a history or Classics Studies textbook that explains your results.Since your audience cannot be assumed to know any statistics, you must explain your conclusions and reasoning in, so to speak, "plain English."
In the table below, data from random samples of 200 sentences each from 4 works are presented. The alleged author of these works is Xenophon (c. 428 -
c.45 BCE), a Greek soldier.
a)At the .05 level of significance, test the hypothesis that the frequencies of the use of γα'ρ is the same for these 4 works.b)Write a short paragraph that could be added to a history or Classics Studies textbook that explains your results.Since your audience cannot be assumed to know any statistics, you must explain your conclusions and reasoning in, so to speak, "plain English." Question
Juvenile free-living ground squirrels utilize responses known as "alarm calls;" that is, vocalizations elicited by a predator. These calls can alert others to danger from a predator. Newly weaned squirrels emerge from the nest at about 25 days of age and enter a noisier world than they are used to. Do the squirrels emerge with automatic responses to alarm signals, or are the responses learned? To answer this question, a biologist played recordings of alarm calls for three populations (by age) of squirrels and observed the squirrels' responses. She reasoned that if the responses were not different for the different age groups, the squirrels must be responding by instinct. On the other hand, if the responses differ with the age of the squirrels the young squirrels must be learning to respond to the alarm calls. Her data for the responses to a whistle chorus, categorized by age, is presented below: 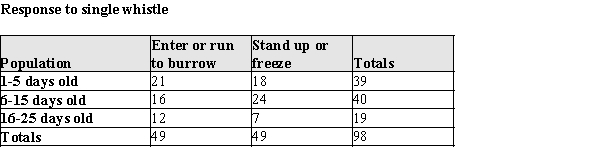 Is there convincing evidence that the responses to a single whistle is different for the different age groups? Test the relevant hypothesis at the .05 level.
Is there convincing evidence that the responses to a single whistle is different for the different age groups? Test the relevant hypothesis at the .05 level.
Unlock Deck
Sign up to unlock the cards in this deck!
Unlock Deck
Unlock Deck
1/36
Play
Full screen (f)
Deck 14: Learning From Categorical Data
1
Exhibit 11-1
In baseball, hits can be one of four types: singles, doubles, triples, or home runs. In the last baseball season, 64% of the hits were singles, 20% were doubles, 2% were triples, and 14% were home runs.
Spring training games are played in March before the regular season to help the players get in shape. A sports writer thinks that perhaps the distribution of types of hits is different in these games. The sportswriter gathers a random sample of 251 hits from spring training games. Here is the distribution of types of hits for these games:
Refer to Exhibit 11-1. At the .05 level of significance, test the hypothesis that the proportions of the different types of hits in the spring is the same as for last year's season.
1)p1 = the true proportion of spring training hits that are singles
p2 = the true proportion of spring training hits that are doubles
p3 = the true proportion of spring training hits that are triples
p4 = the true proportion of spring training hits that are home runs
2)H0 : p1 = .64, p2 = .20, p3 = .02, p4 = .14
3)Ha : H0 isn't true
4)α = .05
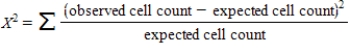
5)
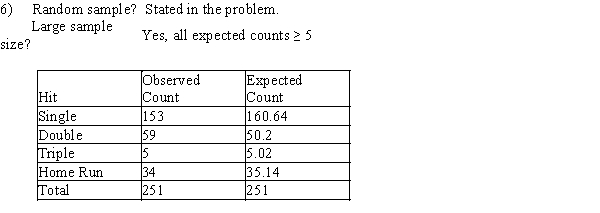
7)X2 = 1.94 df = 3
8)P-value = P(X2 > 1.94) > .100
9)Since the P-value > α, we fail to reject H0. We cannot conclude that the proportions of different types of hits in spring training is different than last year's season.
p2 = the true proportion of spring training hits that are doubles
p3 = the true proportion of spring training hits that are triples
p4 = the true proportion of spring training hits that are home runs
2)H0 : p1 = .64, p2 = .20, p3 = .02, p4 = .14
3)Ha : H0 isn't true
4)α = .05
5)
7)X2 = 1.94 df = 3
8)P-value = P(X2 > 1.94) > .100
9)Since the P-value > α, we fail to reject H0. We cannot conclude that the proportions of different types of hits in spring training is different than last year's season.
2
For a sample size n, there are n − 1 degrees of freedom associated with the goodness-of-fit test statistic, X2.
False
3
In order to decide whether the observed data is compatible with the null hypothesis, the observed cell counts are compared to the cell counts that would be expected when the alternative hypothesis is true.
False
4
The expected cell count for the row a and column b entry in a bivariate contingency table is equal to the product of the row a and column b marginal totals.
Unlock Deck
Unlock for access to all 36 flashcards in this deck.
Unlock Deck
k this deck
5
For the chi-squared goodness-of-fit chi-squared test, the associated P-value is the area under the appropriate chi-squared curve to the left of the calculated value of X2.
Unlock Deck
Unlock for access to all 36 flashcards in this deck.
Unlock Deck
k this deck
6
A chi-squared goodness-of-fit can be used to test hypotheses about the proportion of the population falling into each of the possible categories.
Unlock Deck
Unlock for access to all 36 flashcards in this deck.
Unlock Deck
k this deck
7
The row and column marginal totals provide information on the distribution of the observed values for each of the two variables defining the contingency table.
Unlock Deck
Unlock for access to all 36 flashcards in this deck.
Unlock Deck
k this deck
8
A random sample of 120 sixth-graders were asked to pick their preference from five different flavors of ice cream. the results are show below. A hypothesis test will be carried out to determine if there is evidence that the five flavors are not equally preferred. The test statistic will have a chi-square distribution with how many degrees of freedom (df)?
A)3
B)4
C)5
D)8
E)119
A hypothesis test will be carried out to determine if there is evidence that the five flavors are not equally preferred. The test statistic will have a chi-square distribution with how many degrees of freedom (df)?A)3
B)4
C)5
D)8
E)119
Unlock Deck
Unlock for access to all 36 flashcards in this deck.
Unlock Deck
k this deck
9
The chi-squared test statistic, X2, measures the extent to which the observed cell counts differ from those expected when H0 is true.
Unlock Deck
Unlock for access to all 36 flashcards in this deck.
Unlock Deck
k this deck
10
Each person in a random sample of 105 ice cream eaters was asked to "vote for" a preferred flavor from the flavors listed in the table below.
What is the value of the test statistic for the hypothesis that, given these flavor choices, ice cream eaters have no flavor preference?
A)1.00
B)8.01
C)2.55
D)4.67
E)2.14
What is the value of the test statistic for the hypothesis that, given these flavor choices, ice cream eaters have no flavor preference?
A)1.00
B)8.01
C)2.55
D)4.67
E)2.14
Unlock Deck
Unlock for access to all 36 flashcards in this deck.
Unlock Deck
k this deck
11
The chi-squared test statistic for testing independence in a two-way tables has rc − 1 degrees of freedom.
Unlock Deck
Unlock for access to all 36 flashcards in this deck.
Unlock Deck
k this deck
12
Suppose that we are studying the purchasing behavior of individuals buying dog food. We hypothesize that half the dog food purchases will be the big name brand, "Lassie Chow" and that the remaining purchases will be divided equally between two local brands, "Bow Wow Chow" and "Woof Woof Wafers."
a)Define appropriate statistical variables, and use them to state the null and alternative hypothesis that would be used to decide if there was convincing evidence against the hypothesized distribution of purchases across the three brands.
b)Suppose that each individual in a random sample of 200 purchasers provides information about his or her choice of brand. For each category, what are the expected values?
c)How many degrees of freedom are associated with the chi-squared goodness-of-fit statistic?
d)Suppose that X2 = 6.10. What can be said about the P-value for this hypothesis test?
Unlock Deck
Unlock for access to all 36 flashcards in this deck.
Unlock Deck
k this deck
13
What is the approximate P-value for and df = 5?
A)0.095
B)0.020
C)0.057
D)0.088
E)0.040
and df = 5? A)0.095
B)0.020
C)0.057
D)0.088
E)0.040
Unlock Deck
Unlock for access to all 36 flashcards in this deck.
Unlock Deck
k this deck
14
Does including a gift with a request for a donation influence the proportion who will make a donation? This question was investigated in a recent study. Letters were sent to a large number of potential donors in Japan. The letter requested a donation for funding schools in Mali. The letter recipients were assigned at random to one of three groups. Those in the first group received a letter with no gift. Those in the second group received a letter that included a small gift (a postcard), and those in the third group received a letter with a larger gift (four postcards). The response of interest was whether or not the letter resulted in a donation. We wish to perform a hypothesis test to determine if there is convincing evidence that the proportions for the two donation categories are not the same for all three types of requests.What is the value of the test statistic for this test?
A)12.388
B)5.207
C)9.502
D)11.411
E)14.141
We wish to perform a hypothesis test to determine if there is convincing evidence that the proportions for the two donation categories are not the same for all three types of requests.What is the value of the test statistic for this test?A)12.388
B)5.207
C)9.502
D)11.411
E)14.141
Unlock Deck
Unlock for access to all 36 flashcards in this deck.
Unlock Deck
k this deck
15
Exhibit 11-1
In baseball, hits can be one of four types: singles, doubles, triples, or home runs. In the last baseball season, 64% of the hits were singles, 20% were doubles, 2% were triples, and 14% were home runs.
Spring training games are played in March before the regular season to help the players get in shape. A sports writer thinks that perhaps the distribution of types of hits is different in these games. The sportswriter gathers a random sample of 251 hits from spring training games. Here is the distribution of types of hits for these games:
Refer to Exhibit 11-1. Write a short paragraph that could be added to a popular baseball magazine that explains your results. Since your audience cannot be assumed to know any statistics, you must explain your conclusions and reasoning in "plain English."
Unlock Deck
Unlock for access to all 36 flashcards in this deck.
Unlock Deck
k this deck
16
Suppose that we are studying the purchasing behavior of individuals buying breakfast oatmeal. We hypothesize that half the cereal purchases will be the big name brand, "Seabiscuit Oats" and that the remaining purchases will be divided equally between two local brands, "Secretariat Oats" and "Whirlaway Oats."
a)Define appropriate statistical variables, and use them to state the null and alternative hypothesis that would be used to decide if there was convincing evidence against the hypothesized distribution of purchases across the three brands.
b)Suppose that each individual in a random sample of 200 purchasers provides information about his or her choice of brand. For each category, what are the expected values?
c)How many degrees of freedom are associated with the chi-squared goodness-of-fit statistic?
d)Suppose that X2 = 6.10. What can be said about the P-value for this hypothesis test?
Unlock Deck
Unlock for access to all 36 flashcards in this deck.
Unlock Deck
k this deck
17
Each person in a random sample of 54 students living in the dorms at a large university was asked whether he or she preferred to study in the dorm room, in the dorm's study lounge, or at the university library. The resulting data is summarized in the table below. In a hypothesis test to determine if there is evidence that the three locations are not equally preferred by students at the university who live in the dorms, what is the expected count for the library category?
A)10
B)12
C)18
D)54
E)20
In a hypothesis test to determine if there is evidence that the three locations are not equally preferred by students at the university who live in the dorms, what is the expected count for the library category?A)10
B)12
C)18
D)54
E)20
Unlock Deck
Unlock for access to all 36 flashcards in this deck.
Unlock Deck
k this deck
18
A local newspaper asked each person in a random sample of 44 subscribers which section of the paper he or she read first. The resulting data are shown in the accompanying table. A chi-square test is to be performed to determine if the data provides evidence that the proportions choosing each of the sections are not the same. If the null hypothesis is that there is no difference in the proportions, what is the expected frequency of those who read the Business section first?
A)8
B)44
C)11
D)4
E)There is not enough information to determine the expected frequency.
A chi-square test is to be performed to determine if the data provides evidence that the proportions choosing each of the sections are not the same. If the null hypothesis is that there is no difference in the proportions, what is the expected frequency of those who read the Business section first?A)8
B)44
C)11
D)4
E)There is not enough information to determine the expected frequency.
Unlock Deck
Unlock for access to all 36 flashcards in this deck.
Unlock Deck
k this deck
19
Use a calculator to determine which of the following combinations of and df has a P-value of 0.130.
A)
B)
C)
D)
E)
and df has a P-value of 0.130. A)
B)
C)
D)
E)
Unlock Deck
Unlock for access to all 36 flashcards in this deck.
Unlock Deck
k this deck
20
Each person in a random sample of university students was asked which of five flavors of ice cream he or she preferred. The resulting data was used to test the null hypothesis . The P-value associated with this test was 0.067. If a significance level of 0.05 is used for the test, which of the following is an appropriate conclusion?
A)Fail to reject , there is convincing evidence that there is no preference for one flavor of ice cream over another.
B)Fail to reject , there is not convincing evidence that there is a preference for one flavor of ice cream over another.
C)Reject , there is convincing evidence that there is no preference for one flavor of ice cream over another.
D)Reject , there is convincing evidence that there is a preference for one flavor of ice cream over another.
E)Based on the information given, it is not possible to determine whether should be rejected or not.
. The P-value associated with this test was 0.067. If a significance level of 0.05 is used for the test, which of the following is an appropriate conclusion? A)Fail to reject
, there is convincing evidence that there is no preference for one flavor of ice cream over another.B)Fail to reject
, there is not convincing evidence that there is a preference for one flavor of ice cream over another.C)Reject
, there is convincing evidence that there is no preference for one flavor of ice cream over another.D)Reject
, there is convincing evidence that there is a preference for one flavor of ice cream over another.E)Based on the information given, it is not possible to determine whether
should be rejected or not. Unlock Deck
Unlock for access to all 36 flashcards in this deck.
Unlock Deck
k this deck
21
The arithmetic calculations and statistical procedures for (a) the test of homogeneity and (b) the test of independence are the same.
a)Explain in a few sentences what distinguishes these two hypothesis tests.
b)To illustrate your answer in part (a), make up an example of a research question that would require a test of homogeneity, and an example that would require a test of independence. Briefly describe the aspects of your examples that illustrate the distinguishing characteristics you mentioned in part (a).
Unlock Deck
Unlock for access to all 36 flashcards in this deck.
Unlock Deck
k this deck
22
Juvenile free-living ground squirrels utilize responses known as "alarm calls;" that is, vocalizations elicited by a predator. These calls can alert others to danger from a predator. Newly weaned squirrels emerge from the nest at about 25 days of age and enter a noisier world than they are used to. Do the squirrels emerge with automatic responses to alarm signals, or are the responses learned? To answer this question, a biologist played recordings of alarm calls for three populations (by age) of squirrels and observed the squirrels' responses. She reasoned that if the responses were not different for the different age groups, the squirrels must be responding by instinct. On the other hand, if the responses differ with the age of the squirrels the young squirrels must be learning to respond to the alarm calls. Her data for the responses to a whistle chorus, categorized by age, is presented below: Is there convincing evidence that the responses to a chorus of whistles are different for the different age groups? Test the relevant hypothesis at the .05 level.
Is there convincing evidence that the responses to a chorus of whistles are different for the different age groups? Test the relevant hypothesis at the .05 level. Unlock Deck
Unlock for access to all 36 flashcards in this deck.
Unlock Deck
k this deck
23
Scandinavian researchers investigated the effects of hunting male bears on succeeding generations. (The effects of hunting females on successive generations are well documented.) They hypothesized that when a male is killed a new male will move in, and maximize his reproductive success by killing existing cubs (so that the females will conceive sooner.) A random sample of radio tagged females was monitored and data on the number of bear cubs surviving 1.5 years were gathered. In the southern area, hunters killed bears legally; in the northern area, no hunting took place. The data on cub survival in this sample are reproduced below. The researcher suspects an association between the location of the females and cub survival.
a)What is the appropriate null hypothesis for this investigation? (You may state this hypothesis in ordinary English if you wish.)b)Using the hypothesis from part (a), test the null hypothesis using the appropriate chi-square procedure.
a)What is the appropriate null hypothesis for this investigation? (You may state this hypothesis in ordinary English if you wish.)b)Using the hypothesis from part (a), test the null hypothesis using the appropriate chi-square procedure.
Unlock Deck
Unlock for access to all 36 flashcards in this deck.
Unlock Deck
k this deck
24
Some people believe that criminals who plead guilty will, on average, get lighter sentences. The following table summarizes data from a random sample of San Francisco defendants in burglary cases. If the null hypothesis is that the plea and the sentencing fate are independent, perform the calculations to find the expected number of individuals who plead not guilty and are sent to prison. Show your work.
If the null hypothesis is that the plea and the sentencing fate are independent, perform the calculations to find the expected number of individuals who plead not guilty and are sent to prison. Show your work. Unlock Deck
Unlock for access to all 36 flashcards in this deck.
Unlock Deck
k this deck
25
Black bears (Ursus americanus), and their use of National Parks can be a problem for humans. Bear travels are governed by the need for food, as well as a high degree of natural curiosity. Some humans inadvertently or purposefully feed the bears, leading them to harass the human population. When bears become troublesome, one strategy is to transplant them--that is, take them far from home and hope they don't find their way back. In a study of the success of this transplantation strategy, researchers kept track of the troublesome bears' fate over the course of a 10-year period of transplantations. One question of interest was whether the strategy worked equally well for "experienced" and "inexperienced" bears. "Experienced" bears are bears being transplanted a second time after wandering back and being troublesome again. The relevant data are presented in the table below. Test the hypothesis that the transplant outcome and the "experience level" of the population of troublesome bears are independent. For purposes of this question, you may assume that the captured bears are a random sample of the troublesome bear population.
Test the hypothesis that the transplant outcome and the "experience level" of the population of troublesome bears are independent. For purposes of this question, you may assume that the captured bears are a random sample of the troublesome bear population. Unlock Deck
Unlock for access to all 36 flashcards in this deck.
Unlock Deck
k this deck
26
A question of interest to game managers is the hunting strategy of predators. Do they just take the first prey that comes along, or are the selective? In a study of winter prey selection in a National Park, radio-tagged wolves were observed to have killed prey according to the table below. Wolves were identified as the predators by their tracks in the snow. At the most recent census in the National Park there were about 3,500 white-tailed deer, 1,000 elk, and 500 moose. Do these data provide sufficient evidence at the .05 level that the wolves are not selecting their prey at random? That is, is there evidence that the proportion of deer, elk, and moose killed by wolves are not in the same proportion as in the park population? Justify your response with an appropriate statistical analysis.
Do these data provide sufficient evidence at the .05 level that the wolves are not selecting their prey at random? That is, is there evidence that the proportion of deer, elk, and moose killed by wolves are not in the same proportion as in the park population? Justify your response with an appropriate statistical analysis. Unlock Deck
Unlock for access to all 36 flashcards in this deck.
Unlock Deck
k this deck
27
Identify situation when the chi-square goodness-of-fit test is appropriate.
A)Student investigates the distribution of people with different ABO types of blood.He generates random sample of people and obtains following distribution of types.
B)Student wants to know what kind of movies do young people in his city prefer.He asks random people of his faculty in the University about the favorite movie genre and obtains following results.
C)Student carries out the study about the factors involved into the market price creation.First, he needs to know the distribution of the prices for some certain good.He takes a random sample of prices of the ice-cream in the different areas of his city.He obtains following information.
D)Student wants to know what kind of dog breeds do people in his dog club prefer.He generates the representative random sample of the people in his club asking about their favorite dog breed and obtains following results.
A)Student investigates the distribution of people with different ABO types of blood.He generates random sample of people and obtains following distribution of types.
B)Student wants to know what kind of movies do young people in his city prefer.He asks random people of his faculty in the University about the favorite movie genre and obtains following results.
C)Student carries out the study about the factors involved into the market price creation.First, he needs to know the distribution of the prices for some certain good.He takes a random sample of prices of the ice-cream in the different areas of his city.He obtains following information.
D)Student wants to know what kind of dog breeds do people in his dog club prefer.He generates the representative random sample of the people in his club asking about their favorite dog breed and obtains following results.
Unlock Deck
Unlock for access to all 36 flashcards in this deck.
Unlock Deck
k this deck
28
As every airline passenger knows, there are never enough armrests! Over the course of 20 flights occurring over a variety of weekdays, nights, and weekends, researchers selected a random sample of passengers that had been seated next to individuals of opposite gender. The passengers were surveyed as they left the boarding area. The researchers were interested in the level of agitation felt when their "seat-mate" used the common armrest. Only one person was randomly selected to be interviewed from a seat-mate pair, and couples were excluded from the survey. The question of interest was whether males and females are equally bothered by their opposite gender's use of the common armrest. The table below summarizes data gathered from interviewing the passengers.
a)What is the appropriate null hypothesis for this investigation? (You may state this hypothesis in ordinary English if you wish.)b)Using the hypothesis from part (a), test the null hypothesis using the appropriate chi-square procedure.
a)What is the appropriate null hypothesis for this investigation? (You may state this hypothesis in ordinary English if you wish.)b)Using the hypothesis from part (a), test the null hypothesis using the appropriate chi-square procedure.
Unlock Deck
Unlock for access to all 36 flashcards in this deck.
Unlock Deck
k this deck
29
Exhibit 11-2
In a recent study of student soda preferences in a California high school, 100 randomly selected students were each given $1 to purchase a soda from a vending machine that contained a Cola, a Citrus drink, a sports energy drink, and 2% milk. 31 of the students chose the Cola, 22 chose the Citrus drink, 42 chose the sports energy drink, and 5 chose milk.
Refer to Exhibit 11-2
Write a short paragraph that explains your results to parents and students. Since your audience cannot be assumed to know any statistics, you must explain your conclusions and reasoning in "plain English."
Unlock Deck
Unlock for access to all 36 flashcards in this deck.
Unlock Deck
k this deck
30
Some people believe that criminals who plead guilty will, on average, get lighter sentences. The following table summarizes data from a random sample of San Francisco defendants in burglary cases. If the null hypothesis is that the plea and the sentencing fate are independent, perform the calculations to find the expected number of individuals who plead guilty and are sent to prison. Show your work.
If the null hypothesis is that the plea and the sentencing fate are independent, perform the calculations to find the expected number of individuals who plead guilty and are sent to prison. Show your work. Unlock Deck
Unlock for access to all 36 flashcards in this deck.
Unlock Deck
k this deck
31
The authorship of ancient writings is frequently in dispute. One method for judging authorship of writings from the Classical Greek period is to analyze the proportion of sentences containing the word, γα'ρ. (γα'ρ is an article, something like "a," "an," and "the" in English.) If a particular collection of works has markedly different frequencies of use of γα'ρ, this would be considered evidence against the same author having written all the works.
In the table below, data from random samples of 200 sentences each from 4 works are presented. The alleged author is one Philo Judaeus , a philosopher writing in ancient Alexandria, Egypt.
a)At the .05 level of significance, test the hypothesis that the frequencies of the use of γα'ρ is the same for these 4 works.
b)Write a short paragraph that could be added to a history or Classics Studies textbook that explains your results. Since your audience cannot be assumed to know any statistics, you must explain your conclusions and reasoning in, so to speak, "plain English."
Unlock Deck
Unlock for access to all 36 flashcards in this deck.
Unlock Deck
k this deck
32
Exhibit 11-2
In a recent study of student soda preferences in a California high school, 100 randomly selected students were each given $1 to purchase a soda from a vending machine that contained a Cola, a Citrus drink, a sports energy drink, and 2% milk. 31 of the students chose the Cola, 22 chose the Citrus drink, 42 chose the sports energy drink, and 5 chose milk.
Refer to Exhibit 11-2. At the .05 level of significance, test the hypothesis that in the population of students at this school, the proportion preferring each of the four drinks is the same.
Unlock Deck
Unlock for access to all 36 flashcards in this deck.
Unlock Deck
k this deck
33
A question of interest to game managers is the hunting strategy of predators. Do they just take the first prey that comes along, or are the selective? In a study of winter prey selection in a National Park, radio-tagged cougars were observed to have killed prey according to the table below. At the most recent census in the National Park there were about 3,500 white-tailed deer, 1,000 elk, and 500 moose. Do these data provide sufficient evidence at the .05 level that the cougars are not selecting their prey at random? That is, is there evidence that the proportion of deer, elk, and moose killed by cougars are not in the same proportion as in the park population? Justify your response with an appropriate statistical analysis.
Do these data provide sufficient evidence at the .05 level that the cougars are not selecting their prey at random? That is, is there evidence that the proportion of deer, elk, and moose killed by cougars are not in the same proportion as in the park population? Justify your response with an appropriate statistical analysis. Unlock Deck
Unlock for access to all 36 flashcards in this deck.
Unlock Deck
k this deck
34
Black bears (Ursus americanus), and their use of National Parks can be a problem for humans. Bear travels are governed by the need for food, as well as a high degree of natural curiosity. Some humans inadvertently or purposefully feed the bears, leading them to harass the human population. When bears become troublesome, one strategy is to transplant them--that is, take them far from home and hope they don't find their way back. In a study of the success of this transplantation strategy, researchers kept track of the troublesome bears' fate over the course of a 10-year period of transplantations. One question of interest was whether the strategy worked equally well for male and female bears. The relevant data are presented in the table below. Test the hypothesis that the transplant outcome and the gender of the population of troublesome bears are independent. For purposes of this question, you may assume that the captured bears are a random sample of the troublesome bear population.
Test the hypothesis that the transplant outcome and the gender of the population of troublesome bears are independent. For purposes of this question, you may assume that the captured bears are a random sample of the troublesome bear population. Unlock Deck
Unlock for access to all 36 flashcards in this deck.
Unlock Deck
k this deck
35
The authorship of ancient writings is frequently in dispute. One method for judging authorship of writings from the Classical Greek period is to analyze the proportion of sentences containing the word, γα'ρ. (γα'ρ is an article, something like "a," "an," and "the" in English.) If a particular collection of works has markedly different frequencies of use of γα'ρ, this would be considered evidence against the same author having written all the works.
In the table below, data from random samples of 200 sentences each from 4 works are presented. The alleged author of these works is Xenophon (c. 428 -
c.45 BCE), a Greek soldier. a)At the .05 level of significance, test the hypothesis that the frequencies of the use of γα'ρ is the same for these 4 works.b)Write a short paragraph that could be added to a history or Classics Studies textbook that explains your results.Since your audience cannot be assumed to know any statistics, you must explain your conclusions and reasoning in, so to speak, "plain English."
In the table below, data from random samples of 200 sentences each from 4 works are presented. The alleged author of these works is Xenophon (c. 428 -
c.45 BCE), a Greek soldier.
a)At the .05 level of significance, test the hypothesis that the frequencies of the use of γα'ρ is the same for these 4 works.b)Write a short paragraph that could be added to a history or Classics Studies textbook that explains your results.Since your audience cannot be assumed to know any statistics, you must explain your conclusions and reasoning in, so to speak, "plain English." Unlock Deck
Unlock for access to all 36 flashcards in this deck.
Unlock Deck
k this deck
36
Juvenile free-living ground squirrels utilize responses known as "alarm calls;" that is, vocalizations elicited by a predator. These calls can alert others to danger from a predator. Newly weaned squirrels emerge from the nest at about 25 days of age and enter a noisier world than they are used to. Do the squirrels emerge with automatic responses to alarm signals, or are the responses learned? To answer this question, a biologist played recordings of alarm calls for three populations (by age) of squirrels and observed the squirrels' responses. She reasoned that if the responses were not different for the different age groups, the squirrels must be responding by instinct. On the other hand, if the responses differ with the age of the squirrels the young squirrels must be learning to respond to the alarm calls. Her data for the responses to a whistle chorus, categorized by age, is presented below: Is there convincing evidence that the responses to a single whistle is different for the different age groups? Test the relevant hypothesis at the .05 level.
Is there convincing evidence that the responses to a single whistle is different for the different age groups? Test the relevant hypothesis at the .05 level. Unlock Deck
Unlock for access to all 36 flashcards in this deck.
Unlock Deck
k this deck
Unlock Deck
Unlock for access to all 36 flashcards in this deck.


