Deck 10: Asking and Answering Questions About a Population Proportion
Full screen (f)
Question
Question
Question
In a test of H0: p = 0.45 versus Ha: p < 0.45, the value of the z test statistic was calculated to be z =  . Which of the following is the P-value for this test?
A)0.1230
B)0.2360
C)0.2500
D)0.2912
E)0.3020
. Which of the following is the P-value for this test? A)0.1230
B)0.2360
C)0.2500
D)0.2912
E)0.3020
Question
Question
Question
Question
Question
Question
Every year on Groundhog Day (February 2), the famous groundhog Punxsutawney Phil tries to predict whether there will be 6 more weeks of winter.
Suppose that you plan to take a random sample of 23 years and use weather data to determine the proportion of these years the groundhog's prediction was correct.
If the groundhog has a 50-50 chance of making a correct prediction, the spread of the sampling distribution of for samples of size 23 is:
A) = 0.1474
B) = 0.1043
C) = 0.2085
D) = 0.0435
E) = 0.0870
Suppose that you plan to take a random sample of 23 years and use weather data to determine the proportion of these years the groundhog's prediction was correct.
If the groundhog has a 50-50 chance of making a correct prediction, the spread of the sampling distribution of
for samples of size 23 is:
A)
= 0.1474B)
= 0.1043C)
= 0.2085D)
= 0.0435E)
= 0.0870 Question
Question
Question
Assuming a random sample from a large population, for which of the following null hypotheses and sample sizes is the large-sample z test appropriate?
A)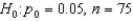
B)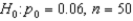
C)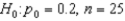
D)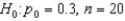
E)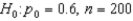
A)
B)
C)
D)
E)
Question
Question
Question
Question
Question
Question
Question
Question
Question
Question
Question
Researchers conducted a survey of 326 dog owners selected randomly and established that that 37% of the people interviewed take the dog with them on trips. You would like to use this information to estimate the proportion of all dog owners who take the dog with them on trips. Answer the following four key questions and indicate whether the method that you would consider would be a large-sample hypothesis test for a population proportion. 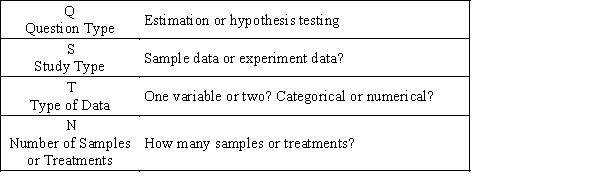
A)Estimation, sample data, one numerical variable, one sample.A large-sample hypothesis test for a population proportion would be appropriate.
B)Hypothesis testing, sample data, one categorical variable, one sample.A large-sample hypothesis test for a population proportion would be appropriate.
C)Hypothesis testing, sample data, one numerical variable, one sample.A large-sample hypothesis test for a population proportion would not be appropriate.
D)Estimation, sample data, two numerical variables, one sample.A large-sample hypothesis test for a population proportion would not be appropriate.
E)Estimation, sample data, one categorical variable, one sample.A large-sample hypothesis test for a population proportion would not be appropriate.
Question
Question
Question
Researchers conducted a survey in which each person in a representative sample of 2135 developers had been asked about the main priorities when choosing a new job. When asked about a remote work opportunity, 1238of the developers in the sample said that this is one of the main priorities in the search for work. These data were used to test  versus
  and the null hypothesis was rejected. Is it reasonable to say that the data provide strong support for the alternative hypothesis? Is it reasonable to say that the data provide strong evidence against the null hypothesis?
A)The data do not provide strong support for the alternative hypothesis and provide strong evidence against the null hypothesis.
B)The data provide strong support for the alternative hypothesis and provide strong evidence against the null hypothesis.
C)The data provide strong support for the alternative hypothesis and do not provide strong evidence against the null hypothesis.
D)The data do not provide strong support for the alternative hypothesis and do not provide strong evidence against the null hypothesis.
versus and the null hypothesis was rejected. Is it reasonable to say that the data provide strong support for the alternative hypothesis? Is it reasonable to say that the data provide strong evidence against the null hypothesis?A)The data do not provide strong support for the alternative hypothesis and provide strong evidence against the null hypothesis.
B)The data provide strong support for the alternative hypothesis and provide strong evidence against the null hypothesis.
C)The data provide strong support for the alternative hypothesis and do not provide strong evidence against the null hypothesis.
D)The data do not provide strong support for the alternative hypothesis and do not provide strong evidence against the null hypothesis.
Question
Question
Question
The average household income for Florida residents was $49,852 in 2015. You are interested in determining if there is evidence that the mean household income in the current year is greater than the known average from 2015. Answer the following four key questions and indicate whether the method that you would consider would be a large-sample hypothesis test for a population proportion. 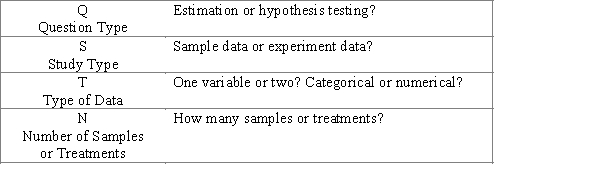
A)Estimation, sample data, one numerical variable, one sample.A large-sample hypothesis test for a population proportion would be appropriate.
B)Hypothesis testing, sample data, one categorical variable, one sample.A large-sample hypothesis test for a population proportion would be appropriate.
C)Hypothesis testing, sample data, one numerical variable, one sample.A large-sample hypothesis test for a population proportion would not be appropriate.
D)Hypothesis testing, sample data, two numerical variables, one sample.A large-sample hypothesis test for a population proportion would not be appropriate.
E)Estimation, sample data, one categorical variable, one sample.A large-sample hypothesis test for a population proportion would not be appropriate.
Question
The article reports that in a random sample of 1760 residents of the city, 597 answered "yes" to the following question: "Are you satisfied with the ecological situation in your city?" The authors were interested in using these data to determine if there is convincing evidence that less than 40% residents of the city are satisfied with the ecological situation in the city. Answer the following four key questions and indicate whether the method that you would consider would be a large-sample hypothesis test for a population proportion. 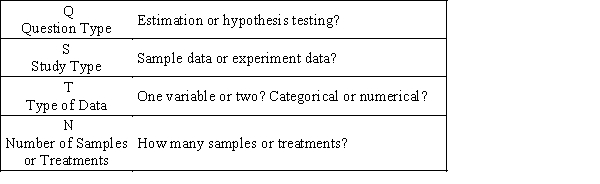
A)Hypothesis testing, sample data, one categorical variable, one sample.A large-sample hypothesis test for a population proportion would not be appropriate.
B)Estimation, sample data, one numerical variable, one sample.A large-sample hypothesis test for a population proportion would be appropriate.
C)Hypothesis testing, sample data, one numerical variable, one sample.A large-sample hypothesis test for a population proportion would not be appropriate.
D)Estimation, sample data, two categorical variables, one sample.A large-sample hypothesis test for a population proportion would be appropriate.
E)Hypothesis testing, sample data, one categorical variable, one sample.A large-sample hypothesis test for a population proportion would be appropriate.
Question

Unlock Deck
Sign up to unlock the cards in this deck!
Unlock Deck
Unlock Deck
1/31
Play
Full screen (f)
Deck 10: Asking and Answering Questions About a Population Proportion
1
The power of a test is the probability of failing to reject the null hypothesis.
False
2
A type II error is made by failing to reject a false null hypothesis.
True
3
In a test of H0: p = 0.45 versus Ha: p < 0.45, the value of the z test statistic was calculated to be z = . Which of the following is the P-value for this test?
A)0.1230
B)0.2360
C)0.2500
D)0.2912
E)0.3020
. Which of the following is the P-value for this test? A)0.1230
B)0.2360
C)0.2500
D)0.2912
E)0.3020
0.2912
4
For tests of hypotheses about μ, β decreases as the sample size increases if the level of significance stays the same.
Unlock Deck
Unlock for access to all 31 flashcards in this deck.
Unlock Deck
k this deck
5
All other things being equal, choosing a smaller value of α will increase the probability of making a type II error.
Unlock Deck
Unlock for access to all 31 flashcards in this deck.
Unlock Deck
k this deck
6
Explain in your own words the distinction between a null and alternative hypothesis.
Unlock Deck
Unlock for access to all 31 flashcards in this deck.
Unlock Deck
k this deck
7
Describe the two types of errors that might be made when a hypothesis test is carried out.
A)A Type I error is rejecting Ho when Ho is true.A Type II error is failing to reject Ho when Ho is false.
B)A Type I error is rejecting Ho when Ho is false.A Type II error is failing to reject Ho when Ho is true.
C)A Type I error is failing to reject Ho when Ho is true.A Type II error is rejecting Ho when Ho is true.
D)A Type I error is rejecting Ho when Ho is true.A Type II error is failing to reject Ho when Ho is true.
E)A Type I error is rejecting Ho when Ho is false.A Type II error is failing to reject Ho when Ho is false.
Unlock Deck
Unlock for access to all 31 flashcards in this deck.
Unlock Deck
k this deck
8
Assuming the same sample size is used, how does changing the significance level from 0.2 to 0.05 affect the power of a test?
A)The power decreases.
B)The power increases.
C)The power does not change.
D)The power does change, but it might either decrease or increase.
E)It is not possible to predict whether the power will increase, decrease, or remain the unchanged.
A)The power decreases.
B)The power increases.
C)The power does not change.
D)The power does change, but it might either decrease or increase.
E)It is not possible to predict whether the power will increase, decrease, or remain the unchanged.
Unlock Deck
Unlock for access to all 31 flashcards in this deck.
Unlock Deck
k this deck
9
Every year on Groundhog Day (February 2), the famous groundhog Punxsutawney Phil tries to predict whether there will be 6 more weeks of winter.
Suppose that you plan to take a random sample of 23 years and use weather data to determine the proportion of these years the groundhog's prediction was correct.
If the groundhog has a 50-50 chance of making a correct prediction, the spread of the sampling distribution of for samples of size 23 is:
A) = 0.1474
B) = 0.1043
C) = 0.2085
D) = 0.0435
E) = 0.0870
Suppose that you plan to take a random sample of 23 years and use weather data to determine the proportion of these years the groundhog's prediction was correct.
If the groundhog has a 50-50 chance of making a correct prediction, the spread of the sampling distribution of
for samples of size 23 is:
A)
= 0.1474B)
= 0.1043C)
= 0.2085D)
= 0.0435E)
= 0.0870 Unlock Deck
Unlock for access to all 31 flashcards in this deck.
Unlock Deck
k this deck
10
Explain in your own words what a hypothesis test is.
Unlock Deck
Unlock for access to all 31 flashcards in this deck.
Unlock Deck
k this deck
11
Small P-values indicate that the observed sample is inconsistent with the null hypothesis.
Unlock Deck
Unlock for access to all 31 flashcards in this deck.
Unlock Deck
k this deck
12
Assuming a random sample from a large population, for which of the following null hypotheses and sample sizes is the large-sample z test appropriate?
A)
B)
C)
D)
E)
A)
B)
C)
D)
E)
Unlock Deck
Unlock for access to all 31 flashcards in this deck.
Unlock Deck
k this deck
13
The level of significance of a test is the probability of making a type I error, given that the null hypothesis is true.
Unlock Deck
Unlock for access to all 31 flashcards in this deck.
Unlock Deck
k this deck
14
Assuming the same significance level is used, how does increasing the sample size from 50 to 100 affect the power of a test?
A)The power decreases.
B)The power increases.
C)The power does not change.
D)The power does change, but it might either decrease or increase.
E)It is not possible to predict whether the power will increase, decrease, or remain the unchanged.
A)The power decreases.
B)The power increases.
C)The power does not change.
D)The power does change, but it might either decrease or increase.
E)It is not possible to predict whether the power will increase, decrease, or remain the unchanged.
Unlock Deck
Unlock for access to all 31 flashcards in this deck.
Unlock Deck
k this deck
15
If the null hypothesis is not rejected, there is strong statistical evidence that the null hypothesis is true.
Unlock Deck
Unlock for access to all 31 flashcards in this deck.
Unlock Deck
k this deck
16
β is called the observed significance level.
Unlock Deck
Unlock for access to all 31 flashcards in this deck.
Unlock Deck
k this deck
17
It is customary to say that the result of a hypothesis test is statistically significant when the P-value is smaller than α.
Unlock Deck
Unlock for access to all 31 flashcards in this deck.
Unlock Deck
k this deck
18
Which of the following specify legitimate pairs of null and alternative hypotheses?
A)H0: p = 0.2 Ha: p > 0.2
B)H0: p ≠ 0.35 Ha: p > 0.35
C)H0: p < 0.40 Ha: p > 0.40
D)H0: p ≠ 0.50 Ha: p = 0.50
E)H0: p = 0.40 Ha: p > 0.65
A)H0: p = 0.2 Ha: p > 0.2
B)H0: p ≠ 0.35 Ha: p > 0.35
C)H0: p < 0.40 Ha: p > 0.40
D)H0: p ≠ 0.50 Ha: p = 0.50
E)H0: p = 0.40 Ha: p > 0.65
Unlock Deck
Unlock for access to all 31 flashcards in this deck.
Unlock Deck
k this deck
19
You are interested in determining whether there is strong evidence in support of the claim that less than 40% of retired adults have a part-time job. To answer this question, what null and alternative hypotheses should you test?
A)H0: p = 0.4 versus Ha: p > 0.4
B)H0: p = 0.4 versus Ha: p < 0.4
C)H0: p = 0.4 versus Ha: p ≠ 0.4
D)H0: p < 0.4 versus Ha: p > 0.4
E)H0: p < 0.4 versus Ha: p = 0.4
A)H0: p = 0.4 versus Ha: p > 0.4
B)H0: p = 0.4 versus Ha: p < 0.4
C)H0: p = 0.4 versus Ha: p ≠ 0.4
D)H0: p < 0.4 versus Ha: p > 0.4
E)H0: p < 0.4 versus Ha: p = 0.4
Unlock Deck
Unlock for access to all 31 flashcards in this deck.
Unlock Deck
k this deck
20
Assuming a random sample from a large population, for which of the following null hypotheses and sample sizes is the large-sample z test appropriate?
A)H0: p = 0.09, n = 40
B)H0: p = 0.1, n = 50
C)H0: p = 0.1, n = 30
D)H0: p = 0.4, n = 100
E)H0: p = 0.8, n = 40
A)H0: p = 0.09, n = 40
B)H0: p = 0.1, n = 50
C)H0: p = 0.1, n = 30
D)H0: p = 0.4, n = 100
E)H0: p = 0.8, n = 40
Unlock Deck
Unlock for access to all 31 flashcards in this deck.
Unlock Deck
k this deck
21
When performing tests of hypotheses, there are assumptions that must be met in order for the test to be appropriate. For the test of a hypothesis about a population proportion, describe how you would check the assumptions.
Unlock Deck
Unlock for access to all 31 flashcards in this deck.
Unlock Deck
k this deck
22
In your own words, what is a P-value?
Unlock Deck
Unlock for access to all 31 flashcards in this deck.
Unlock Deck
k this deck
23
Researchers conducted a survey of 326 dog owners selected randomly and established that that 37% of the people interviewed take the dog with them on trips. You would like to use this information to estimate the proportion of all dog owners who take the dog with them on trips. Answer the following four key questions and indicate whether the method that you would consider would be a large-sample hypothesis test for a population proportion.
A)Estimation, sample data, one numerical variable, one sample.A large-sample hypothesis test for a population proportion would be appropriate.
B)Hypothesis testing, sample data, one categorical variable, one sample.A large-sample hypothesis test for a population proportion would be appropriate.
C)Hypothesis testing, sample data, one numerical variable, one sample.A large-sample hypothesis test for a population proportion would not be appropriate.
D)Estimation, sample data, two numerical variables, one sample.A large-sample hypothesis test for a population proportion would not be appropriate.
E)Estimation, sample data, one categorical variable, one sample.A large-sample hypothesis test for a population proportion would not be appropriate.
Unlock Deck
Unlock for access to all 31 flashcards in this deck.
Unlock Deck
k this deck
24
One of the early decisions that must be made when performing a hypothesis test is the choice of significance level. Briefly describe the considerations that go into making this decision.
Unlock Deck
Unlock for access to all 31 flashcards in this deck.
Unlock Deck
k this deck
25
Define, using your own words, a test statistic.
Unlock Deck
Unlock for access to all 31 flashcards in this deck.
Unlock Deck
k this deck
26
Researchers conducted a survey in which each person in a representative sample of 2135 developers had been asked about the main priorities when choosing a new job. When asked about a remote work opportunity, 1238of the developers in the sample said that this is one of the main priorities in the search for work. These data were used to test versus and the null hypothesis was rejected. Is it reasonable to say that the data provide strong support for the alternative hypothesis? Is it reasonable to say that the data provide strong evidence against the null hypothesis?
A)The data do not provide strong support for the alternative hypothesis and provide strong evidence against the null hypothesis.
B)The data provide strong support for the alternative hypothesis and provide strong evidence against the null hypothesis.
C)The data provide strong support for the alternative hypothesis and do not provide strong evidence against the null hypothesis.
D)The data do not provide strong support for the alternative hypothesis and do not provide strong evidence against the null hypothesis.
versus and the null hypothesis was rejected. Is it reasonable to say that the data provide strong support for the alternative hypothesis? Is it reasonable to say that the data provide strong evidence against the null hypothesis?A)The data do not provide strong support for the alternative hypothesis and provide strong evidence against the null hypothesis.
B)The data provide strong support for the alternative hypothesis and provide strong evidence against the null hypothesis.
C)The data provide strong support for the alternative hypothesis and do not provide strong evidence against the null hypothesis.
D)The data do not provide strong support for the alternative hypothesis and do not provide strong evidence against the null hypothesis.
Unlock Deck
Unlock for access to all 31 flashcards in this deck.
Unlock Deck
k this deck
27
As children grow they develop what is known as "representational insight," a connection between an object and a symbol for that object. A random sample of youngsters 24-months old were shown a video of someone putting a toy under 1 of 4 randomly placed boxes in a room familiar to the child. They were then taken to the room, and asked to "find the toy." The investigators reasoned that a child with representational insight should pick the correct box on the first try. If the children were to overturn the boxes randomly, they would find the toy on the first turn 25% of the time. Thirty children out of 57 subjects found the toy by turning over the correct box on the first try.
Does this sample provide sufficient evidence that the proportion of 24-month old children who choose the correct box on the first try is greater than 0.25? Use a significance level of α = 0.05 to test the appropriate hypothesis.
Does this sample provide sufficient evidence that the proportion of 24-month old children who choose the correct box on the first try is greater than 0.25? Use a significance level of α = 0.05 to test the appropriate hypothesis.
Unlock Deck
Unlock for access to all 31 flashcards in this deck.
Unlock Deck
k this deck
28
Children as young as 2 years of age, upon seeing an object placed under a pillow in a familiar setting at home, will understand to look for it after an interval of time and be able to find it. Investigators believe this capability will be less pronounced in a laboratory situation, where the child is away from the familiar setting of home. Let p denote the proportion of 2-year-olds than have this understanding in the home situation, and suppose that p = 0.35. The investigators wish to determine whether the proportion that remembers is less when the child is away from home.
a)What is the appropriate null hypothesis?
b)What is the appropriate alternative hypothesis?
c)In your own words, distinguish between a Type I and a Type II error in this context.
a)What is the appropriate null hypothesis?
b)What is the appropriate alternative hypothesis?
c)In your own words, distinguish between a Type I and a Type II error in this context.
Unlock Deck
Unlock for access to all 31 flashcards in this deck.
Unlock Deck
k this deck
29
The average household income for Florida residents was $49,852 in 2015. You are interested in determining if there is evidence that the mean household income in the current year is greater than the known average from 2015. Answer the following four key questions and indicate whether the method that you would consider would be a large-sample hypothesis test for a population proportion.
A)Estimation, sample data, one numerical variable, one sample.A large-sample hypothesis test for a population proportion would be appropriate.
B)Hypothesis testing, sample data, one categorical variable, one sample.A large-sample hypothesis test for a population proportion would be appropriate.
C)Hypothesis testing, sample data, one numerical variable, one sample.A large-sample hypothesis test for a population proportion would not be appropriate.
D)Hypothesis testing, sample data, two numerical variables, one sample.A large-sample hypothesis test for a population proportion would not be appropriate.
E)Estimation, sample data, one categorical variable, one sample.A large-sample hypothesis test for a population proportion would not be appropriate.
Unlock Deck
Unlock for access to all 31 flashcards in this deck.
Unlock Deck
k this deck
30
The article reports that in a random sample of 1760 residents of the city, 597 answered "yes" to the following question: "Are you satisfied with the ecological situation in your city?" The authors were interested in using these data to determine if there is convincing evidence that less than 40% residents of the city are satisfied with the ecological situation in the city. Answer the following four key questions and indicate whether the method that you would consider would be a large-sample hypothesis test for a population proportion.
A)Hypothesis testing, sample data, one categorical variable, one sample.A large-sample hypothesis test for a population proportion would not be appropriate.
B)Estimation, sample data, one numerical variable, one sample.A large-sample hypothesis test for a population proportion would be appropriate.
C)Hypothesis testing, sample data, one numerical variable, one sample.A large-sample hypothesis test for a population proportion would not be appropriate.
D)Estimation, sample data, two categorical variables, one sample.A large-sample hypothesis test for a population proportion would be appropriate.
E)Hypothesis testing, sample data, one categorical variable, one sample.A large-sample hypothesis test for a population proportion would be appropriate.
Unlock Deck
Unlock for access to all 31 flashcards in this deck.
Unlock Deck
k this deck
31
One criticism of reading comprehension tests is that while they may measure reading comprehension, they also measure other factors not related to reading comprehension. A reading comprehension (RC) test on a major college entrance exam provides short English prose passages, and the examinees answer a set of multiple-choice items about the passage. To see if particular items measure something other than RC, investigators gave the RC test without the reading passages to a random sample of psychology students. The investigators reasoned that if questions were measuring knowledge or memory rather than just RC, students would answer questions at a higher rate than chance (20%, since there were 5 choices for each question.)
Suppose that on one question, 30 out of 100 examinees answered the question correctly. Is this sufficient evidence that students are using more than just reading comprehension to answer this question? Test the relevant hypothesis using α = 0.05.
Suppose that on one question, 30 out of 100 examinees answered the question correctly. Is this sufficient evidence that students are using more than just reading comprehension to answer this question? Test the relevant hypothesis using α = 0.05.
Unlock Deck
Unlock for access to all 31 flashcards in this deck.
Unlock Deck
k this deck
Unlock Deck
Unlock for access to all 31 flashcards in this deck.


