Deck 16: Inference for Regression
Full screen (f)
Question
Consider Scatterplots 1 and 2 with fitted regression lines shown below.Which of the following statements is true?
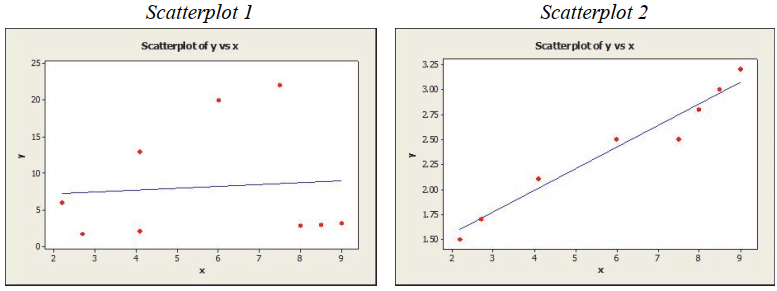
A)The standard error of the regression slope is smaller in scatterplot 1.
B)The relationship between x and y is stronger in scatterplot 1.
C)The standard error of the regression slope is smaller in scatterplot 2.
D)The estimated slope is negative in scatterplot 2.
E)The estimated intercept is negative in scatterplot 1.
Question
A sales manager claims that there is a relationship between college GPA and sales performance (number of units sold) among salespeople hired within the last year.Use the regression results are shown below and set α = .05 to test his claim.
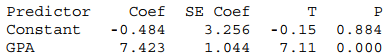
A)reject the null hypothesis and conclude that there is no significant relationship between GPA and sales performance
B)fail to reject the null hypothesis and conclude that there is no significant relationship between GPA and sales performance
C)reject the null hypothesis and conclude that there is a significant relationship between GPA and sales performance
D)fail to reject the null hypothesis and conclude that there is a significant relationship between GPA and sales performance
E)None of these
Question
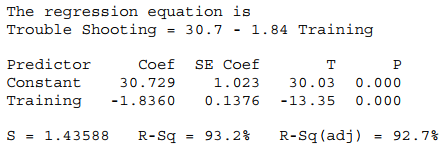
A sample of 15 recently trained line workers was selected to determine if there is a relationship between the number of hours of training time received by production line workers and the time it took (in minutes) for them to trouble shoot their last process problem were captured.Use the regression output for the independent variable shown below to find the 95% confidence interval for the slope of the regression equation.

A)-4 to 0.32
B)-1.9776 to -1.7224
C)-2.1332 to -1.5388
D)-3.611 to -0.069
E)Can't be determined with the information given.
A)-4 to 0.32
B)-1.9776 to -1.7224
C)-2.1332 to -1.5388
D)-3.611 to -0.069
E)Can't be determined with the information given.
Question
Question
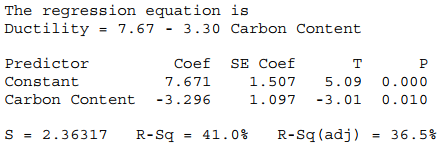
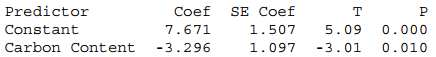
As the carbon content in steel increases, its ductility tends to decrease.A researcher at a steel company measures carbon content and ductility for a sample of 15 types of steel.According to the output provided below, the standard error of the regression slope is ________________________ .
A)-3.296
B)+2.363
C)+1.097
D)+1.507
E)+5.090
A)-3.296
B)+2.363
C)+1.097
D)+1.507
E)+5.090
Question
A sales manager was interested in determining if there is a relationship between college GPA and sales performance (number of units sold) among salespeople hired within the last year.From the regression results shown below, identify the residual standard deviation.
A)3.256.
B)1.044.
C)1.574.
D)34.70.
E)None of the above.
A)3.256.
B)1.044.
C)1.574.
D)34.70.
E)None of the above.
Question
A sample of recently trained line workers was selected to determine if there is a relationship between the number of hours of training time received by production line workers and the time it took (in minutes) for them to trouble shoot their last process problem were captured.Using the regression output is shown below, what conclusion should be made at α = .05?
A)Reject the null hypothesis, there is a significant relationship between amount of training received and troubleshooting time.
B)Do not reject the null hypothesis, , there is a significant relationship between amount of training received and troubleshooting time.
C)Reject the null hypothesis, there is no significant relationship between amount of training received and troubleshooting time.
D)Do not reject the null hypothesis, there is no significant relationship between amount of training received and troubleshooting time.
E)None of these.
Question
Question
As the carbon content in steel increases, its ductility tends to decrease.A researcher at a steel company measures carbon content and ductility for a sample of 15 types of steel.Based on these data he obtained the following regression results, which of the following statements is NOT true?
A)The association between carbon content and ductility of steel is statistically significant at α = 0.05.
B)The slope is significantly different from zero at α = 0.05.
C)The relationship between carbon content and ductility of steel is positive at α = 0.05.
D)There is 59% of the variance in ductility that is not explained by this model.
E)For one unit increase in carbon content, one can expect a 3.30 unit decrease in ductility.
Question
Question
As the carbon content in steel increases, its ductility tends to decrease.A researcher at a steel company measures carbon content and ductility for a sample of 15 types of steel.Use the following regression results to find the 95% confidence interval for the slope of the regression equation.
A)-5.456 to -1.136
B)-4.393 to -2.199
C)6.164 to 9.178
D)-5.666 to -0.926
E)2.581 to 12.761
A)-5.456 to -1.136
B)-4.393 to -2.199
C)6.164 to 9.178
D)-5.666 to -0.926
E)2.581 to 12.761
Question
Question
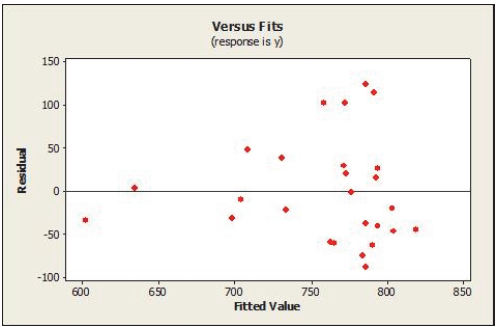
According to the plot of residuals versus fitted values below, which of the following is true?
A)equal spread condition is satisfied
B)equal spread condition is not satisfied
C)nearly normal condition is not satisfied
D)linearity condition is not satisfied
E)quantitative variables condition is not satisfied
A)equal spread condition is satisfied
B)equal spread condition is not satisfied
C)nearly normal condition is not satisfied
D)linearity condition is not satisfied
E)quantitative variables condition is not satisfied
Question
A researcher is interested in developing a model that can be used to distribute assistance to low income families for food costs.She used data from a national social survey to predict weekly amount spent on food using household income (in $1000).The resulting regression equation is
 How much money would be needed to feed a family for a week whose household income is $12,000?
A)$9341.33
B)$871.33
C)$193.73
D)$110.57
How much money would be needed to feed a family for a week whose household income is $12,000?A)$9341.33
B)$871.33
C)$193.73
D)$110.57
Question
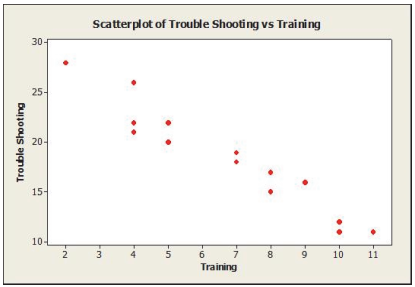
Based on the scatterplot of data of the number of hours of training time received by production line workers and the time it took (in minutes) for them to trouble shoot their last process problem shown, we can say that ________________________ .
A)the slope of the regression line fit to these data will be positive
B)the slope of the regression line fit to these data will be negative
C)the linearity assumption is not satisfied
D)the intercept of the regression line fit to these data will be negative
E)the equal variance assumption is not satisfied
Question
Question
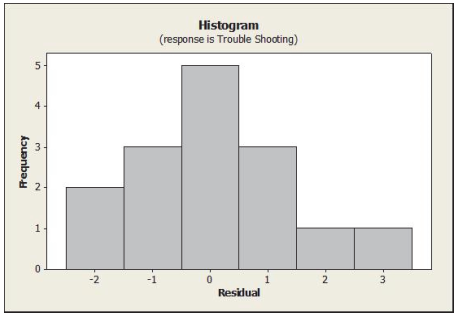
A regression equation was fit to the data showing the number of hours of training time received by production line workers and the time it took (in minutes) for them to trouble shoot their last process problem and the following histogram of residuals obtained.Based on this histogram of the residuals, we can say that the:
A)nearly normal condition is satisfied.
B)nearly normal condition is not satisfied.
C)equal spread condition is satisfied.
D)linearity condition is not satisfied.
E)independence condition is not satisfied.
A)nearly normal condition is satisfied.
B)nearly normal condition is not satisfied.
C)equal spread condition is satisfied.
D)linearity condition is not satisfied.
E)independence condition is not satisfied.
Question
Question

Unlock Deck
Sign up to unlock the cards in this deck!
Unlock Deck
Unlock Deck
1/19
Play
Full screen (f)
Deck 16: Inference for Regression
1
Consider Scatterplots 1 and 2 with fitted regression lines shown below.Which of the following statements is true?
A)The standard error of the regression slope is smaller in scatterplot 1.
B)The relationship between x and y is stronger in scatterplot 1.
C)The standard error of the regression slope is smaller in scatterplot 2.
D)The estimated slope is negative in scatterplot 2.
E)The estimated intercept is negative in scatterplot 1.
The standard error of the regression slope is smaller in scatterplot 2.
2
A sales manager claims that there is a relationship between college GPA and sales performance (number of units sold) among salespeople hired within the last year.Use the regression results are shown below and set α = .05 to test his claim.
A)reject the null hypothesis and conclude that there is no significant relationship between GPA and sales performance
B)fail to reject the null hypothesis and conclude that there is no significant relationship between GPA and sales performance
C)reject the null hypothesis and conclude that there is a significant relationship between GPA and sales performance
D)fail to reject the null hypothesis and conclude that there is a significant relationship between GPA and sales performance
E)None of these
reject the null hypothesis and conclude that there is a significant relationship between GPA and sales performance
3
A sample of 15 recently trained line workers was selected to determine if there is a relationship between the number of hours of training time received by production line workers and the time it took (in minutes) for them to trouble shoot their last process problem were captured.Use the regression output for the independent variable shown below to find the 95% confidence interval for the slope of the regression equation.
A)-4 to 0.32
B)-1.9776 to -1.7224
C)-2.1332 to -1.5388
D)-3.611 to -0.069
E)Can't be determined with the information given.
A)-4 to 0.32
B)-1.9776 to -1.7224
C)-2.1332 to -1.5388
D)-3.611 to -0.069
E)Can't be determined with the information given.
-2.1332 to -1.5388
4
In a significant regression model determining if there is a relationship between college GPA and sales performance (number of units sold in the previous month), the 95% confidence interval for the number of units sold when GPA = 3.00 was determined to be 20.914 to 22.657.The correct interpretation is ________________________ .
A)we can be 95% confident that the number of units sold per month by a particular salesperson with a college GPA of 3.00 is between 20.914 and 22.657 units
B)we can be 95% confident that the average number of units sold per month by salespersons with a college GPA of 3.00 is between 20.914 and 22.657 units
C)the number of units sold per month by a salesperson with a college GPA of 3.00 will be between 20.914 and 22.657 units 95% of the time
D)95% of the time the average number of units sold per month will be between 20.914 and 22.657 units
E)we can be 95% confident that each month between 20.914 and 22.657 units will be sold
Unlock Deck
Unlock for access to all 19 flashcards in this deck.
Unlock Deck
k this deck
5
As the carbon content in steel increases, its ductility tends to decrease.A researcher at a steel company measures carbon content and ductility for a sample of 15 types of steel.According to the output provided below, the standard error of the regression slope is ________________________ .
A)-3.296
B)+2.363
C)+1.097
D)+1.507
E)+5.090
A)-3.296
B)+2.363
C)+1.097
D)+1.507
E)+5.090
Unlock Deck
Unlock for access to all 19 flashcards in this deck.
Unlock Deck
k this deck
6
A sales manager was interested in determining if there is a relationship between college GPA and sales performance (number of units sold) among salespeople hired within the last year.From the regression results shown below, identify the residual standard deviation.
A)3.256.
B)1.044.
C)1.574.
D)34.70.
E)None of the above.
A)3.256.
B)1.044.
C)1.574.
D)34.70.
E)None of the above.
Unlock Deck
Unlock for access to all 19 flashcards in this deck.
Unlock Deck
k this deck
7
A sample of recently trained line workers was selected to determine if there is a relationship between the number of hours of training time received by production line workers and the time it took (in minutes) for them to trouble shoot their last process problem were captured.Using the regression output is shown below, what conclusion should be made at α = .05?
A)Reject the null hypothesis, there is a significant relationship between amount of training received and troubleshooting time.
B)Do not reject the null hypothesis, , there is a significant relationship between amount of training received and troubleshooting time.
C)Reject the null hypothesis, there is no significant relationship between amount of training received and troubleshooting time.
D)Do not reject the null hypothesis, there is no significant relationship between amount of training received and troubleshooting time.
E)None of these.
A)Reject the null hypothesis, there is a significant relationship between amount of training received and troubleshooting time.
B)Do not reject the null hypothesis, , there is a significant relationship between amount of training received and troubleshooting time.
C)Reject the null hypothesis, there is no significant relationship between amount of training received and troubleshooting time.
D)Do not reject the null hypothesis, there is no significant relationship between amount of training received and troubleshooting time.
E)None of these.
Unlock Deck
Unlock for access to all 19 flashcards in this deck.
Unlock Deck
k this deck
8
When using a plot of residuals (y-axis) vs.fitted value of the dependent variable, a plot with no pattern indicates that the:
A)nearly normal condition is satisfied.
B)nearly normal condition is not satisfied.
C)equal spread condition is satisfied.
D)linearity condition is not satisfied.
E)independence condition is not satisfied.
A)nearly normal condition is satisfied.
B)nearly normal condition is not satisfied.
C)equal spread condition is satisfied.
D)linearity condition is not satisfied.
E)independence condition is not satisfied.
Unlock Deck
Unlock for access to all 19 flashcards in this deck.
Unlock Deck
k this deck
9
As the carbon content in steel increases, its ductility tends to decrease.A researcher at a steel company measures carbon content and ductility for a sample of 15 types of steel.Based on these data he obtained the following regression results, which of the following statements is NOT true?
A)The association between carbon content and ductility of steel is statistically significant at α = 0.05.
B)The slope is significantly different from zero at α = 0.05.
C)The relationship between carbon content and ductility of steel is positive at α = 0.05.
D)There is 59% of the variance in ductility that is not explained by this model.
E)For one unit increase in carbon content, one can expect a 3.30 unit decrease in ductility.
A)The association between carbon content and ductility of steel is statistically significant at α = 0.05.
B)The slope is significantly different from zero at α = 0.05.
C)The relationship between carbon content and ductility of steel is positive at α = 0.05.
D)There is 59% of the variance in ductility that is not explained by this model.
E)For one unit increase in carbon content, one can expect a 3.30 unit decrease in ductility.
Unlock Deck
Unlock for access to all 19 flashcards in this deck.
Unlock Deck
k this deck
10
An estimated regression equation that was fit to estimate ductility in steel using its carbon content was found to be significant at α = 0.05.The 95% prediction interval for the ductility of steel with 0.5% carbon content was determined to be 0.45 to 11.59.The correct interpretation is ________________________ .
A)we can be 95% confident that the ductility of a particular type of steel with 0.5% carbon content is between 0.45 and 11.59
B)we can be 95% confident that the average ductility of all steel with 0.5% carbon content is between 0.45 and 11.59
C)the ductility of steel with 0.5% carbon content will be between 45 and 11.59 most (95%) of the time
D)95% of the time the average ductility of steel with 0.5% carbon content will be between 0.45 and 11.59
E)we can be 95% confident that all steel with have ductility measurements between 0.45 and 11.59
Unlock Deck
Unlock for access to all 19 flashcards in this deck.
Unlock Deck
k this deck
11
As the carbon content in steel increases, its ductility tends to decrease.A researcher at a steel company measures carbon content and ductility for a sample of 15 types of steel.Use the following regression results to find the 95% confidence interval for the slope of the regression equation.
A)-5.456 to -1.136
B)-4.393 to -2.199
C)6.164 to 9.178
D)-5.666 to -0.926
E)2.581 to 12.761
A)-5.456 to -1.136
B)-4.393 to -2.199
C)6.164 to 9.178
D)-5.666 to -0.926
E)2.581 to 12.761
Unlock Deck
Unlock for access to all 19 flashcards in this deck.
Unlock Deck
k this deck
12
Cars from an online service were examined to see how fuel efficiency (highway mpg) relates to cost (in dollars).According to the regression equation, a used car that costs $13,000 is predicted to get about 30.24 miles per gallon.According to the data, the car got 35 miles per gallon.What is the value of the residual for this car?
A)-4.76
B)+1.16
C)+4.76
D)+65.24
A)-4.76
B)+1.16
C)+4.76
D)+65.24
Unlock Deck
Unlock for access to all 19 flashcards in this deck.
Unlock Deck
k this deck
13
According to the plot of residuals versus fitted values below, which of the following is true?
A)equal spread condition is satisfied
B)equal spread condition is not satisfied
C)nearly normal condition is not satisfied
D)linearity condition is not satisfied
E)quantitative variables condition is not satisfied
A)equal spread condition is satisfied
B)equal spread condition is not satisfied
C)nearly normal condition is not satisfied
D)linearity condition is not satisfied
E)quantitative variables condition is not satisfied
Unlock Deck
Unlock for access to all 19 flashcards in this deck.
Unlock Deck
k this deck
14
A researcher is interested in developing a model that can be used to distribute assistance to low income families for food costs.She used data from a national social survey to predict weekly amount spent on food using household income (in $1000).The resulting regression equation is
How much money would be needed to feed a family for a week whose household income is $12,000?
A)$9341.33
B)$871.33
C)$193.73
D)$110.57
How much money would be needed to feed a family for a week whose household income is $12,000?A)$9341.33
B)$871.33
C)$193.73
D)$110.57
Unlock Deck
Unlock for access to all 19 flashcards in this deck.
Unlock Deck
k this deck
15
Based on the scatterplot of data of the number of hours of training time received by production line workers and the time it took (in minutes) for them to trouble shoot their last process problem shown, we can say that ________________________ .
A)the slope of the regression line fit to these data will be positive
B)the slope of the regression line fit to these data will be negative
C)the linearity assumption is not satisfied
D)the intercept of the regression line fit to these data will be negative
E)the equal variance assumption is not satisfied
A)the slope of the regression line fit to these data will be positive
B)the slope of the regression line fit to these data will be negative
C)the linearity assumption is not satisfied
D)the intercept of the regression line fit to these data will be negative
E)the equal variance assumption is not satisfied
Unlock Deck
Unlock for access to all 19 flashcards in this deck.
Unlock Deck
k this deck
16
The number of hours of training time received by employees and the time it took (in minutes) for them to trouble shoot their last process problem was estimated using a regression equation.The 95% prediction interval for trouble shooting time with 8 hours of training was determined to be 12.822 to 19.261.The correct interpretation is ________________________ .
A)we can be 95% confident that the trouble shooting time by a particular line worker who received 8 hours of training will be between 12.822 and 19.261 minutes
B)we can be 95% confident that the average trouble shooting time by line workers receiving 8 hours of training is between 12.822 and 19.261 minutes
C)the troubleshooting time by a line worker who received 8 hours of training will be between 12.822 and 19.261 minutes 95% of the time
D)95% of the time the average troubleshooting time is between 12.822 and 19.261 minutes
E)we can be 95% confident that troubleshooting times will be between 12.822 and 19.261 minutes
Unlock Deck
Unlock for access to all 19 flashcards in this deck.
Unlock Deck
k this deck
17
A regression equation was fit to the data showing the number of hours of training time received by production line workers and the time it took (in minutes) for them to trouble shoot their last process problem and the following histogram of residuals obtained.Based on this histogram of the residuals, we can say that the:
A)nearly normal condition is satisfied.
B)nearly normal condition is not satisfied.
C)equal spread condition is satisfied.
D)linearity condition is not satisfied.
E)independence condition is not satisfied.
A)nearly normal condition is satisfied.
B)nearly normal condition is not satisfied.
C)equal spread condition is satisfied.
D)linearity condition is not satisfied.
E)independence condition is not satisfied.
Unlock Deck
Unlock for access to all 19 flashcards in this deck.
Unlock Deck
k this deck
18
Which of the following does NOT affect the standard error of the regression slope?
A)Spread around the line: se
B)Spread of x values: sx
C)Sample size: n
D)Critical value: t*
E)All of these affect the standard error.
A)Spread around the line: se
B)Spread of x values: sx
C)Sample size: n
D)Critical value: t*
E)All of these affect the standard error.
Unlock Deck
Unlock for access to all 19 flashcards in this deck.
Unlock Deck
k this deck
19
A researcher gathers data on the length of essays (number of lines) and the SAT scores received for a sample of students enrolled at his university.Based on his regression results, the 95% confidence interval for the slope of the regression equation is -0.88 to 1.34.At α = 0.05, we can say ________________________ .
A)there is a statistically significant association between length of essays and SAT score.
B)the correlation between length of essays and SAT score is significant
C)the slope of the regression equation is significantly different from zero
D)the slope of the regression equation is not significantly different from zero
E)the relationship between length of essays and SAT scores is significant and negative
Unlock Deck
Unlock for access to all 19 flashcards in this deck.
Unlock Deck
k this deck
Unlock Deck
Unlock for access to all 19 flashcards in this deck.


