Deck 11: Economic Inequality
Full screen (f)
Question
Question
Question
Question
Question
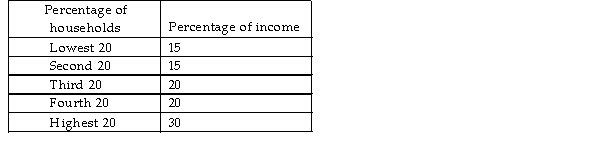
An economy has the income shares features set out in the table above. Which of the following is true?
A) The information in the table represents the income distribution in Australia.
B) Income in the Australian economy is less equally distributed than that represented in the table.
C) Income in the Australian economy is more equally distributed than that represented in the table.
D) The information in the table represents the wealth distribution in Australia.
Question
Question
Question
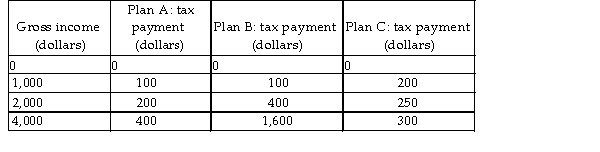
In the above table, which tax plan is regressive?
A) Only plan A
B) Only plan B
C) Only plan C
D) Both plan A and plan C
Question
Question
Question
Question
Question
The government in the country of Zappoo is trying to decide which tax plan to implement. The table above shows three alternative plans. If the government decides to implement a proportional income tax, it will implement tax plan _______.
A) B
B) C
C) A
D) None of the above because none of the above is a proportional tax.
Question
Question
Question
Question
Question
Question
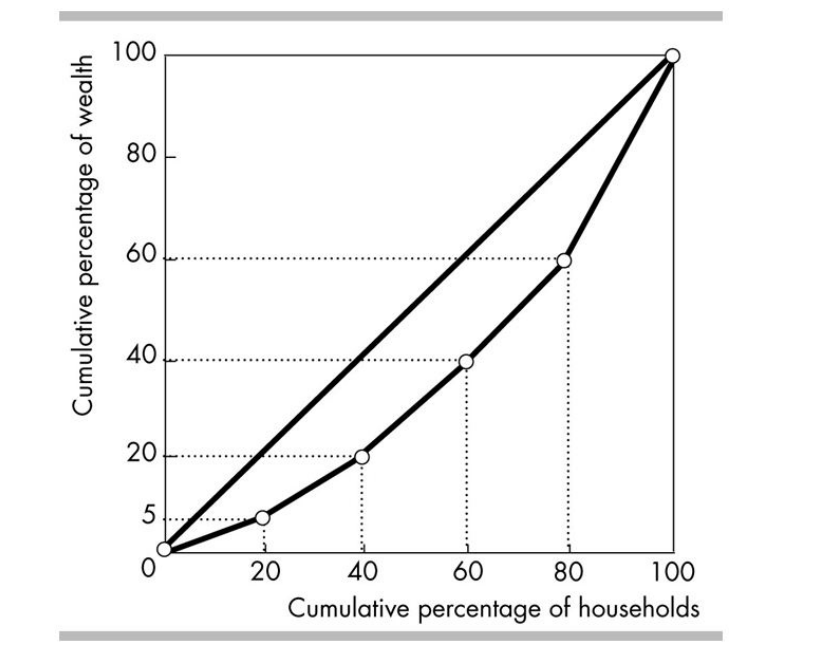
The above figure shows the Lorenz curve for wealth for the nation of Rusha. What percentage of wealth is owned by the poorest quintile?
A) 20 per cent
B) 0 per cent
C) 5 per cent
D) 35 per cent
Question
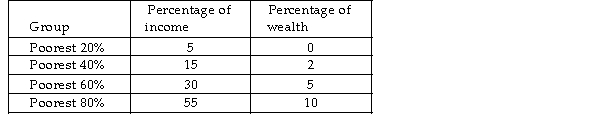
The above table shows the distribution of wealth and income in Miseria. The Lorenz curve for wealth would
A) lie parallel to the line of equality.
B) intersect the horizontal axis at 100 per cent.
C) become flatter as one moves from left to right.
D) bow outward more to the right than does the Lorenz curve for income.
Question
Question
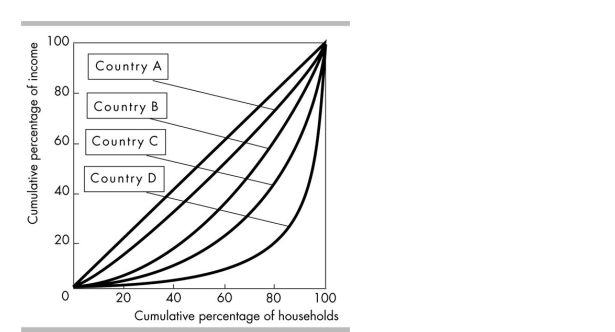
The above figure shows the Lorenz curves for four different countries. Which of the following statements CAN be made on the basis of the graph?
A) Country A is a socialist country.
B) Country C has the best balance between equity and efficiency.
C) The income distribution is more equal in country B than in country D.
D) All of the above.
Question
Question
Question
Question
Question
Question
Question
Question
Question
Question
Question
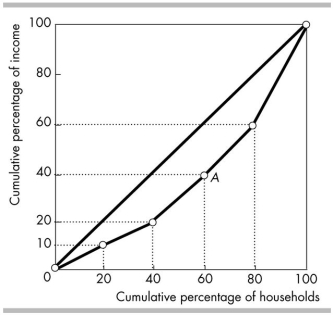
In the figure above, the poorest 20 per cent of all households receive what share of all income?
A) 10 per cent
B) 20 per cent
C) 30 per cent
D) 40 per cent
Question
Question
In the figure above, the richest 20 per cent of all households receive what share of all income?
A) 10 per cent
B) 20 per cent
C) 30 per cent
D) 40 per cent
Question
Question
Question
Question
Question
Question
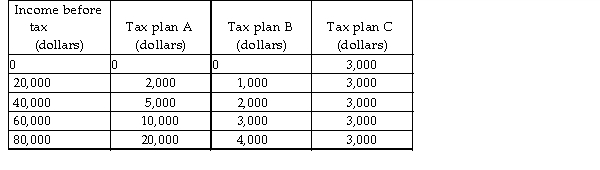
Alice, Bob and Cody live in Wesland. Their annual incomes and the amounts they pay in income tax are shown in the table below.  The income tax in Wesland is
A) progressive.
B) regressive.
C) proportional.
D) flat- rate.
The income tax in Wesland isA) progressive.
B) regressive.
C) proportional.
D) flat- rate.
Question
Question
Question

In the above table, which tax plan is progressive?
A) Only plan A
B) Only plan B
C) Only plan C
D) Both plan B and plan C
Question
Question
Question

In the figure above, line A represents the
A) line of equality.
B) line of equal number of people in each household.
C) line of equal consumption in each household.
D) line of disposable income distribution.
Question
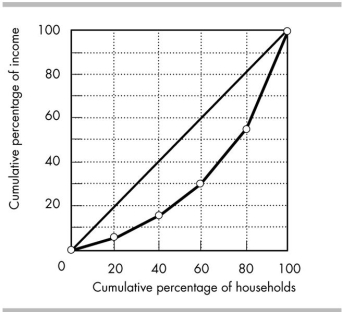
In the figure above, the poorest 40 per cent of households receive _______ of total income.
A) 30 per cent
B) 10 per cent
C) 15 per cent
D) 20 per cent
Question
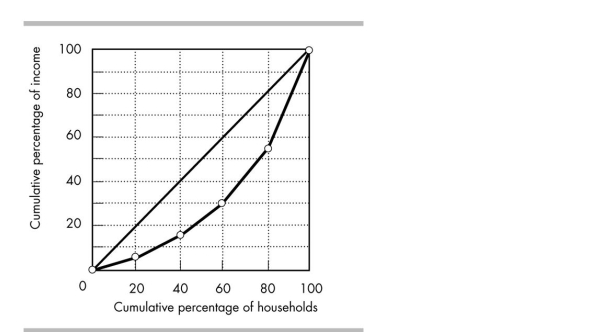
In the figure above, if income were distributed equally across all households, the richest 20 per cent of households would receive _______ of total income.
A) 15 per cent
B) 45 per cent
C) 25 per cent
D) 20 per cent
Question
Question
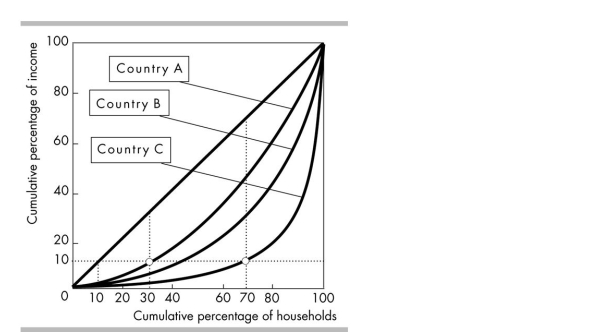
In the figure above, in which country does the highest- income 30 per cent of households have the highest fraction of the nation's income?
A) Country A
B) Country B
C) Country C
D) It is impossible to answer the question without more information.
Question
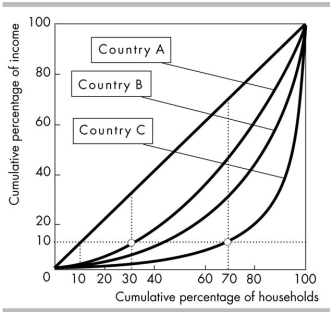
In the figure above, income
A) is most equally distributed in country A.
B) is most equally distributed in country B.
C) is most equally distributed in country C.
D) is equally distributed in all three countries.
Question
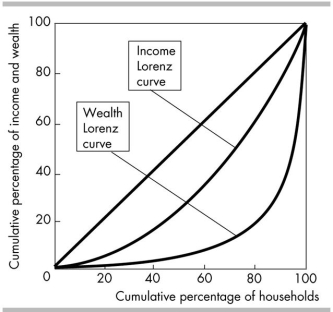
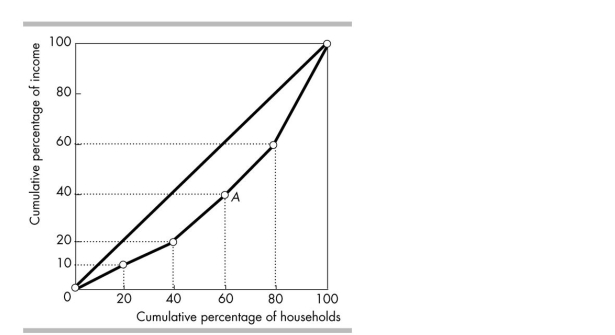
The Lorenz curves in the above figure imply that
A) income is distributed more unequally than wealth.
B) wealth is distributed more unequally than income.
C) both wealth and income are distributed equally.
D) both wealth and income are distributed at the same level of inequality.
Question
Question
Question
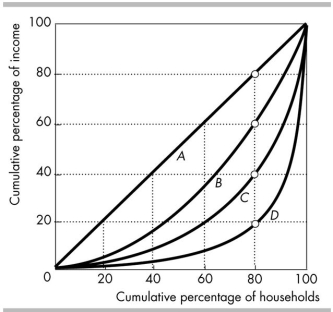
In the figure above, the Lorenz curve that shows the richest 20 per cent of households receiving 40 per cent of all income is
A) curve A.
B) curve B.
C) curve C.
D) curve D.
Question

In the above table, which tax plan is proportional?
A) Only plan A
B) Only plan B
C) Only plan C
D) Both plan A and plan C
Question
Question

In the figure above, the lowest 20 per cent of all households own _______ per cent of all wealth, the next lowest 20 per cent own _______ per cent of all wealth and the richest 20 per cent own _______ Per cent of all wealth.
A) 5; 15; 40
B) 20; 40; 100
C) 20; 20; 20
D) 5; 20; 60
Question
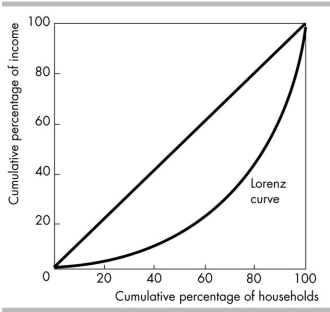
The Lorenz curve in the above figure implies that
A) the highest fifth of households account for less than 20 per cent of income.
B) income is equally distributed.
C) the lowest fifth of households account for less than 20 per cent of income.
D) the lowest fifth of households account for more than 20 per cent of income.
Question
Question
Question
Question
Question
Question
Question
Question
Question
Question
Question
Question
Question
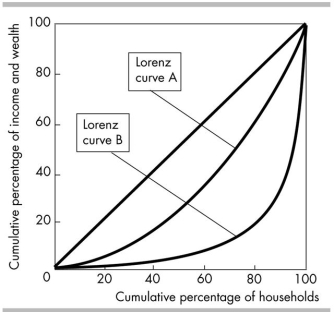
The above figure shows two Lorenz curves. Suppose both Lorenz curves measure wealth. Then, the curves show that wealth is
A) distributed more equally along Lorenz curve B.
B) greater along Lorenz curve B.
C) distributed more equally along Lorenz curve A.
D) greater along Lorenz curve A.
Question
Question
Question
Question
Question

The above table shows the distribution of income and wealth in Miseria. What percentage of income is earned by the richest twenty per cent?
A) 45 per cent
B) 5 per cent
C) 20 per cent
D) 55 per cent
Question
Question

Unlock Deck
Sign up to unlock the cards in this deck!
Unlock Deck
Unlock Deck
1/150
Play
Full screen (f)
Deck 11: Economic Inequality
1
Discrimination by customers creates a wage differential between two groups by creating a difference in the two groups' perceived
A) value of marginal product.
B) minimum wage.
C) supply of labour.
D) marginal cost of labour.
A) value of marginal product.
B) minimum wage.
C) supply of labour.
D) marginal cost of labour.
value of marginal product.
2
Measured wealth is a less accurate indicator of economic inequality than is measured income because measured wealth excludes
A) owner- occupied housing.
B) human capital.
C) financial assets.
D) depreciation.
A) owner- occupied housing.
B) human capital.
C) financial assets.
D) depreciation.
human capital.
3
The Australian tax system
A) reduces inequality and shifts the Lorenz curve away from the line of equality.
B) increases inequality and shifts the Lorenz curve toward the line of equality.
C) increases inequality and shifts the Lorenz curve away from the line of equality.
D) reduces inequality and shifts the Lorenz curve toward the line of equality.
reduces inequality and shifts the Lorenz curve toward the line of equality.
4
Disposable income is
A) wages, interest, rent, and profit earned in factor markets.
B) wages, interest, rent, and profit earned in factor markets, plus government cash benefits, less taxes.
C) interest earned in factor markets.
D) profit earned in factor markets, less taxes.
A) wages, interest, rent, and profit earned in factor markets.
B) wages, interest, rent, and profit earned in factor markets, plus government cash benefits, less taxes.
C) interest earned in factor markets.
D) profit earned in factor markets, less taxes.
Unlock Deck
Unlock for access to all 150 flashcards in this deck.
Unlock Deck
k this deck
5
An economy has the income shares features set out in the table above. Which of the following is true?
A) The information in the table represents the income distribution in Australia.
B) Income in the Australian economy is less equally distributed than that represented in the table.
C) Income in the Australian economy is more equally distributed than that represented in the table.
D) The information in the table represents the wealth distribution in Australia.
Unlock Deck
Unlock for access to all 150 flashcards in this deck.
Unlock Deck
k this deck
6
If a tax was instituted such that every dollar collected in taxes from high- income households resulted in a distribution of $0.80 to low- income households,
A) efficiency and equality of incomes would both increase.
B) efficiency and equality of incomes would both decrease.
C) efficiency would increase but equality of incomes would decrease.
D) equality of incomes would increase but efficiency would decrease.
A) efficiency and equality of incomes would both increase.
B) efficiency and equality of incomes would both decrease.
C) efficiency would increase but equality of incomes would decrease.
D) equality of incomes would increase but efficiency would decrease.
Unlock Deck
Unlock for access to all 150 flashcards in this deck.
Unlock Deck
k this deck
7
Lifetime income is distributed
A) more equally than annual income and more equally than measured wealth.
B) less equally than annual income and less equally than measured wealth.
C) less equally than annual income and more equally than measured wealth.
D) more equally than annual income and less equally than measured wealth.
A) more equally than annual income and more equally than measured wealth.
B) less equally than annual income and less equally than measured wealth.
C) less equally than annual income and more equally than measured wealth.
D) more equally than annual income and less equally than measured wealth.
Unlock Deck
Unlock for access to all 150 flashcards in this deck.
Unlock Deck
k this deck
8
In the above table, which tax plan is regressive?
A) Only plan A
B) Only plan B
C) Only plan C
D) Both plan A and plan C
Unlock Deck
Unlock for access to all 150 flashcards in this deck.
Unlock Deck
k this deck
9
From left to right, the horizontal axis of the Lorenz curve ranks households from
A) smallest to largest.
B) poorest to richest.
C) richest to poorest.
D) largest to smallest.
A) smallest to largest.
B) poorest to richest.
C) richest to poorest.
D) largest to smallest.
Unlock Deck
Unlock for access to all 150 flashcards in this deck.
Unlock Deck
k this deck
10
In Australia
A) the mode income equals the mean income.
B) there are more households with incomes below the mean income than above the mean income.
C) there are more households with incomes above the mean income than below the mean income.
D) the income distribution is bell- shaped.
A) the mode income equals the mean income.
B) there are more households with incomes below the mean income than above the mean income.
C) there are more households with incomes above the mean income than below the mean income.
D) the income distribution is bell- shaped.
Unlock Deck
Unlock for access to all 150 flashcards in this deck.
Unlock Deck
k this deck
11
Since 1995, the distribution of income in Australia
A) generally has become less equal.
B) has shown no discernible trend.
C) generally has become more equal.
D) has become more equal than the distribution of wealth.
A) generally has become less equal.
B) has shown no discernible trend.
C) generally has become more equal.
D) has become more equal than the distribution of wealth.
Unlock Deck
Unlock for access to all 150 flashcards in this deck.
Unlock Deck
k this deck
12
An income tax in which the average tax rate increases with income is called a
A) progressive income tax.
B) flat- rate income tax.
C) proportional income tax.
D) regressive income tax.
A) progressive income tax.
B) flat- rate income tax.
C) proportional income tax.
D) regressive income tax.
Unlock Deck
Unlock for access to all 150 flashcards in this deck.
Unlock Deck
k this deck
13
The government in the country of Zappoo is trying to decide which tax plan to implement. The table above shows three alternative plans. If the government decides to implement a proportional income tax, it will implement tax plan _______.
A) B
B) C
C) A
D) None of the above because none of the above is a proportional tax.
Unlock Deck
Unlock for access to all 150 flashcards in this deck.
Unlock Deck
k this deck
14
The federal income tax is
A) proportional.
B) regressive.
C) a flat- rate tax.
D) progressive.
A) proportional.
B) regressive.
C) a flat- rate tax.
D) progressive.
Unlock Deck
Unlock for access to all 150 flashcards in this deck.
Unlock Deck
k this deck
15
High- skilled workers have
A) the same labour supply curve as do low- skilled workers.
B) more human capital than do low- skilled workers.
C) a lower value of marginal product because they have higher wages.
D) None of the above answers is correct.
A) the same labour supply curve as do low- skilled workers.
B) more human capital than do low- skilled workers.
C) a lower value of marginal product because they have higher wages.
D) None of the above answers is correct.
Unlock Deck
Unlock for access to all 150 flashcards in this deck.
Unlock Deck
k this deck
16
In Australia the lowest- income 20 per cent of households receives about _______ of total income.
A) 8 per cent
B) 10 per cent
C) 15 per cent
D) 1 per cent
A) 8 per cent
B) 10 per cent
C) 15 per cent
D) 1 per cent
Unlock Deck
Unlock for access to all 150 flashcards in this deck.
Unlock Deck
k this deck
17
Among Australia, Canada, and South Africa, income is distributed most equally in _______ and least equally in _______.
A) Canada; Australia
B) South Africa; Australia
C) Australia; South Africa
D) Canada; South Africa
A) Canada; Australia
B) South Africa; Australia
C) Australia; South Africa
D) Canada; South Africa
Unlock Deck
Unlock for access to all 150 flashcards in this deck.
Unlock Deck
k this deck
18
An income tax for which the average tax rate is constant is called a
A) regressive income tax.
B) progressive income tax.
C) marginal income tax.
D) proportional income tax.
A) regressive income tax.
B) progressive income tax.
C) marginal income tax.
D) proportional income tax.
Unlock Deck
Unlock for access to all 150 flashcards in this deck.
Unlock Deck
k this deck
19
The above figure shows the Lorenz curve for wealth for the nation of Rusha. What percentage of wealth is owned by the poorest quintile?
A) 20 per cent
B) 0 per cent
C) 5 per cent
D) 35 per cent
Unlock Deck
Unlock for access to all 150 flashcards in this deck.
Unlock Deck
k this deck
20
The above table shows the distribution of wealth and income in Miseria. The Lorenz curve for wealth would
A) lie parallel to the line of equality.
B) intersect the horizontal axis at 100 per cent.
C) become flatter as one moves from left to right.
D) bow outward more to the right than does the Lorenz curve for income.
Unlock Deck
Unlock for access to all 150 flashcards in this deck.
Unlock Deck
k this deck
21
If customer discrimination does not exist, firms that discriminate on the basis of race or sex will
A) tend to survive whereas firms that do not discriminate will tend to fail.
B) have lower costs than those that do not.
C) have higher costs than those that do not.
D) have the same level of costs as those that do not.
A) tend to survive whereas firms that do not discriminate will tend to fail.
B) have lower costs than those that do not.
C) have higher costs than those that do not.
D) have the same level of costs as those that do not.
Unlock Deck
Unlock for access to all 150 flashcards in this deck.
Unlock Deck
k this deck
22
The above figure shows the Lorenz curves for four different countries. Which of the following statements CAN be made on the basis of the graph?
A) Country A is a socialist country.
B) Country C has the best balance between equity and efficiency.
C) The income distribution is more equal in country B than in country D.
D) All of the above.
Unlock Deck
Unlock for access to all 150 flashcards in this deck.
Unlock Deck
k this deck
23
A tax is progressive if the average tax rate
A) is negative.
B) increases as income decreases.
C) is positive.
D) increases as income increases.
A) is negative.
B) increases as income decreases.
C) is positive.
D) increases as income increases.
Unlock Deck
Unlock for access to all 150 flashcards in this deck.
Unlock Deck
k this deck
24
Which of the following statements is true?
A) Both wealth and income measure variables over a period of time.
B) Wealth measures a variable over a period of time, and income measures a variable at a point in time.
C) Wealth measures a variable at a point in time and income measures a variable over a period of time.
D) Both wealth and income measure variables at a point in time.
Unlock Deck
Unlock for access to all 150 flashcards in this deck.
Unlock Deck
k this deck
25
Economists who have compared the incomes of never- married men and women have found that with equal amounts of human capital, _______.
A) women earn significantly more than men
B) the wages of these two groups are the same
C) men earn significantly more than women
D) men specialise more in home production
A) women earn significantly more than men
B) the wages of these two groups are the same
C) men earn significantly more than women
D) men specialise more in home production
Unlock Deck
Unlock for access to all 150 flashcards in this deck.
Unlock Deck
k this deck
26
Relative to the supply curve of high- skilled workers, the supply curve of low- skilled workers is
A) on top of the high- skilled worker supply curve.
B) to the left.
C) above.
D) to the right.
A) on top of the high- skilled worker supply curve.
B) to the left.
C) above.
D) to the right.
Unlock Deck
Unlock for access to all 150 flashcards in this deck.
Unlock Deck
k this deck
27
The Australian GST is a _______ tax.
A) negative
B) proportional
C) progressive
D) regressive
A) negative
B) proportional
C) progressive
D) regressive
Unlock Deck
Unlock for access to all 150 flashcards in this deck.
Unlock Deck
k this deck
28
Which of the following is an example of an indirect benefit?
A) Medicare reimbursements to hospitals
B) Government payments to the unemployed
C) Income taxes
D) Government payments to retirees
A) Medicare reimbursements to hospitals
B) Government payments to the unemployed
C) Income taxes
D) Government payments to retirees
Unlock Deck
Unlock for access to all 150 flashcards in this deck.
Unlock Deck
k this deck
29
A regressive income tax is defined as a tax for which
A) total taxes paid are independent of the level of income.
B) the average tax rate decreases with the level of income.
C) the average tax rate increases with the level of income.
D) total taxes paid increase with the level of income.
A) total taxes paid are independent of the level of income.
B) the average tax rate decreases with the level of income.
C) the average tax rate increases with the level of income.
D) total taxes paid increase with the level of income.
Unlock Deck
Unlock for access to all 150 flashcards in this deck.
Unlock Deck
k this deck
30
If a Lorenz curve moves leftward and becomes closer to the line of equality over time, then
A) income is becoming more equally distributed.
B) income is becoming more unequally distributed.
C) the population is growing.
D) income is growing.
A) income is becoming more equally distributed.
B) income is becoming more unequally distributed.
C) the population is growing.
D) income is growing.
Unlock Deck
Unlock for access to all 150 flashcards in this deck.
Unlock Deck
k this deck
31
When a group is discriminated against its
A) employment and its wages are unaffected.
B) wages fall but its employment does not.
C) employment decreases but its wages do not.
D) employment and its wages decrease.
A) employment and its wages are unaffected.
B) wages fall but its employment does not.
C) employment decreases but its wages do not.
D) employment and its wages decrease.
Unlock Deck
Unlock for access to all 150 flashcards in this deck.
Unlock Deck
k this deck
32
A tax is regressive if the average tax rate
A) is negative.
B) is less than one.
C) increases as income increases.
D) increases as income decreases.
A) is negative.
B) is less than one.
C) increases as income increases.
D) increases as income decreases.
Unlock Deck
Unlock for access to all 150 flashcards in this deck.
Unlock Deck
k this deck
33
In the figure above, the poorest 20 per cent of all households receive what share of all income?
A) 10 per cent
B) 20 per cent
C) 30 per cent
D) 40 per cent
Unlock Deck
Unlock for access to all 150 flashcards in this deck.
Unlock Deck
k this deck
34
The more Clayton earns, the higher is his average tax rate. Clayton faces a _______ income tax.
A) progressive
B) proportional
C) flat- rate
D) regressive
A) progressive
B) proportional
C) flat- rate
D) regressive
Unlock Deck
Unlock for access to all 150 flashcards in this deck.
Unlock Deck
k this deck
35
In the figure above, the richest 20 per cent of all households receive what share of all income?
A) 10 per cent
B) 20 per cent
C) 30 per cent
D) 40 per cent
Unlock Deck
Unlock for access to all 150 flashcards in this deck.
Unlock Deck
k this deck
36
One possible reason that Australian income distribution has become more unequal is
A) information technology has increased the supply of unskilled labour.
B) information technology has decreased the supply of unskilled labour.
C) information technology has decreased the demand for unskilled labour.
D) information technology has increased the demand for unskilled labour.
A) information technology has increased the supply of unskilled labour.
B) information technology has decreased the supply of unskilled labour.
C) information technology has decreased the demand for unskilled labour.
D) information technology has increased the demand for unskilled labour.
Unlock Deck
Unlock for access to all 150 flashcards in this deck.
Unlock Deck
k this deck
37
The "big tradeoff" refers to the point that governmental redistribution of income causes
A) more efficiency because it strengthens incentives to work.
B) less efficiency because it strengthens incentives to work.
C) less efficiency because it weakens incentives to work.
D) more efficiency because it weakens incentives to work.
A) more efficiency because it strengthens incentives to work.
B) less efficiency because it strengthens incentives to work.
C) less efficiency because it weakens incentives to work.
D) more efficiency because it weakens incentives to work.
Unlock Deck
Unlock for access to all 150 flashcards in this deck.
Unlock Deck
k this deck
38
A income tax system in which the average tax rate decreases with the level of income is called a
A) progressive income tax system.
B) regressive income tax system.
C) flat- rate income tax system.
D) proportional income tax system.
A) progressive income tax system.
B) regressive income tax system.
C) flat- rate income tax system.
D) proportional income tax system.
Unlock Deck
Unlock for access to all 150 flashcards in this deck.
Unlock Deck
k this deck
39
Globalisation means that firms recruit top talent from the global talent pool. Globalisation means that the payoffs won by the contest winners _______.
A) do not change in size
B) decrease in size
C) increase in size
D) might increase, decrease, or not change depending on whether the demand for contests changes by more than, less than, or the same amount as the supply of contests
A) do not change in size
B) decrease in size
C) increase in size
D) might increase, decrease, or not change depending on whether the demand for contests changes by more than, less than, or the same amount as the supply of contests
Unlock Deck
Unlock for access to all 150 flashcards in this deck.
Unlock Deck
k this deck
40
In Australia, the poorest 40 per cent of households own about _______ of total wealth.
A) 40 per cent
B) 5.4 per cent
C) 6.3 per cent
D) 0.9 per cent
A) 40 per cent
B) 5.4 per cent
C) 6.3 per cent
D) 0.9 per cent
Unlock Deck
Unlock for access to all 150 flashcards in this deck.
Unlock Deck
k this deck
41
Alice, Bob and Cody live in Wesland. Their annual incomes and the amounts they pay in income tax are shown in the table below. The income tax in Wesland is
A) progressive.
B) regressive.
C) proportional.
D) flat- rate.
The income tax in Wesland isA) progressive.
B) regressive.
C) proportional.
D) flat- rate.
Unlock Deck
Unlock for access to all 150 flashcards in this deck.
Unlock Deck
k this deck
42
Income is distributed very unequally in _______ and relatively more equally in _______.
A) Australia and South Africa; Brazil and Canada
B) Brazil and South Africa; Australia and Canada
C) Brazil and Canada; Australia and South Africa
D) Australia and Canada; Brazil and South Africa
A) Australia and South Africa; Brazil and Canada
B) Brazil and South Africa; Australia and Canada
C) Brazil and Canada; Australia and South Africa
D) Australia and Canada; Brazil and South Africa
Unlock Deck
Unlock for access to all 150 flashcards in this deck.
Unlock Deck
k this deck
43
The higher the cost of acquiring skills, the _______ are the high- skilled and low- skilled labour _______ curves.
A) farther apart; demand
B) farther apart; supply
C) closer together; demand
D) closer together; supply
A) farther apart; demand
B) farther apart; supply
C) closer together; demand
D) closer together; supply
Unlock Deck
Unlock for access to all 150 flashcards in this deck.
Unlock Deck
k this deck
44
In the above table, which tax plan is progressive?
A) Only plan A
B) Only plan B
C) Only plan C
D) Both plan B and plan C
Unlock Deck
Unlock for access to all 150 flashcards in this deck.
Unlock Deck
k this deck
45
Over the period from 1995 to 2010, the Australian Gini ratio for household income _______, which means income inequality in Australia _______.
A) decreased; increased
B) decreased; decreased
C) increased; increased
D) increased; decreased
A) decreased; increased
B) decreased; decreased
C) increased; increased
D) increased; decreased
Unlock Deck
Unlock for access to all 150 flashcards in this deck.
Unlock Deck
k this deck
46
The demand curve for high- skilled labour lies to the right of the demand curve for low- skilled labour because
A) high- skilled workers require more compensation to convince them to work than do low- skilled workers.
B) there are more high- skilled workers than low- skilled workers.
C) high- skilled labour is more productive than low- skilled labour.
D) firms need not be concerned with the minimum wage in the market for high- skilled labour.
Unlock Deck
Unlock for access to all 150 flashcards in this deck.
Unlock Deck
k this deck
47
In the figure above, line A represents the
A) line of equality.
B) line of equal number of people in each household.
C) line of equal consumption in each household.
D) line of disposable income distribution.
Unlock Deck
Unlock for access to all 150 flashcards in this deck.
Unlock Deck
k this deck
48
In the figure above, the poorest 40 per cent of households receive _______ of total income.
A) 30 per cent
B) 10 per cent
C) 15 per cent
D) 20 per cent
Unlock Deck
Unlock for access to all 150 flashcards in this deck.
Unlock Deck
k this deck
49
In the figure above, if income were distributed equally across all households, the richest 20 per cent of households would receive _______ of total income.
A) 15 per cent
B) 45 per cent
C) 25 per cent
D) 20 per cent
Unlock Deck
Unlock for access to all 150 flashcards in this deck.
Unlock Deck
k this deck
50
The lifetime income distribution of income is a _______ accurate indicator of the degree of economic inequality than the distribution of _______.
A) less; annual Lorenz curves
B) more; annual income
C) less; wealth
D) less; annual income
A) less; annual Lorenz curves
B) more; annual income
C) less; wealth
D) less; annual income
Unlock Deck
Unlock for access to all 150 flashcards in this deck.
Unlock Deck
k this deck
51
In the figure above, in which country does the highest- income 30 per cent of households have the highest fraction of the nation's income?
A) Country A
B) Country B
C) Country C
D) It is impossible to answer the question without more information.
Unlock Deck
Unlock for access to all 150 flashcards in this deck.
Unlock Deck
k this deck
52
In the figure above, income
A) is most equally distributed in country A.
B) is most equally distributed in country B.
C) is most equally distributed in country C.
D) is equally distributed in all three countries.
Unlock Deck
Unlock for access to all 150 flashcards in this deck.
Unlock Deck
k this deck
53
The Lorenz curves in the above figure imply that
A) income is distributed more unequally than wealth.
B) wealth is distributed more unequally than income.
C) both wealth and income are distributed equally.
D) both wealth and income are distributed at the same level of inequality.
Unlock Deck
Unlock for access to all 150 flashcards in this deck.
Unlock Deck
k this deck
54
In the figure above, the second richest 20 per cent of households receive _______ of total income.
A) 55 per cent
B) 45 per cent
C) 25 per cent
D) 35 per cent
A) 55 per cent
B) 45 per cent
C) 25 per cent
D) 35 per cent
Unlock Deck
Unlock for access to all 150 flashcards in this deck.
Unlock Deck
k this deck
55
If the area between the line of equality and the Lorenz curve is 1,250, and the entire area beneath the line of equality is 5,000, the Gini ratio is
A) 0.33
B) 0.25
C) 4.00
D) 0.80
A) 0.33
B) 0.25
C) 4.00
D) 0.80
Unlock Deck
Unlock for access to all 150 flashcards in this deck.
Unlock Deck
k this deck
56
In the figure above, the Lorenz curve that shows the richest 20 per cent of households receiving 40 per cent of all income is
A) curve A.
B) curve B.
C) curve C.
D) curve D.
Unlock Deck
Unlock for access to all 150 flashcards in this deck.
Unlock Deck
k this deck
57
In the above table, which tax plan is proportional?
A) Only plan A
B) Only plan B
C) Only plan C
D) Both plan A and plan C
Unlock Deck
Unlock for access to all 150 flashcards in this deck.
Unlock Deck
k this deck
58
Since 1970, the world Gini ratio has _______ indicating that the world distribution of income has _______.
A) not change; not changed
B) risen; become more equal
C) risen; become less equal
D) fallen; become more equal
A) not change; not changed
B) risen; become more equal
C) risen; become less equal
D) fallen; become more equal
Unlock Deck
Unlock for access to all 150 flashcards in this deck.
Unlock Deck
k this deck
59
In the figure above, the lowest 20 per cent of all households own _______ per cent of all wealth, the next lowest 20 per cent own _______ per cent of all wealth and the richest 20 per cent own _______ Per cent of all wealth.
A) 5; 15; 40
B) 20; 40; 100
C) 20; 20; 20
D) 5; 20; 60
Unlock Deck
Unlock for access to all 150 flashcards in this deck.
Unlock Deck
k this deck
60
The Lorenz curve in the above figure implies that
A) the highest fifth of households account for less than 20 per cent of income.
B) income is equally distributed.
C) the lowest fifth of households account for less than 20 per cent of income.
D) the lowest fifth of households account for more than 20 per cent of income.
Unlock Deck
Unlock for access to all 150 flashcards in this deck.
Unlock Deck
k this deck
61
The closer an income Lorenz curve is to the line of equality, the
A) faster income is growing.
B) less equally income is distributed.
C) more equally income is distributed.
D) slower income is growing.
A) faster income is growing.
B) less equally income is distributed.
C) more equally income is distributed.
D) slower income is growing.
Unlock Deck
Unlock for access to all 150 flashcards in this deck.
Unlock Deck
k this deck
62
In Australia, the Lorenz curve for wealth is _______ from the 45- degree line than is the Lorenz curve for income, which means that the distribution of wealth is more _______ than the distribution of income.
A) closer to; unequal
B) farther away from; unequal
C) farther away from; equal
D) closer to; equal
A) closer to; unequal
B) farther away from; unequal
C) farther away from; equal
D) closer to; equal
Unlock Deck
Unlock for access to all 150 flashcards in this deck.
Unlock Deck
k this deck
63
Measured distributions of wealth that do not consider the role of human capital
A) are more equal than the distribution of consumption.
B) understate the inequality in wealth distribution.
C) are more equal than the distribution of income.
D) overstate the inequality in wealth distribution.
A) are more equal than the distribution of consumption.
B) understate the inequality in wealth distribution.
C) are more equal than the distribution of income.
D) overstate the inequality in wealth distribution.
Unlock Deck
Unlock for access to all 150 flashcards in this deck.
Unlock Deck
k this deck
64
If the area between the line of equality and the Lorenz curve is 1,000, and the entire area beneath the line of equality is 5,000, the Gini ratio is
A) 0.8
B) 0.1
C) 0.2
D) 0.5
A) 0.8
B) 0.1
C) 0.2
D) 0.5
Unlock Deck
Unlock for access to all 150 flashcards in this deck.
Unlock Deck
k this deck
65
A proportional income tax is defined as a tax for which
A) total taxes paid are independent of the level of income.
B) the average tax rate increases with the level of income.
C) the average tax rate is the same at all levels of income.
D) total taxes paid increase with the level of income.
A) total taxes paid are independent of the level of income.
B) the average tax rate increases with the level of income.
C) the average tax rate is the same at all levels of income.
D) total taxes paid increase with the level of income.
Unlock Deck
Unlock for access to all 150 flashcards in this deck.
Unlock Deck
k this deck
66
Relative to the demand curve for low- skilled workers, the demand curve for high- skilled workers lies
A) to the left.
B) to the right.
C) in the same place.
D) below.
A) to the left.
B) to the right.
C) in the same place.
D) below.
Unlock Deck
Unlock for access to all 150 flashcards in this deck.
Unlock Deck
k this deck
67
Information technologies are a _______ for low- skilled labour and a _______ for high- skilled labour.
A) substitute; complement
B) substitute; substitute
C) complement; complement
D) complement; substitute
A) substitute; complement
B) substitute; substitute
C) complement; complement
D) complement; substitute
Unlock Deck
Unlock for access to all 150 flashcards in this deck.
Unlock Deck
k this deck
68
With a proportional tax
A) all households pay the same percentage of their income as taxes.
B) a poor household pays a larger percentage of its income in taxes than a rich one.
C) all households pay the same total amount of tax.
D) a rich household pays a larger percentage of its income in taxes than a poor one.
A) all households pay the same percentage of their income as taxes.
B) a poor household pays a larger percentage of its income in taxes than a rich one.
C) all households pay the same total amount of tax.
D) a rich household pays a larger percentage of its income in taxes than a poor one.
Unlock Deck
Unlock for access to all 150 flashcards in this deck.
Unlock Deck
k this deck
69
A Lorenz curve measures
A) the benefits received through welfare programs.
B) the actual income distribution and compares it to an equal income distribution.
C) the effect of flat taxes on income distribution.
D) the degree to which income taxes are regressive.
A) the benefits received through welfare programs.
B) the actual income distribution and compares it to an equal income distribution.
C) the effect of flat taxes on income distribution.
D) the degree to which income taxes are regressive.
Unlock Deck
Unlock for access to all 150 flashcards in this deck.
Unlock Deck
k this deck
70
The income distribution in Australia is
A) bell- shaped.
B) negatively skewed.
C) uniform.
D) positively skewed.
A) bell- shaped.
B) negatively skewed.
C) uniform.
D) positively skewed.
Unlock Deck
Unlock for access to all 150 flashcards in this deck.
Unlock Deck
k this deck
71
The world distribution of income has become more equal since 1970 because
A) foreign aid programs from rich nations have increased in size and especially in effectiveness.
B) the distribution of income within most countries has become more equal.
C) average incomes in poor nations, such as China, have risen faster than average incomes in rich nations, such as Australia.
D) None of the above answers is correct.
Unlock Deck
Unlock for access to all 150 flashcards in this deck.
Unlock Deck
k this deck
72
Regressive income taxes are
A) present when the average tax rate decreases as income increases.
B) present when the average tax rate decreases as income decreases.
C) an important form of income redistribution.
D) Both answers A and B are correct.
A) present when the average tax rate decreases as income increases.
B) present when the average tax rate decreases as income decreases.
C) an important form of income redistribution.
D) Both answers A and B are correct.
Unlock Deck
Unlock for access to all 150 flashcards in this deck.
Unlock Deck
k this deck
73
The above figure shows two Lorenz curves. Suppose both Lorenz curves measure wealth. Then, the curves show that wealth is
A) distributed more equally along Lorenz curve B.
B) greater along Lorenz curve B.
C) distributed more equally along Lorenz curve A.
D) greater along Lorenz curve A.
Unlock Deck
Unlock for access to all 150 flashcards in this deck.
Unlock Deck
k this deck
74
Assortative mating results in
A) wealth becoming more concentrated among families.
B) the Lorenz curve moving rightward, closer to the line of equality.
C) people marrying at a later age.
D) many people being able to marry their way out of poverty.
A) wealth becoming more concentrated among families.
B) the Lorenz curve moving rightward, closer to the line of equality.
C) people marrying at a later age.
D) many people being able to marry their way out of poverty.
Unlock Deck
Unlock for access to all 150 flashcards in this deck.
Unlock Deck
k this deck
75
High- skilled workers earn more than low- skilled workers in part because
A) high- skilled workers have higher values of marginal product.
B) of government legislation.
C) the demand for high- skilled workers is more elastic.
D) the supply of high- skilled workers is more elastic.
A) high- skilled workers have higher values of marginal product.
B) of government legislation.
C) the demand for high- skilled workers is more elastic.
D) the supply of high- skilled workers is more elastic.
Unlock Deck
Unlock for access to all 150 flashcards in this deck.
Unlock Deck
k this deck
76
The mode household income is
A) the income that separates households into two equal groups.
B) the mean household income.
C) the most common household income.
D) the average household income.
A) the income that separates households into two equal groups.
B) the mean household income.
C) the most common household income.
D) the average household income.
Unlock Deck
Unlock for access to all 150 flashcards in this deck.
Unlock Deck
k this deck
77
Assortative mating means that
A) poor women and rich men tend to marry.
B) there are limited incentives to marry anyone.
C) rich women and poor men tend to marry.
D) rich women and rich men tend to marry.
A) poor women and rich men tend to marry.
B) there are limited incentives to marry anyone.
C) rich women and poor men tend to marry.
D) rich women and rich men tend to marry.
Unlock Deck
Unlock for access to all 150 flashcards in this deck.
Unlock Deck
k this deck
78
The above table shows the distribution of income and wealth in Miseria. What percentage of income is earned by the richest twenty per cent?
A) 45 per cent
B) 5 per cent
C) 20 per cent
D) 55 per cent
Unlock Deck
Unlock for access to all 150 flashcards in this deck.
Unlock Deck
k this deck
79
The distribution of wealth is skewed in part because people with high wealth
A) have very little skills.
B) tend to marry people with similar wealth.
C) save very little.
D) do not earn much more than those with low incomes.
A) have very little skills.
B) tend to marry people with similar wealth.
C) save very little.
D) do not earn much more than those with low incomes.
Unlock Deck
Unlock for access to all 150 flashcards in this deck.
Unlock Deck
k this deck
80
Joe earns $100,000 per year. He pays a tax rate of 28 per cent on the first $60,000 of income and a tax rate of 15 per cent on income above $60,000. This tax system is an example of a
A) proportional income tax.
B) progressive income tax.
C) regressive income tax.
D) negative income tax.
A) proportional income tax.
B) progressive income tax.
C) regressive income tax.
D) negative income tax.
Unlock Deck
Unlock for access to all 150 flashcards in this deck.
Unlock Deck
k this deck
Unlock Deck
Unlock for access to all 150 flashcards in this deck.


