Deck 10: Two-Sample Tests of Hypothesis
Full screen (f)
Question
Question
A national manufacturer of ball bearings is experimenting with two different processes for producing precision ball bearings. It is important that the diameters be as close as possible to an industry standard. The output from each process is sampled and the average error from the industry standard is calculated. The results are presented below. 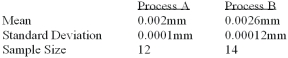 The researcher is interested in determining whether there is evidence that the two processes yield different average errors. Ball Bearings
Hypothesis Test: Independent Groups (t-test, pooled variance)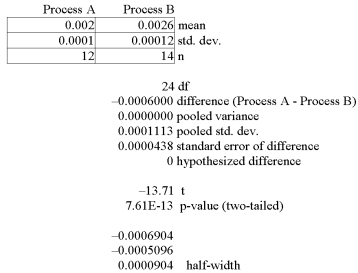 What is the decision at the 1% level of significance?
A) Reject the null hypothesis and conclude the means are different.
B) Reject the null hypothesis and conclude the means are the same.
C) Fail to reject the null hypothesis and conclude the means are the same.
D) Fail to reject the null hypothesis and conclude the means are different.
E) None of these statements are correct.
The researcher is interested in determining whether there is evidence that the two processes yield different average errors. Ball BearingsHypothesis Test: Independent Groups (t-test, pooled variance)
What is the decision at the 1% level of significance?A) Reject the null hypothesis and conclude the means are different.
B) Reject the null hypothesis and conclude the means are the same.
C) Fail to reject the null hypothesis and conclude the means are the same.
D) Fail to reject the null hypothesis and conclude the means are different.
E) None of these statements are correct.
Question
A national manufacturer of ball bearings is experimenting with two different processes for producing precision ball bearings. It is important that the diameters be as close as possible to an industry standard. The output from each process is sampled and the average error from the industry standard is calculated. The results are presented below. 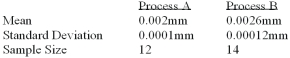 The researcher is interested in determining whether there is evidence that the two processes yield different average errors. Given the following megastat printout, what analysis and decision can be made?
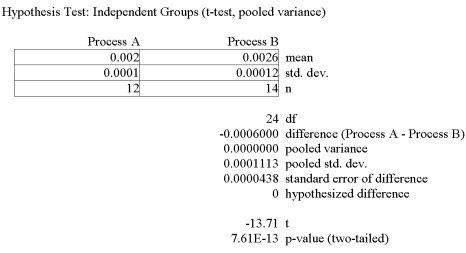
A) Reject the null hypothesis and conclude the means are different.
B) Reject the null hypothesis and conclude the means are the same.
C) Fail to reject the null hypothesis at the 1% level of significance.
D) Fail to reject the null hypothesis at the 5% level of significance and conclude the means are different.
E) None of these statements are correct.
The researcher is interested in determining whether there is evidence that the two processes yield different average errors. Given the following megastat printout, what analysis and decision can be made? A) Reject the null hypothesis and conclude the means are different.
B) Reject the null hypothesis and conclude the means are the same.
C) Fail to reject the null hypothesis at the 1% level of significance.
D) Fail to reject the null hypothesis at the 5% level of significance and conclude the means are different.
E) None of these statements are correct.
Question
Question
The net weights of a sample of bottles filled by a machine manufactured by Edne, and the net weights of a sample filled by a similar machine manufactured by Orno, Inc., are (in grams): 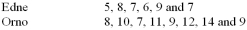
Testing the claim at the 0.05 level the mean weight of the bottles filled by the Orno machine is greater than the mean weight of the bottles filled by the Edne machine, what is the critical value?
A) -1.96
B) -2.837
C) -6.271
D) +3.674
E) None of these statements is correct
Testing the claim at the 0.05 level the mean weight of the bottles filled by the Orno machine is greater than the mean weight of the bottles filled by the Edne machine, what is the critical value?
A) -1.96
B) -2.837
C) -6.271
D) +3.674
E) None of these statements is correct
Question
A national manufacturer of ball bearings is experimenting with two different processes for producing precision ball bearings. It is important that the diameters be as close as possible to an industry standard. The output from each process is sampled and the average error from the industry standard is calculated. The results are presented below. 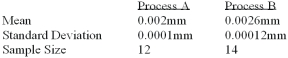 The researcher is interested in determining whether there is evidence that the two processes yield different average errors.
What is the null hypothesis?
A) µA - µB = 0
B) µA - µB ≠ 0
C) µA - µB ≤ 0
D) µA - µB > 0
E) None of these statements are correct
The researcher is interested in determining whether there is evidence that the two processes yield different average errors.What is the null hypothesis?
A) µA - µB = 0
B) µA - µB ≠ 0
C) µA - µB ≤ 0
D) µA - µB > 0
E) None of these statements are correct
Question
A national manufacturer of ball bearings is experimenting with two different processes for producing precision ball bearings. It is important that the diameters be as close as possible to an industry standard. The output from each process is sampled and the average error from the industry standard is calculated. The results are presented below. 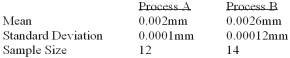 The researcher is interested in determining whether there is evidence that the two processes yield different average errors. What is the critical t value at the 1% level of significance?
A) +2.779
B) -2.492
C) ±1.711
D) ±2.797
E) None of these statements are correct.
The researcher is interested in determining whether there is evidence that the two processes yield different average errors. What is the critical t value at the 1% level of significance?A) +2.779
B) -2.492
C) ±1.711
D) ±2.797
E) None of these statements are correct.
Question
Question
Question
Question
A national manufacturer of ball bearings is experimenting with two different processes for producing precision ball bearings. It is important that the diameters be as close as possible to an industry standard. The output from each process is sampled and the average error from the industry standard is calculated. The results are presented below. 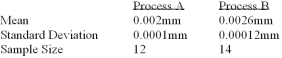 The researcher is interested in determining whether there is evidence that the two processes yield different average errors.
There are how many degrees of freedom?
A) 10
B) 13
C) 26
D) 24
E) None of these statements are correct.
The researcher is interested in determining whether there is evidence that the two processes yield different average errors.There are how many degrees of freedom?
A) 10
B) 13
C) 26
D) 24
E) None of these statements are correct.
Question
Question
A national manufacturer of ball bearings is experimenting with two different processes for producing precision ball bearings. It is important that the diameters be as close as possible to an industry standard. The output from each process is sampled and the average error from the industry standard is calculated. The results are presented below. 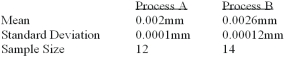 The researcher is interested in determining whether there is evidence that the two processes yield different average errors.
What is the computed value of t?
A) +2.797
B) -2.797
C) -13.70
D) +13.70
E) None of these statements are correct.
The researcher is interested in determining whether there is evidence that the two processes yield different average errors.What is the computed value of t?
A) +2.797
B) -2.797
C) -13.70
D) +13.70
E) None of these statements are correct.
Question
Question
A national manufacturer of ball bearings is experimenting with two different processes for producing precision ball bearings. It is important that the diameters be as close as possible to an industry standard. The output from each process is sampled and the average error from the industry standard is calculated. The results are presented below. 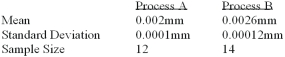 The researcher is interested in determining whether there is evidence that the two processes yield different average errors. What is the alternate hypothesis?
A) µA - µB = 0
B) µA - µB ≠ 0
C) µA - µB ≤ 0
D) µA - µB > 0
E) None of these statements are correct
The researcher is interested in determining whether there is evidence that the two processes yield different average errors. What is the alternate hypothesis?A) µA - µB = 0
B) µA - µB ≠ 0
C) µA - µB ≤ 0
D) µA - µB > 0
E) None of these statements are correct
Question
Question
Question
Question
Question
Question
A national manufacturer of ball bearings is experimenting with two different processes for producing precision ball bearings. It is important that the diameters be as close as possible to an industry standard. The output from each process is sampled and the average error from the industry standard is calculated. The results are presented below. 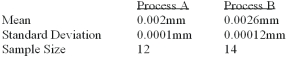 The researcher is interested in determining whether there is evidence that the two processes yield different average errors.
What is the decision at the 1% level of significance?
A) Reject the null hypothesis and conclude the means are different.
B) Reject the null hypothesis and conclude the means are the same.
C) Fail to reject the null hypothesis and conclude the means are the same.
D) Fail to reject the null hypothesis and conclude the means are different.
E) None of these statements are correct.
The researcher is interested in determining whether there is evidence that the two processes yield different average errors.What is the decision at the 1% level of significance?
A) Reject the null hypothesis and conclude the means are different.
B) Reject the null hypothesis and conclude the means are the same.
C) Fail to reject the null hypothesis and conclude the means are the same.
D) Fail to reject the null hypothesis and conclude the means are different.
E) None of these statements are correct.
Question
To compare the effect of weather on sales of soft drinks, a soda manufacturer sampled two regions of the country with the following results. Is there a difference in sales between the 2 regions? 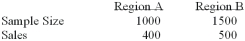 i. The null hypothesis is pa - pb = 0 ii. The alternate hypothesis is pa - pb > 0
Iii) The z-statistic is 3.57.
A) (i), (ii) and (iii) are all correct statements
B) (i) and (ii) are correct statements, but not (iii).
C) (i) and (iii) are correct statements but not (ii).
D) (ii) and (iii) are correct statements but not (i).
E) (ii) is a correct statement, but not (i) and (iii).
i. The null hypothesis is pa - pb = 0 ii. The alternate hypothesis is pa - pb > 0Iii) The z-statistic is 3.57.
A) (i), (ii) and (iii) are all correct statements
B) (i) and (ii) are correct statements, but not (iii).
C) (i) and (iii) are correct statements but not (ii).
D) (ii) and (iii) are correct statements but not (i).
E) (ii) is a correct statement, but not (i) and (iii).
Question
To compare the effect of weather on sales of soft drinks, a soda manufacturer sampled two regions of the country with the following results. Is there a difference in sales between the 2 regions? 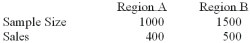 i. The null hypothesis is pa - pb > 0
Ii) The alternate hypothesis is pa - pb ≠ 0
Iii) The pooled estimate of the population proportion is 0.36.
A) (i), (ii) and (iii) are all correct statements
B) (i) and (ii) are correct statements, but not (iii).
C) (i) and (iii) are correct statements but not (ii).
D) (ii) and (iii) are correct statements but not (i).
E) (ii) is a correct statement, but not (i) and (iii).
i. The null hypothesis is pa - pb > 0Ii) The alternate hypothesis is pa - pb ≠ 0
Iii) The pooled estimate of the population proportion is 0.36.
A) (i), (ii) and (iii) are all correct statements
B) (i) and (ii) are correct statements, but not (iii).
C) (i) and (iii) are correct statements but not (ii).
D) (ii) and (iii) are correct statements but not (i).
E) (ii) is a correct statement, but not (i) and (iii).
Question
Question
To compare the effect of weather on sales of soft drinks, a soda manufacturer sampled two regions of the country with the following results. Is there a difference in sales between the 2 regions? 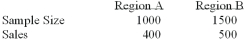 i. The alternate hypothesis is pa - pb ≠ 0 ii. The pooled estimate of the population proportion is 0.36.
Iii) Using the 1% level of significance, the critical value is ±1.96.
A) (i), (ii) and (iii) are all correct statements
B) (i) and (ii) are correct statements, but not (iii).
C) (i) and (iii) are correct statements but not (ii).
D) (ii) and (iii) are correct statements but not (i).
E) (ii) is a correct statement, but not (i) and (iii).
i. The alternate hypothesis is pa - pb ≠ 0 ii. The pooled estimate of the population proportion is 0.36.Iii) Using the 1% level of significance, the critical value is ±1.96.
A) (i), (ii) and (iii) are all correct statements
B) (i) and (ii) are correct statements, but not (iii).
C) (i) and (iii) are correct statements but not (ii).
D) (ii) and (iii) are correct statements but not (i).
E) (ii) is a correct statement, but not (i) and (iii).
Question
The results of a mathematics placement exam at Mercy College for two campuses are as follows:  What is the null hypothesis if we want to test the hypothesis that the mean score on Campus 1 is higher than on Campus 2?
A) µ1 = 0
B) µ2 = 0
C) µ1 = µ2
D) µ1 > µ2
E) None of these statements are correct
What is the null hypothesis if we want to test the hypothesis that the mean score on Campus 1 is higher than on Campus 2?A) µ1 = 0
B) µ2 = 0
C) µ1 = µ2
D) µ1 > µ2
E) None of these statements are correct
Question
To compare the effect of weather on sales of soft drinks, a soda manufacturer sampled two regions of the country with the following results. Is there a difference in sales between the 2 regions? 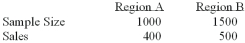 i. The null hypothesis is pa - pb = 0
Ii) The alternate hypothesis is pa - pb ≠ 0
Iii) The proportion of sales made in Market Area 1 is 0.45.
A) (i), (ii) and (iii) are all correct statements
B) (i) and (ii) are correct statements, but not (iii).
C) (i) and (iii) are correct statements but not (ii).
D) (ii) and (iii) are correct statements but not (i).
E) (ii) is a correct statement, but not (i) and (iii).
i. The null hypothesis is pa - pb = 0Ii) The alternate hypothesis is pa - pb ≠ 0
Iii) The proportion of sales made in Market Area 1 is 0.45.
A) (i), (ii) and (iii) are all correct statements
B) (i) and (ii) are correct statements, but not (iii).
C) (i) and (iii) are correct statements but not (ii).
D) (ii) and (iii) are correct statements but not (i).
E) (ii) is a correct statement, but not (i) and (iii).
Question
To compare the effect of weather on sales of soft drinks, a soda manufacturer sampled two regions of the country with the following results. Is there a difference in sales between the 2 regions? 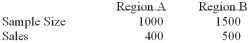 i. The null hypothesis is pa - pb = 0 ii. The alternate hypothesis is pa - pb ≠ 0
Iii) The proportion of sales made in Market Area 2 is 0.33.
A) (i), (ii) and (iii) are all correct statements
B) (i) and (ii) are correct statements, but not (iii).
C) (i) and (iii) are correct statements but not (ii).
D) (ii) and (iii) are correct statements but not (i).
E) (ii) is a correct statement, but not (i) and (iii).
i. The null hypothesis is pa - pb = 0 ii. The alternate hypothesis is pa - pb ≠ 0Iii) The proportion of sales made in Market Area 2 is 0.33.
A) (i), (ii) and (iii) are all correct statements
B) (i) and (ii) are correct statements, but not (iii).
C) (i) and (iii) are correct statements but not (ii).
D) (ii) and (iii) are correct statements but not (i).
E) (ii) is a correct statement, but not (i) and (iii).
Question
Question
To compare the effect of weather on sales of soft drinks, a soda manufacturer sampled two regions of the country with the following results. Is there a difference in sales between the 2 regions? 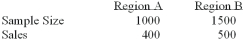 i. The null hypothesis is pa - pb = 0
Ii) The alternate hypothesis is pa - pb ≠ 0
Iii) If α = 0.01 and the z-statistic were calculated to be -1.96, your decision would be to fail to reject
A) (i), (ii) and (iii) are all correct statements
B) (i) and (ii) are correct statements, but not (iii).
C) (i) and (iii) are correct statements but not (ii).
D) (ii) and (iii) are correct statements but not (i).
E) (ii) is a correct statement, but not (i) and (iii).
i. The null hypothesis is pa - pb = 0Ii) The alternate hypothesis is pa - pb ≠ 0
Iii) If α = 0.01 and the z-statistic were calculated to be -1.96, your decision would be to fail to reject
A) (i), (ii) and (iii) are all correct statements
B) (i) and (ii) are correct statements, but not (iii).
C) (i) and (iii) are correct statements but not (ii).
D) (ii) and (iii) are correct statements but not (i).
E) (ii) is a correct statement, but not (i) and (iii).
Question
Question
To compare the effect of weather on sales of soft drinks, a soda manufacturer sampled two regions of the country with the following results. Is there a difference in sales between the 2 regions? 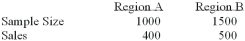 i. The null hypothesis is pa - pb = 0
Ii) The alternate hypothesis is pa - pb ≠ 0
Iii) Using the 1% level of significance, the critical value is ±2.58.
A) (i), (ii) and (iii) are all correct statements
B) (i) and (ii) are correct statements, but not (iii).
C) (i) and (iii) are correct statements but not (ii).
D) (ii) and (iii) are correct statements but not (i).
E) (ii) is a correct statement, but not (i) and (iii).
i. The null hypothesis is pa - pb = 0Ii) The alternate hypothesis is pa - pb ≠ 0
Iii) Using the 1% level of significance, the critical value is ±2.58.
A) (i), (ii) and (iii) are all correct statements
B) (i) and (ii) are correct statements, but not (iii).
C) (i) and (iii) are correct statements but not (ii).
D) (ii) and (iii) are correct statements but not (i).
E) (ii) is a correct statement, but not (i) and (iii).
Question
A national manufacturer of ball bearings is experimenting with two different processes for producing precision ball bearings. It is important that the diameters be as close as possible to an industry standard. The output from each process is sampled and the average error from the industry standard is calculated. The results are presented below. 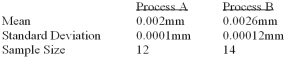 The researcher is interested in determining whether there is evidence that the two processes yield different average errors.
This example is what type of test?
A) One sample test of means.
B) Two sample test of means.
C) Paired t-test.
D) Test of proportions.
E) None of these statements is correct
The researcher is interested in determining whether there is evidence that the two processes yield different average errors.This example is what type of test?
A) One sample test of means.
B) Two sample test of means.
C) Paired t-test.
D) Test of proportions.
E) None of these statements is correct
Question
Question
Question
A national manufacturer of ball bearings is experimenting with two different processes for producing precision ball bearings. It is important that the diameters be as close as possible to an industry standard. The output from each process is sampled and the average error from the industry standard is calculated. The results are presented below. 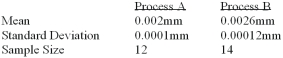 The researcher is interested in determining whether there is evidence that the two processes yield different average errors. Assume calculated t to be +2.70; at the 0.01 level of significance what would be the decision?
A) Reject the null hypothesis and conclude the means are different.
B) Reject the null hypothesis and conclude the means are the same.
C) Fail to reject the null hypothesis and conclude the means are the same.
D) Fail to reject the null hypothesis and conclude the means are different.
E) None of these statements are correct.
The researcher is interested in determining whether there is evidence that the two processes yield different average errors. Assume calculated t to be +2.70; at the 0.01 level of significance what would be the decision?A) Reject the null hypothesis and conclude the means are different.
B) Reject the null hypothesis and conclude the means are the same.
C) Fail to reject the null hypothesis and conclude the means are the same.
D) Fail to reject the null hypothesis and conclude the means are different.
E) None of these statements are correct.
Question
To compare the effect of weather on sales of soft drinks, a soda manufacturer sampled two regions of the country with the following results. Is there a difference in sales between the 2 regions? 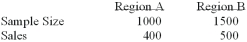 i. The alternate hypothesis is pa - pb ≠ 0
Ii) The proportion of sales made in Market Area 1 is 0.40.
Iii) The proportion of sales made in Market Area 2 is 0.33.
A) (i), (ii) and (iii) are all correct statements
B) (i) and (ii) are correct statements, but not (iii).
C) (i) and (iii) are correct statements but not (ii).
D) (ii) and (iii) are correct statements but not (i).
E) (ii) is a correct statement, but not (i) and (iii).
i. The alternate hypothesis is pa - pb ≠ 0Ii) The proportion of sales made in Market Area 1 is 0.40.
Iii) The proportion of sales made in Market Area 2 is 0.33.
A) (i), (ii) and (iii) are all correct statements
B) (i) and (ii) are correct statements, but not (iii).
C) (i) and (iii) are correct statements but not (ii).
D) (ii) and (iii) are correct statements but not (i).
E) (ii) is a correct statement, but not (i) and (iii).
Question
The results of a mathematics placement exam at Mercy College for two campuses are as follows: 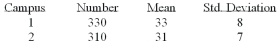 What is the p-value if the computed test statistic is 4.1?
A) 1.0
B) 0.0
C) 0.05
D) 0.95
E) None of these statements are correct
What is the p-value if the computed test statistic is 4.1?A) 1.0
B) 0.0
C) 0.05
D) 0.95
E) None of these statements are correct
Question
Question
The results of a mathematics placement exam at Mercy College for two campuses are as follows: 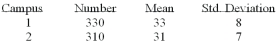 What is the computed value of the test statistic?
A) 9.3
B) 2.6
C) 3.4
D) 1.9
E) None of these statements are correct
What is the computed value of the test statistic?A) 9.3
B) 2.6
C) 3.4
D) 1.9
E) None of these statements are correct
Question
To compare the effect of weather on sales of soft drinks, a soda manufacturer sampled two regions of the country with the following results. Is there a difference in sales between the 2 regions? 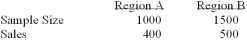 i. The alternate hypothesis is pa - pb ¹ 0 ii. The z-statistic is 3.57.
iii. Your decision is to accept the null hypothesis.
A) (i), (ii) and (iii) are all correct statements
B) (i) and (ii) are correct statements, but not (iii).
C) (i) and (iii) are correct statements but not (ii).
D) (ii) and (iii) are correct statements but not (i).
E) (ii) is a correct statement, but not (i) and (iii).
i. The alternate hypothesis is pa - pb ¹ 0 ii. The z-statistic is 3.57. iii. Your decision is to accept the null hypothesis.
A) (i), (ii) and (iii) are all correct statements
B) (i) and (ii) are correct statements, but not (iii).
C) (i) and (iii) are correct statements but not (ii).
D) (ii) and (iii) are correct statements but not (i).
E) (ii) is a correct statement, but not (i) and (iii).
Question
Question
Question
Question
Question
Question
To compare the effect of weather on sales of soft drinks, a soda manufacturer sampled two regions of the country with the following results. Is there a difference in sales between the 2 regions? 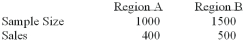 i. The alternate hypothesis is pa - pb ≠ 0
Ii) Using the 1% level of significance, the critical value is ±2.58.
Iii) The z-statistic is 3.57.
A) (i), (ii) and (iii) are all correct statements
B) (i) and (ii) are correct statements, but not (iii).
C) (i) and (iii) are correct statements but not (ii).
D) (ii) and (iii) are correct statements but not (i).
E) (ii) is a correct statement, but not (i) and (iii).
i. The alternate hypothesis is pa - pb ≠ 0Ii) Using the 1% level of significance, the critical value is ±2.58.
Iii) The z-statistic is 3.57.
A) (i), (ii) and (iii) are all correct statements
B) (i) and (ii) are correct statements, but not (iii).
C) (i) and (iii) are correct statements but not (ii).
D) (ii) and (iii) are correct statements but not (i).
E) (ii) is a correct statement, but not (i) and (iii).
Question
Question
To compare the effect of weather on sales of soft drinks, a soda manufacturer sampled two regions of the country with the following results. Is there a difference in sales between the 2 regions? 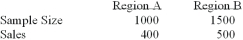 i. Using the 1% level of significance, the critical value is ±2.58.
ii. The z-statistic is 3.57.
Iii) Your decision is to reject the null hypothesis
A) (i), (ii) and (iii) are all correct statements
B) (i) and (ii) are correct statements, but not (iii).
C) (i) and (iii) are correct statements but not (ii).
D) (ii) and (iii) are correct statements but not (i).
E) (ii) is a correct statement, but not (i) and (iii).
i. Using the 1% level of significance, the critical value is ±2.58. ii. The z-statistic is 3.57.
Iii) Your decision is to reject the null hypothesis
A) (i), (ii) and (iii) are all correct statements
B) (i) and (ii) are correct statements, but not (iii).
C) (i) and (iii) are correct statements but not (ii).
D) (ii) and (iii) are correct statements but not (i).
E) (ii) is a correct statement, but not (i) and (iii).
Question
Question
Question
Question
Question
Question
Question
Question
Question
Question
Question
Question
Accounting procedures allow a business to evaluate their inventory at LIFO (Last In First Out) or FIFO (First In First Out). A manufacturer evaluated its finished goods inventory (in $000) for five products both ways. Based on the following results, is LIFO more effective in keeping the value of his inventory lower? 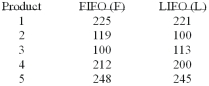 What is the degree of freedom?
A) 4
B) 5
C) 15
D) 10
E) 9
What is the degree of freedom?A) 4
B) 5
C) 15
D) 10
E) 9
Question
A local retail business wishes to determine if there is a difference in preferred indoor temperature between men and women. A random sample of data is collected, with the following results (note: there are slight differences between Excel and MegaStat output in this test): 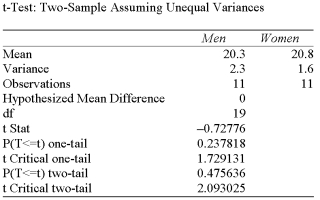 Using a 0.05 level of significance, can we conclude that there is indeed a difference in the temperature that men prefer compared to women? What is the null hypothesis if we assume men to be group 1 and women group 2?
A) µ1 = µ2, or µd = 0
B) µ1 ≠ µ2, or µd ≠ 0
C) µ1 - µ2 ≤ 20
D) µ1 - µ2 > 20
E) None of these statements are correct
Using a 0.05 level of significance, can we conclude that there is indeed a difference in the temperature that men prefer compared to women? What is the null hypothesis if we assume men to be group 1 and women group 2?A) µ1 = µ2, or µd = 0
B) µ1 ≠ µ2, or µd ≠ 0
C) µ1 - µ2 ≤ 20
D) µ1 - µ2 > 20
E) None of these statements are correct
Question
Accounting procedures allow a business to evaluate their inventory at LIFO (Last In First Out) or FIFO (First In First Out). A manufacturer evaluated its finished goods inventory (in $000) for five products both ways. Based on the following results, is LIFO more effective in keeping the value of his inventory lower? 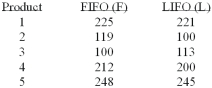 What is the decision at the 5% level of significance?
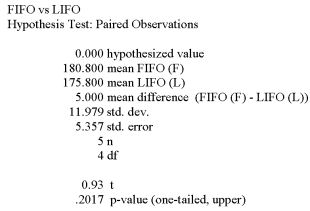
A) Looking at the large P-value of .2019 we conclude LIFO is more effective.
B) Reject the null hypothesis and conclude LIFO is more effective.
C) Reject the alternate hypothesis and conclude LIFO is more effective. DThe large P-value of .2017 indicates that there is a good chance of getting this sample data when the
) two methods are in fact not significantly different, so we conclude that LIFO is not more effective.
E) None of these statements are correct.
What is the decision at the 5% level of significance? A) Looking at the large P-value of .2019 we conclude LIFO is more effective.
B) Reject the null hypothesis and conclude LIFO is more effective.
C) Reject the alternate hypothesis and conclude LIFO is more effective. DThe large P-value of .2017 indicates that there is a good chance of getting this sample data when the
) two methods are in fact not significantly different, so we conclude that LIFO is not more effective.
E) None of these statements are correct.
Question
Accounting procedures allow a business to evaluate their inventory at LIFO (Last In First Out) or FIFO (First In First Out). A manufacturer evaluated its finished goods inventory (in $000) for five products both ways. Based on the following results, is LIFO more effective in keeping the value of his inventory lower?  This example is what type of test?
A) One sample test of means.
B) Two sample test of means.
C) Paired t-test.
D) Test of proportions.
E) None of these statements are correct
This example is what type of test?A) One sample test of means.
B) Two sample test of means.
C) Paired t-test.
D) Test of proportions.
E) None of these statements are correct
Question
The employees at the East Vancouver office of a multinational company are demanding higher salaries than those offered at the company office located in Oshawa Ontario. Their justification for the pay difference is that the difference between the average price of single-family houses in East Vancouver and that in Oshawa is more than $60,000. Before making a decision, the company management wants to study the difference in the prices of single-family houses for sale at the two locations.
The results of their search of recent house sales are as follows (in $000, rounded to the nearest
Thousand): Assuming that the population distributions are approximately normal, can we conclude at the 0.05 significance level that the difference between the two population means is greater than $60,000?
If we let East Vancouver be population 1 and Oshawa be population 2, what is the null hypothesis?
A) µ1 = µ2, or µd = 0
B) µ1 ≠ µ2, or µd ≠ 0
C) µ1 - µ2 ≤ 60
D) µ1 - µ2 > 60
E) None of these statements are correct
The results of their search of recent house sales are as follows (in $000, rounded to the nearest
Thousand):
Assuming that the population distributions are approximately normal, can we conclude at the 0.05 significance level that the difference between the two population means is greater than $60,000?If we let East Vancouver be population 1 and Oshawa be population 2, what is the null hypothesis?
A) µ1 = µ2, or µd = 0
B) µ1 ≠ µ2, or µd ≠ 0
C) µ1 - µ2 ≤ 60
D) µ1 - µ2 > 60
E) None of these statements are correct
Question
The employees at the East Vancouver office of a multinational company are demanding higher salaries than those offered at the company office located in Oshawa Ontario. Their justification for the pay difference is that the difference between the average price of single-family houses in East Vancouver and that in Oshawa is more than $60,000. Before making a decision, the company management wants to study the difference in the prices of single-family houses for sale at the two locations.
The results of their search of recent house sales are as follows (in $000, rounded to the nearest thousand): Assuming that the population distributions are approximately normal, can we conclude at the 0.05 significance level that the difference between the two population means is greater than $60,000? This example is what type of test?
A) One sample test of means.
B) Two sample test of means.
C) Paired t-test.
D) Test of proportions.
E) None of these statements are correct
The results of their search of recent house sales are as follows (in $000, rounded to the nearest thousand):
Assuming that the population distributions are approximately normal, can we conclude at the 0.05 significance level that the difference between the two population means is greater than $60,000? This example is what type of test?A) One sample test of means.
B) Two sample test of means.
C) Paired t-test.
D) Test of proportions.
E) None of these statements are correct
Question
The employees at the East Vancouver office of a multinational company are demanding higher salaries than those offered at the company office located in Oshawa Ontario. Their justification for the pay difference is that the difference between the average price of single-family houses in East Vancouver and that in Oshawa is more than $60,000. Before making a decision, the company management wants to study the difference in the prices of single-family houses for sale at the two locations.
The results of their search of recent house sales are as follows (in $000, rounded to the nearest thousand): Assuming that the population distributions are approximately normal, can we conclude at the 0.05 significance level that the difference between the two population means is greater than $60,000? What is the value of calculated t?
A) +1.93
B) +2.76
C) -2.76
D) -2.028
E) None of these statements are correct.
The results of their search of recent house sales are as follows (in $000, rounded to the nearest thousand):
Assuming that the population distributions are approximately normal, can we conclude at the 0.05 significance level that the difference between the two population means is greater than $60,000? What is the value of calculated t?A) +1.93
B) +2.76
C) -2.76
D) -2.028
E) None of these statements are correct.
Question
The employees at the East Vancouver office of a multinational company are demanding higher salaries than those offered at the company office located in Oshawa Ontario. Their justification for the pay difference is that the difference between the average price of single-family houses in East Vancouver and that in Oshawa is more than $60,000. Before making a decision, the company management wants to study the difference in the prices of single-family houses for sale at the two locations. The results of their search of recent house sales are as follows (in $000, rounded to the nearest thousand):  Assuming that the population distributions are approximately normal, can we conclude at the 0.05 significance level that the difference between the two population means is greater than $60,000? What is the alternate hypothesis?
A) µ1 = µ2, or µd = 0
B) µ1 ≠ µ2, or µd ≠ 0
C) µ1 - µ2 ≤ 60
D) µ1 - µ2 > 60
E) None of these statements are correct
Assuming that the population distributions are approximately normal, can we conclude at the 0.05 significance level that the difference between the two population means is greater than $60,000? What is the alternate hypothesis?A) µ1 = µ2, or µd = 0
B) µ1 ≠ µ2, or µd ≠ 0
C) µ1 - µ2 ≤ 60
D) µ1 - µ2 > 60
E) None of these statements are correct
Question
The employees at the East Vancouver office of a multinational company are demanding higher salaries than those offered at the company office located in Oshawa Ontario. Their justification for the pay difference is that the difference between the average price of single-family houses in East Vancouver and that in Oshawa is more than $60,000. Before making a decision, the company management wants to study the difference in the prices of single-family houses for sale at the two locations.
The results of their search of recent house sales are as follows (in $000, rounded to the nearest thousand): Assuming that the population distributions are approximately normal, can we conclude at the 0.05 significance level that the difference between the two population means is greater than $60,000? What is the degree of freedom?
A) 4
B) 5
C) 15
D) 10
E) 9
The results of their search of recent house sales are as follows (in $000, rounded to the nearest thousand):
Assuming that the population distributions are approximately normal, can we conclude at the 0.05 significance level that the difference between the two population means is greater than $60,000? What is the degree of freedom?A) 4
B) 5
C) 15
D) 10
E) 9
Question
Question
The results of a mathematics placement exam at Mercy College for two campuses is as follows: 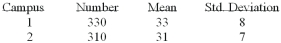 We want to test the hypothesis that the mean score on Campus 1 is higher than on Campus 2.
 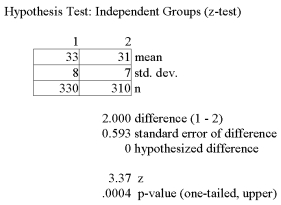 Using the printout above, what decision(s) can be made?
A) Looking at the P-value we conclude that there is no significant difference in the results from each campus
B) At a 5% level of significance we conclude that there is no significant difference in the results from each campus
C) At a 1% level of significance we conclude that campus 1 results are higher than campus 2 results
D) A & B are true
E) B & C are true
We want to test the hypothesis that the mean score on Campus 1 is higher than on Campus 2. Using the printout above, what decision(s) can be made?A) Looking at the P-value we conclude that there is no significant difference in the results from each campus
B) At a 5% level of significance we conclude that there is no significant difference in the results from each campus
C) At a 1% level of significance we conclude that campus 1 results are higher than campus 2 results
D) A & B are true
E) B & C are true
Question
Accounting procedures allow a business to evaluate their inventory at LIFO (Last In First Out) or FIFO (First In First Out). A manufacturer evaluated its finished goods inventory (in $000) for five products both ways. Based on the following results, is LIFO more effective in keeping the value of his inventory lower? 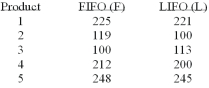 What is the value of calculated t?
A) +0.93
B) ±2.776
C) +0.0.47
D) -2.028
E) None of these statements are correct.
What is the value of calculated t?A) +0.93
B) ±2.776
C) +0.0.47
D) -2.028
E) None of these statements are correct.
Question
Question
Accounting procedures allow a business to evaluate their inventory at LIFO (Last In First Out) or FIFO (First In First Out). A manufacturer evaluated its finished goods inventory (in $000) for five products both ways. Based on the following results, is LIFO more effective in keeping the value of his inventory lower? 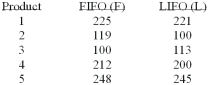 What is the alternate hypothesis?
A) µF = µL, or µd = 0
B) µF ≠ µL, or µd ≠ 0
C) µF ≤ µL
D) µF > µL
E) None of these statements are correct
What is the alternate hypothesis?A) µF = µL, or µd = 0
B) µF ≠ µL, or µd ≠ 0
C) µF ≤ µL
D) µF > µL
E) None of these statements are correct
Question
Question
Accounting procedures allow a business to evaluate their inventory at LIFO (Last In First Out) or FIFO (First In First Out). A manufacturer evaluated its finished goods inventory (in $000) for five products both ways. Based on the following results, is LIFO more effective in keeping the value of his inventory lower? 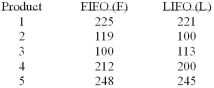 What is the null hypothesis?
A) µF = µL, or µd = 0
B) µF ≠ µL, or µd ≠ 0
C) µF ≤ µL
D) µF > µL
E) None of these statements are correct
What is the null hypothesis?A) µF = µL, or µd = 0
B) µF ≠ µL, or µd ≠ 0
C) µF ≤ µL
D) µF > µL
E) None of these statements are correct
Question
Accounting procedures allow a business to evaluate their inventory at LIFO (Last In First Out) or FIFO (First In First Out). A manufacturer evaluated its finished goods inventory (in $000) for five products both ways. Based on the following results, is LIFO more effective in keeping the value of his inventory lower? 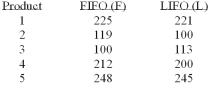 If you use the 5% level of significance, what is the critical t value?
A) +2.571
B) ±2.776
C) +2.262
D) ±2.228
E) None of these statements are correct.
If you use the 5% level of significance, what is the critical t value?A) +2.571
B) ±2.776
C) +2.262
D) ±2.228
E) None of these statements are correct.
Question
Accounting procedures allow a business to evaluate their inventory at LIFO (Last In First Out) or FIFO (First In First Out). A manufacturer evaluated its finished goods inventory (in $000) for five products both ways. Based on the following results, is LIFO more effective in keeping the value of his inventory lower? 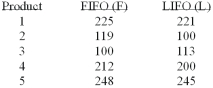 What is the decision at the 5% level of significance?
A) Fail to reject the null hypothesis and conclude LIFO is more effective.
B) Reject the null hypothesis and conclude LIFO is more effective.
C) Reject the alternate hypothesis and conclude LIFO is more effective.
D) Fail to reject the null hypothesis and conclude LIFO is not more effective.
E) None of these statements are correct.
What is the decision at the 5% level of significance?A) Fail to reject the null hypothesis and conclude LIFO is more effective.
B) Reject the null hypothesis and conclude LIFO is more effective.
C) Reject the alternate hypothesis and conclude LIFO is more effective.
D) Fail to reject the null hypothesis and conclude LIFO is not more effective.
E) None of these statements are correct.
Question
A local retail business wishes to determine if there is a difference in preferred indoor temperature between men and women. A random sample of data is collected, with the following results: 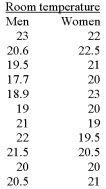 If you were to use Excel's Data Analysis to assist in your solution to this problem, which test would you use?
A) T-Test: paired 2-sample for means
B) T-test: 2-sample assuming equal variances
C) T-test: 2-sample assuming unequal variances
D) Z-test: 2-sample for mean
E) F-test: 2-sample for variances
If you were to use Excel's Data Analysis to assist in your solution to this problem, which test would you use?A) T-Test: paired 2-sample for means
B) T-test: 2-sample assuming equal variances
C) T-test: 2-sample assuming unequal variances
D) Z-test: 2-sample for mean
E) F-test: 2-sample for variances
Question
The employees at the East Vancouver office of a multinational company are demanding higher salaries than those offered at the company office located in Oshawa Ontario. Their justification for the pay difference is that the difference between the average price of single-family houses in East Vancouver and that in Oshawa is more than $60,000. Before making a decision, the company management wants to study the difference in the prices of single-family houses for sale at the two locations. The results of their search of recent house sales are as follows (in $000, rounded to the nearest thousand):  Assuming that the population distributions are approximately normal, can we conclude at the 0.05 significance level that the difference between the two population means is greater than $60,000?
If you use the 5% level of significance, what is the critical t value?
A) 2.228
B) 1.812
C) 1.833
D) ±2.262
E) None of these statements are correct.
Assuming that the population distributions are approximately normal, can we conclude at the 0.05 significance level that the difference between the two population means is greater than $60,000?If you use the 5% level of significance, what is the critical t value?
A) 2.228
B) 1.812
C) 1.833
D) ±2.262
E) None of these statements are correct.

Unlock Deck
Sign up to unlock the cards in this deck!
Unlock Deck
Unlock Deck
1/87
Play
Full screen (f)
Deck 10: Two-Sample Tests of Hypothesis
1
If two samples are used in a hypothesis test for which the combined degrees of freedom is 27, which one of the following might be true about the two sample sizes?
A) Sample A = 14; sample B = 13
B) Sample A = 12; sample B = 13
C) Sample A = 15; sample B = 14
D) Sample A = 20; sample B = 9
E) Cannot determine from the above information
A) Sample A = 14; sample B = 13
B) Sample A = 12; sample B = 13
C) Sample A = 15; sample B = 14
D) Sample A = 20; sample B = 9
E) Cannot determine from the above information
C
2
A national manufacturer of ball bearings is experimenting with two different processes for producing precision ball bearings. It is important that the diameters be as close as possible to an industry standard. The output from each process is sampled and the average error from the industry standard is calculated. The results are presented below. The researcher is interested in determining whether there is evidence that the two processes yield different average errors. Ball Bearings
Hypothesis Test: Independent Groups (t-test, pooled variance) What is the decision at the 1% level of significance?
A) Reject the null hypothesis and conclude the means are different.
B) Reject the null hypothesis and conclude the means are the same.
C) Fail to reject the null hypothesis and conclude the means are the same.
D) Fail to reject the null hypothesis and conclude the means are different.
E) None of these statements are correct.
The researcher is interested in determining whether there is evidence that the two processes yield different average errors. Ball BearingsHypothesis Test: Independent Groups (t-test, pooled variance)
What is the decision at the 1% level of significance?A) Reject the null hypothesis and conclude the means are different.
B) Reject the null hypothesis and conclude the means are the same.
C) Fail to reject the null hypothesis and conclude the means are the same.
D) Fail to reject the null hypothesis and conclude the means are different.
E) None of these statements are correct.
A
3
A national manufacturer of ball bearings is experimenting with two different processes for producing precision ball bearings. It is important that the diameters be as close as possible to an industry standard. The output from each process is sampled and the average error from the industry standard is calculated. The results are presented below. The researcher is interested in determining whether there is evidence that the two processes yield different average errors. Given the following megastat printout, what analysis and decision can be made?
A) Reject the null hypothesis and conclude the means are different.
B) Reject the null hypothesis and conclude the means are the same.
C) Fail to reject the null hypothesis at the 1% level of significance.
D) Fail to reject the null hypothesis at the 5% level of significance and conclude the means are different.
E) None of these statements are correct.
The researcher is interested in determining whether there is evidence that the two processes yield different average errors. Given the following megastat printout, what analysis and decision can be made? A) Reject the null hypothesis and conclude the means are different.
B) Reject the null hypothesis and conclude the means are the same.
C) Fail to reject the null hypothesis at the 1% level of significance.
D) Fail to reject the null hypothesis at the 5% level of significance and conclude the means are different.
E) None of these statements are correct.
A
4
i. If the null hypothesis states that there is no difference between the mean income of males and the mean income of females, then the test is one-tailed.
Ii) If we are testing for the difference between two population means, it is assumed that the sample observations from one population are independent of the sample observations from the other population.
Iii) When sample sizes are less than 30, a test for the differences between two population means has n
- 1 degrees of freedom.
A) (i), (ii) and (iii) are all correct statements
B) (i) and (ii) are correct statements, but not (iii).
C) (i) and (iii) are correct statements but not (ii).
D) (ii) and (iii) are correct statements but not (i).
E) (ii) is a correct statement, but not (i) and (iii).
Unlock Deck
Unlock for access to all 87 flashcards in this deck.
Unlock Deck
k this deck
5
The net weights of a sample of bottles filled by a machine manufactured by Edne, and the net weights of a sample filled by a similar machine manufactured by Orno, Inc., are (in grams):
Testing the claim at the 0.05 level the mean weight of the bottles filled by the Orno machine is greater than the mean weight of the bottles filled by the Edne machine, what is the critical value?
A) -1.96
B) -2.837
C) -6.271
D) +3.674
E) None of these statements is correct
Testing the claim at the 0.05 level the mean weight of the bottles filled by the Orno machine is greater than the mean weight of the bottles filled by the Edne machine, what is the critical value?
A) -1.96
B) -2.837
C) -6.271
D) +3.674
E) None of these statements is correct
Unlock Deck
Unlock for access to all 87 flashcards in this deck.
Unlock Deck
k this deck
6
A national manufacturer of ball bearings is experimenting with two different processes for producing precision ball bearings. It is important that the diameters be as close as possible to an industry standard. The output from each process is sampled and the average error from the industry standard is calculated. The results are presented below. The researcher is interested in determining whether there is evidence that the two processes yield different average errors.
What is the null hypothesis?
A) µA - µB = 0
B) µA - µB ≠ 0
C) µA - µB ≤ 0
D) µA - µB > 0
E) None of these statements are correct
The researcher is interested in determining whether there is evidence that the two processes yield different average errors.What is the null hypothesis?
A) µA - µB = 0
B) µA - µB ≠ 0
C) µA - µB ≤ 0
D) µA - µB > 0
E) None of these statements are correct
Unlock Deck
Unlock for access to all 87 flashcards in this deck.
Unlock Deck
k this deck
7
A national manufacturer of ball bearings is experimenting with two different processes for producing precision ball bearings. It is important that the diameters be as close as possible to an industry standard. The output from each process is sampled and the average error from the industry standard is calculated. The results are presented below. The researcher is interested in determining whether there is evidence that the two processes yield different average errors. What is the critical t value at the 1% level of significance?
A) +2.779
B) -2.492
C) ±1.711
D) ±2.797
E) None of these statements are correct.
The researcher is interested in determining whether there is evidence that the two processes yield different average errors. What is the critical t value at the 1% level of significance?A) +2.779
B) -2.492
C) ±1.711
D) ±2.797
E) None of these statements are correct.
Unlock Deck
Unlock for access to all 87 flashcards in this deck.
Unlock Deck
k this deck
8
i. If we are testing for the difference between two population means, it is assumed that the sample observations from one population are independent of the sample observations from the other population.
Ii) If we are testing for the difference between two population means, it is assumed that the two
Populations are approximately normal and have equal variances.
Iii) When sample sizes are less than 30, a test for the differences between two population means has n
- 1 degrees of freedom.
A) (i), (ii) and (iii) are all correct statements
B) (i) and (ii) are correct statements, but not (iii).
C) (i) and (iii) are correct statements but not (ii).
D) (ii) and (iii) are correct statements but not (i).
E) All statements are false
Unlock Deck
Unlock for access to all 87 flashcards in this deck.
Unlock Deck
k this deck
9
10 and sample sizes of seven and fifteen, is ±1.734.
A) (i), (ii) and (iii) are all correct statements
B) (i) and (ii) are correct statements, but not (iii).
C) (i) and (iii) are correct statements but not (ii).
D) (ii) and (iii) are correct statements but not (i).
E) All statements are false
A) (i), (ii) and (iii) are all correct statements
B) (i) and (ii) are correct statements, but not (iii).
C) (i) and (iii) are correct statements but not (ii).
D) (ii) and (iii) are correct statements but not (i).
E) All statements are false
Unlock Deck
Unlock for access to all 87 flashcards in this deck.
Unlock Deck
k this deck
10
Administering the same test to a group of 15 students and a second group of 15 students to see which group scores higher is an example of:
A) a one sample test of means.
B) a two sample test of means.
C) a paired t-test.
D) a test of proportions.
E) None of these statements is correct.
A) a one sample test of means.
B) a two sample test of means.
C) a paired t-test.
D) a test of proportions.
E) None of these statements is correct.
Unlock Deck
Unlock for access to all 87 flashcards in this deck.
Unlock Deck
k this deck
11
A national manufacturer of ball bearings is experimenting with two different processes for producing precision ball bearings. It is important that the diameters be as close as possible to an industry standard. The output from each process is sampled and the average error from the industry standard is calculated. The results are presented below. The researcher is interested in determining whether there is evidence that the two processes yield different average errors.
There are how many degrees of freedom?
A) 10
B) 13
C) 26
D) 24
E) None of these statements are correct.
The researcher is interested in determining whether there is evidence that the two processes yield different average errors.There are how many degrees of freedom?
A) 10
B) 13
C) 26
D) 24
E) None of these statements are correct.
Unlock Deck
Unlock for access to all 87 flashcards in this deck.
Unlock Deck
k this deck
12
i. If the null hypothesis states that there is no difference between the mean income of males and the mean income of females, then the test is one-tailed.
ii. If we are testing for the difference between two population means, it is assumed that the sample observations from one population are independent of the sample observations from the other population.
Iii) If we are testing for the difference between two population means, it is assumed that the two
Populations are approximately normal and have equal variances.
A) (i), (ii) and (iii) are all correct statements
B) (i) and (ii) are correct statements, but not (iii).
C) (i) and (iii) are correct statements but not (ii).
D) (ii) and (iii) are correct statements but not (i).
E) All statements are false
Unlock Deck
Unlock for access to all 87 flashcards in this deck.
Unlock Deck
k this deck
13
A national manufacturer of ball bearings is experimenting with two different processes for producing precision ball bearings. It is important that the diameters be as close as possible to an industry standard. The output from each process is sampled and the average error from the industry standard is calculated. The results are presented below. The researcher is interested in determining whether there is evidence that the two processes yield different average errors.
What is the computed value of t?
A) +2.797
B) -2.797
C) -13.70
D) +13.70
E) None of these statements are correct.
The researcher is interested in determining whether there is evidence that the two processes yield different average errors.What is the computed value of t?
A) +2.797
B) -2.797
C) -13.70
D) +13.70
E) None of these statements are correct.
Unlock Deck
Unlock for access to all 87 flashcards in this deck.
Unlock Deck
k this deck
14
Using two independent samples, two population means are compared to determine if a difference exists. The number in the first sample is fifteen and the number in the second sample is twelve. How many degrees of freedom are associated with the critical value?
A) 24
B) 25
C) 26
D) 27
E) None of these statements is correct
A) 24
B) 25
C) 26
D) 27
E) None of these statements is correct
Unlock Deck
Unlock for access to all 87 flashcards in this deck.
Unlock Deck
k this deck
15
A national manufacturer of ball bearings is experimenting with two different processes for producing precision ball bearings. It is important that the diameters be as close as possible to an industry standard. The output from each process is sampled and the average error from the industry standard is calculated. The results are presented below. The researcher is interested in determining whether there is evidence that the two processes yield different average errors. What is the alternate hypothesis?
A) µA - µB = 0
B) µA - µB ≠ 0
C) µA - µB ≤ 0
D) µA - µB > 0
E) None of these statements are correct
The researcher is interested in determining whether there is evidence that the two processes yield different average errors. What is the alternate hypothesis?A) µA - µB = 0
B) µA - µB ≠ 0
C) µA - µB ≤ 0
D) µA - µB > 0
E) None of these statements are correct
Unlock Deck
Unlock for access to all 87 flashcards in this deck.
Unlock Deck
k this deck
16
If two samples are used in a hypothesis test for which the combined degrees of freedom is 24, which one of the following CANNOT be true about the two sample sizes?
A) Sample A = 11; sample B = 13
B) Sample A = 12; sample B = 14
C) Sample A = 13; sample B = 13
D) Sample A = 10; sample B = 16
E) Cannot determine from the above information
A) Sample A = 11; sample B = 13
B) Sample A = 12; sample B = 14
C) Sample A = 13; sample B = 13
D) Sample A = 10; sample B = 16
E) Cannot determine from the above information
Unlock Deck
Unlock for access to all 87 flashcards in this deck.
Unlock Deck
k this deck
17
What is the critical value for a one-tailed hypothesis test in which a null hypothesis is tested at the 5% level of significance based on two samples, both sample sizes are 13?
A) 1.708
B) 1.711
C) 2.060
D) 2.064
E) None of these statements is correct
A) 1.708
B) 1.711
C) 2.060
D) 2.064
E) None of these statements is correct
Unlock Deck
Unlock for access to all 87 flashcards in this deck.
Unlock Deck
k this deck
18
If the null hypothesis that two means are equal is true, 97% of the computed z-values will lie between what two values?
A) ±2.58
B) ±2.33
C) ±2.17
D) ±2.07
E) None of these statements are correct
A) ±2.58
B) ±2.33
C) ±2.17
D) ±2.07
E) None of these statements are correct
Unlock Deck
Unlock for access to all 87 flashcards in this deck.
Unlock Deck
k this deck
19
Which of the following conditions must be met to conduct a test for the difference in two sample means?
A) Data must be at least of interval scale
B) Populations must be normal
C) Variances in the two populations must be equal
D) All the above are correct
E) None of these statements is correct
A) Data must be at least of interval scale
B) Populations must be normal
C) Variances in the two populations must be equal
D) All the above are correct
E) None of these statements is correct
Unlock Deck
Unlock for access to all 87 flashcards in this deck.
Unlock Deck
k this deck
20
i. If the null hypothesis states that there is no difference between the mean income of males and the mean income of females, then the test is one-tailed.
Ii) If we are testing for the difference between two population means, it is assumed that the sample observations from one population are independent of the sample observations from the other population.
Iii) The critical value of t for the claim that the difference of two means is less than zero with = 0.025 and sample sizes of nine and seven, is -2.179.
A) (i), (ii) and (iii) are all correct statements
B) (i) and (ii) are correct statements, but not (iii).
C) (i) and (iii) are correct statements but not (ii).
D) (ii) and (iii) are correct statements but not (i).
E) (ii) is a correct statement, but not (i) and (iii).
Unlock Deck
Unlock for access to all 87 flashcards in this deck.
Unlock Deck
k this deck
21
A national manufacturer of ball bearings is experimenting with two different processes for producing precision ball bearings. It is important that the diameters be as close as possible to an industry standard. The output from each process is sampled and the average error from the industry standard is calculated. The results are presented below. The researcher is interested in determining whether there is evidence that the two processes yield different average errors.
What is the decision at the 1% level of significance?
A) Reject the null hypothesis and conclude the means are different.
B) Reject the null hypothesis and conclude the means are the same.
C) Fail to reject the null hypothesis and conclude the means are the same.
D) Fail to reject the null hypothesis and conclude the means are different.
E) None of these statements are correct.
The researcher is interested in determining whether there is evidence that the two processes yield different average errors.What is the decision at the 1% level of significance?
A) Reject the null hypothesis and conclude the means are different.
B) Reject the null hypothesis and conclude the means are the same.
C) Fail to reject the null hypothesis and conclude the means are the same.
D) Fail to reject the null hypothesis and conclude the means are different.
E) None of these statements are correct.
Unlock Deck
Unlock for access to all 87 flashcards in this deck.
Unlock Deck
k this deck
22
To compare the effect of weather on sales of soft drinks, a soda manufacturer sampled two regions of the country with the following results. Is there a difference in sales between the 2 regions? i. The null hypothesis is pa - pb = 0 ii. The alternate hypothesis is pa - pb > 0
Iii) The z-statistic is 3.57.
A) (i), (ii) and (iii) are all correct statements
B) (i) and (ii) are correct statements, but not (iii).
C) (i) and (iii) are correct statements but not (ii).
D) (ii) and (iii) are correct statements but not (i).
E) (ii) is a correct statement, but not (i) and (iii).
i. The null hypothesis is pa - pb = 0 ii. The alternate hypothesis is pa - pb > 0Iii) The z-statistic is 3.57.
A) (i), (ii) and (iii) are all correct statements
B) (i) and (ii) are correct statements, but not (iii).
C) (i) and (iii) are correct statements but not (ii).
D) (ii) and (iii) are correct statements but not (i).
E) (ii) is a correct statement, but not (i) and (iii).
Unlock Deck
Unlock for access to all 87 flashcards in this deck.
Unlock Deck
k this deck
23
To compare the effect of weather on sales of soft drinks, a soda manufacturer sampled two regions of the country with the following results. Is there a difference in sales between the 2 regions? i. The null hypothesis is pa - pb > 0
Ii) The alternate hypothesis is pa - pb ≠ 0
Iii) The pooled estimate of the population proportion is 0.36.
A) (i), (ii) and (iii) are all correct statements
B) (i) and (ii) are correct statements, but not (iii).
C) (i) and (iii) are correct statements but not (ii).
D) (ii) and (iii) are correct statements but not (i).
E) (ii) is a correct statement, but not (i) and (iii).
i. The null hypothesis is pa - pb > 0Ii) The alternate hypothesis is pa - pb ≠ 0
Iii) The pooled estimate of the population proportion is 0.36.
A) (i), (ii) and (iii) are all correct statements
B) (i) and (ii) are correct statements, but not (iii).
C) (i) and (iii) are correct statements but not (ii).
D) (ii) and (iii) are correct statements but not (i).
E) (ii) is a correct statement, but not (i) and (iii).
Unlock Deck
Unlock for access to all 87 flashcards in this deck.
Unlock Deck
k this deck
24
i. A committee studying employer-employee relations proposed that each employee would rate his or her immediate supervisor and in turn the supervisor would rate each employee. To find reactions regarding the proposal, 120 office personnel and 160 plant personnel were selected at random. Seventy-eight of the office personnel and 90 of the plant personnel were in favour of the proposal. Computed z = 1.48. At the 0.05 level, it was concluded that there is sufficient evidence to support the belief that the proportion of office personnel in favour of the proposal is greater than that of the plant personnel.
ii. We use the pooled estimate of the proportion in testing the difference between two population proportions.
Iii) The pooled estimate of the proportion is found by dividing the total number of samples by the total number of successes.
A) (i), (ii) and (iii) are all false statements
B) (ii) is a correct statement, but not (i) or (iii).
C) (i) and (iii) are correct statements but not (ii).
D) (ii) and (iii) are correct statements but not (i).
E) (i) is a correct statement, but not (ii) and (iii).
Unlock Deck
Unlock for access to all 87 flashcards in this deck.
Unlock Deck
k this deck
25
To compare the effect of weather on sales of soft drinks, a soda manufacturer sampled two regions of the country with the following results. Is there a difference in sales between the 2 regions? i. The alternate hypothesis is pa - pb ≠ 0 ii. The pooled estimate of the population proportion is 0.36.
Iii) Using the 1% level of significance, the critical value is ±1.96.
A) (i), (ii) and (iii) are all correct statements
B) (i) and (ii) are correct statements, but not (iii).
C) (i) and (iii) are correct statements but not (ii).
D) (ii) and (iii) are correct statements but not (i).
E) (ii) is a correct statement, but not (i) and (iii).
i. The alternate hypothesis is pa - pb ≠ 0 ii. The pooled estimate of the population proportion is 0.36.Iii) Using the 1% level of significance, the critical value is ±1.96.
A) (i), (ii) and (iii) are all correct statements
B) (i) and (ii) are correct statements, but not (iii).
C) (i) and (iii) are correct statements but not (ii).
D) (ii) and (iii) are correct statements but not (i).
E) (ii) is a correct statement, but not (i) and (iii).
Unlock Deck
Unlock for access to all 87 flashcards in this deck.
Unlock Deck
k this deck
26
The results of a mathematics placement exam at Mercy College for two campuses are as follows: What is the null hypothesis if we want to test the hypothesis that the mean score on Campus 1 is higher than on Campus 2?
A) µ1 = 0
B) µ2 = 0
C) µ1 = µ2
D) µ1 > µ2
E) None of these statements are correct
What is the null hypothesis if we want to test the hypothesis that the mean score on Campus 1 is higher than on Campus 2?A) µ1 = 0
B) µ2 = 0
C) µ1 = µ2
D) µ1 > µ2
E) None of these statements are correct
Unlock Deck
Unlock for access to all 87 flashcards in this deck.
Unlock Deck
k this deck
27
To compare the effect of weather on sales of soft drinks, a soda manufacturer sampled two regions of the country with the following results. Is there a difference in sales between the 2 regions? i. The null hypothesis is pa - pb = 0
Ii) The alternate hypothesis is pa - pb ≠ 0
Iii) The proportion of sales made in Market Area 1 is 0.45.
A) (i), (ii) and (iii) are all correct statements
B) (i) and (ii) are correct statements, but not (iii).
C) (i) and (iii) are correct statements but not (ii).
D) (ii) and (iii) are correct statements but not (i).
E) (ii) is a correct statement, but not (i) and (iii).
i. The null hypothesis is pa - pb = 0Ii) The alternate hypothesis is pa - pb ≠ 0
Iii) The proportion of sales made in Market Area 1 is 0.45.
A) (i), (ii) and (iii) are all correct statements
B) (i) and (ii) are correct statements, but not (iii).
C) (i) and (iii) are correct statements but not (ii).
D) (ii) and (iii) are correct statements but not (i).
E) (ii) is a correct statement, but not (i) and (iii).
Unlock Deck
Unlock for access to all 87 flashcards in this deck.
Unlock Deck
k this deck
28
To compare the effect of weather on sales of soft drinks, a soda manufacturer sampled two regions of the country with the following results. Is there a difference in sales between the 2 regions? i. The null hypothesis is pa - pb = 0 ii. The alternate hypothesis is pa - pb ≠ 0
Iii) The proportion of sales made in Market Area 2 is 0.33.
A) (i), (ii) and (iii) are all correct statements
B) (i) and (ii) are correct statements, but not (iii).
C) (i) and (iii) are correct statements but not (ii).
D) (ii) and (iii) are correct statements but not (i).
E) (ii) is a correct statement, but not (i) and (iii).
i. The null hypothesis is pa - pb = 0 ii. The alternate hypothesis is pa - pb ≠ 0Iii) The proportion of sales made in Market Area 2 is 0.33.
A) (i), (ii) and (iii) are all correct statements
B) (i) and (ii) are correct statements, but not (iii).
C) (i) and (iii) are correct statements but not (ii).
D) (ii) and (iii) are correct statements but not (i).
E) (ii) is a correct statement, but not (i) and (iii).
Unlock Deck
Unlock for access to all 87 flashcards in this deck.
Unlock Deck
k this deck
29
Suppose we are testing the difference between two proportions at the 0.05 level of significance. If the computed z is -1.07, what is our decision?
A) Reject the null hypothesis
B) Do not reject the null hypothesis
C) Take a larger sample
D) Reserve judgment
E) None of these statements is correct
A) Reject the null hypothesis
B) Do not reject the null hypothesis
C) Take a larger sample
D) Reserve judgment
E) None of these statements is correct
Unlock Deck
Unlock for access to all 87 flashcards in this deck.
Unlock Deck
k this deck
30
To compare the effect of weather on sales of soft drinks, a soda manufacturer sampled two regions of the country with the following results. Is there a difference in sales between the 2 regions? i. The null hypothesis is pa - pb = 0
Ii) The alternate hypothesis is pa - pb ≠ 0
Iii) If α = 0.01 and the z-statistic were calculated to be -1.96, your decision would be to fail to reject
A) (i), (ii) and (iii) are all correct statements
B) (i) and (ii) are correct statements, but not (iii).
C) (i) and (iii) are correct statements but not (ii).
D) (ii) and (iii) are correct statements but not (i).
E) (ii) is a correct statement, but not (i) and (iii).
i. The null hypothesis is pa - pb = 0Ii) The alternate hypothesis is pa - pb ≠ 0
Iii) If α = 0.01 and the z-statistic were calculated to be -1.96, your decision would be to fail to reject
A) (i), (ii) and (iii) are all correct statements
B) (i) and (ii) are correct statements, but not (iii).
C) (i) and (iii) are correct statements but not (ii).
D) (ii) and (iii) are correct statements but not (i).
E) (ii) is a correct statement, but not (i) and (iii).
Unlock Deck
Unlock for access to all 87 flashcards in this deck.
Unlock Deck
k this deck
31
How is a pooled estimate represented?
A) pc
B) z
C) p
D) np
E) None of these statements is correct
A) pc
B) z
C) p
D) np
E) None of these statements is correct
Unlock Deck
Unlock for access to all 87 flashcards in this deck.
Unlock Deck
k this deck
32
To compare the effect of weather on sales of soft drinks, a soda manufacturer sampled two regions of the country with the following results. Is there a difference in sales between the 2 regions? i. The null hypothesis is pa - pb = 0
Ii) The alternate hypothesis is pa - pb ≠ 0
Iii) Using the 1% level of significance, the critical value is ±2.58.
A) (i), (ii) and (iii) are all correct statements
B) (i) and (ii) are correct statements, but not (iii).
C) (i) and (iii) are correct statements but not (ii).
D) (ii) and (iii) are correct statements but not (i).
E) (ii) is a correct statement, but not (i) and (iii).
i. The null hypothesis is pa - pb = 0Ii) The alternate hypothesis is pa - pb ≠ 0
Iii) Using the 1% level of significance, the critical value is ±2.58.
A) (i), (ii) and (iii) are all correct statements
B) (i) and (ii) are correct statements, but not (iii).
C) (i) and (iii) are correct statements but not (ii).
D) (ii) and (iii) are correct statements but not (i).
E) (ii) is a correct statement, but not (i) and (iii).
Unlock Deck
Unlock for access to all 87 flashcards in this deck.
Unlock Deck
k this deck
33
A national manufacturer of ball bearings is experimenting with two different processes for producing precision ball bearings. It is important that the diameters be as close as possible to an industry standard. The output from each process is sampled and the average error from the industry standard is calculated. The results are presented below. The researcher is interested in determining whether there is evidence that the two processes yield different average errors.
This example is what type of test?
A) One sample test of means.
B) Two sample test of means.
C) Paired t-test.
D) Test of proportions.
E) None of these statements is correct
The researcher is interested in determining whether there is evidence that the two processes yield different average errors.This example is what type of test?
A) One sample test of means.
B) Two sample test of means.
C) Paired t-test.
D) Test of proportions.
E) None of these statements is correct
Unlock Deck
Unlock for access to all 87 flashcards in this deck.
Unlock Deck
k this deck
34
If the decision is to reject the null hypothesis at the 5% level of significance, what are the acceptable alternate hypothesis and rejection region?
A) p1 ≠ p2; z > 1.65 and z < - 1.65
B) p1 ≠ p2; z > 1.96 and z < - 1.96
C) p1 > p2; z < - 1.65
D) p1 > p2; z < - 1.96
E) None of these statements is correct
A) p1 ≠ p2; z > 1.65 and z < - 1.65
B) p1 ≠ p2; z > 1.96 and z < - 1.96
C) p1 > p2; z < - 1.65
D) p1 > p2; z < - 1.96
E) None of these statements is correct
Unlock Deck
Unlock for access to all 87 flashcards in this deck.
Unlock Deck
k this deck
35
i. We use the pooled estimate of the proportion in testing the difference between two population proportions.
Ii) The pooled estimate of the proportion is found by dividing the total number of samples by the total number of successes.
Iii) A committee studying employer-employee relations proposed that each employee would rate his or her immediate supervisor and in turn the supervisor would rate each employee. To find reactions regarding the proposal, 120 office personnel and 160 plant personnel were selected at random. Seventy-eight of the office personnel and 90 of the plant personnel were in favour of the proposal. Computed z = 1.48. At the 0.05 level, it was concluded that there is sufficient evidence to support the belief that the proportion of office personnel in favour of the proposal is greater than that of the plant personnel.
A) (i), (ii) and (iii) are all false statements
B) (i) and (ii) are correct statements, but not (iii).
C) (i) and (iii) are correct statements but not (ii).
D) (ii) and (iii) are correct statements but not (i).
E) (i) is a correct statement, but not (ii) and (iii).
Unlock Deck
Unlock for access to all 87 flashcards in this deck.
Unlock Deck
k this deck
36
A national manufacturer of ball bearings is experimenting with two different processes for producing precision ball bearings. It is important that the diameters be as close as possible to an industry standard. The output from each process is sampled and the average error from the industry standard is calculated. The results are presented below. The researcher is interested in determining whether there is evidence that the two processes yield different average errors. Assume calculated t to be +2.70; at the 0.01 level of significance what would be the decision?
A) Reject the null hypothesis and conclude the means are different.
B) Reject the null hypothesis and conclude the means are the same.
C) Fail to reject the null hypothesis and conclude the means are the same.
D) Fail to reject the null hypothesis and conclude the means are different.
E) None of these statements are correct.
The researcher is interested in determining whether there is evidence that the two processes yield different average errors. Assume calculated t to be +2.70; at the 0.01 level of significance what would be the decision?A) Reject the null hypothesis and conclude the means are different.
B) Reject the null hypothesis and conclude the means are the same.
C) Fail to reject the null hypothesis and conclude the means are the same.
D) Fail to reject the null hypothesis and conclude the means are different.
E) None of these statements are correct.
Unlock Deck
Unlock for access to all 87 flashcards in this deck.
Unlock Deck
k this deck
37
To compare the effect of weather on sales of soft drinks, a soda manufacturer sampled two regions of the country with the following results. Is there a difference in sales between the 2 regions? i. The alternate hypothesis is pa - pb ≠ 0
Ii) The proportion of sales made in Market Area 1 is 0.40.
Iii) The proportion of sales made in Market Area 2 is 0.33.
A) (i), (ii) and (iii) are all correct statements
B) (i) and (ii) are correct statements, but not (iii).
C) (i) and (iii) are correct statements but not (ii).
D) (ii) and (iii) are correct statements but not (i).
E) (ii) is a correct statement, but not (i) and (iii).
i. The alternate hypothesis is pa - pb ≠ 0Ii) The proportion of sales made in Market Area 1 is 0.40.
Iii) The proportion of sales made in Market Area 2 is 0.33.
A) (i), (ii) and (iii) are all correct statements
B) (i) and (ii) are correct statements, but not (iii).
C) (i) and (iii) are correct statements but not (ii).
D) (ii) and (iii) are correct statements but not (i).
E) (ii) is a correct statement, but not (i) and (iii).
Unlock Deck
Unlock for access to all 87 flashcards in this deck.
Unlock Deck
k this deck
38
The results of a mathematics placement exam at Mercy College for two campuses are as follows: What is the p-value if the computed test statistic is 4.1?
A) 1.0
B) 0.0
C) 0.05
D) 0.95
E) None of these statements are correct
What is the p-value if the computed test statistic is 4.1?A) 1.0
B) 0.0
C) 0.05
D) 0.95
E) None of these statements are correct
Unlock Deck
Unlock for access to all 87 flashcards in this deck.
Unlock Deck
k this deck
39
A poll of 400 people from village 1 showed 250 preferred chocolate raspberry coffee to the regular blend while 170 out of 350 in village 2 preferred the same flavour. To test the hypothesis that there is no difference in preferences in the two villages, what is the alternate hypothesis?
A) p1 - p2 < 0
B) p1 - p2 > 0
C) p1 = p2
D) p1 - p2 ≠ 0
E) None of these statements is correct
A) p1 - p2 < 0
B) p1 - p2 > 0
C) p1 = p2
D) p1 - p2 ≠ 0
E) None of these statements is correct
Unlock Deck
Unlock for access to all 87 flashcards in this deck.
Unlock Deck
k this deck
40
The results of a mathematics placement exam at Mercy College for two campuses are as follows: What is the computed value of the test statistic?
A) 9.3
B) 2.6
C) 3.4
D) 1.9
E) None of these statements are correct
What is the computed value of the test statistic?A) 9.3
B) 2.6
C) 3.4
D) 1.9
E) None of these statements are correct
Unlock Deck
Unlock for access to all 87 flashcards in this deck.
Unlock Deck
k this deck
41
To compare the effect of weather on sales of soft drinks, a soda manufacturer sampled two regions of the country with the following results. Is there a difference in sales between the 2 regions? i. The alternate hypothesis is pa - pb ¹ 0 ii. The z-statistic is 3.57.
iii. Your decision is to accept the null hypothesis.
A) (i), (ii) and (iii) are all correct statements
B) (i) and (ii) are correct statements, but not (iii).
C) (i) and (iii) are correct statements but not (ii).
D) (ii) and (iii) are correct statements but not (i).
E) (ii) is a correct statement, but not (i) and (iii).
i. The alternate hypothesis is pa - pb ¹ 0 ii. The z-statistic is 3.57. iii. Your decision is to accept the null hypothesis.
A) (i), (ii) and (iii) are all correct statements
B) (i) and (ii) are correct statements, but not (iii).
C) (i) and (iii) are correct statements but not (ii).
D) (ii) and (iii) are correct statements but not (i).
E) (ii) is a correct statement, but not (i) and (iii).
Unlock Deck
Unlock for access to all 87 flashcards in this deck.
Unlock Deck
k this deck
42
i. If samples taken from two populations are not independent, then a test of paired differences is applied.
Ii) The paired difference test has (n1 + n2 - 2) degrees of freedom.
Iii) The paired t test is especially appropriate when the sample sizes of two groups are the same.
A) (i), (ii) and (iii) are all correct statements
B) (i) and (ii) are correct statements, but not (iii).
C) (i) and (iii) are correct statements but not (ii).
D) (ii) and (iii) are correct statements but not (i).
E) (i) is a correct statement, but not (ii) and (iii).
Unlock Deck
Unlock for access to all 87 flashcards in this deck.
Unlock Deck
k this deck
43
A recent study compared the time spent together by single and dual-earner couples. According to the records kept during the study, the mean amount of time spent together watching TV among single- earner couples was 64 minutes per day, with a standard deviation of 15.5 minutes. For the dual-earner couples, the mean time was 48.4 and the standard deviation was 18.1. At a 0.01 significance level, can we conclude that the single-earner couples on average spend more time watching TV together? There were 20 single-earner and 12 dual-earner couples studied. State the decision rule, the value of the test statistic, and your decision.
A) Reject if t > 2.457, t = 2.59, single-earner couples spend more time watching TV together.
B) Reject if t > 2.508, t = 0.96, insufficient evidence to say that single-earner couples spend more time watching TV together.
C) Reject if t > 2.797, t = 2.57, single-earner couples spend more time watching TV together.
D) Reject if t > 2.042, t = 1.96, insufficient evidence to say that single-earner couples spend more time watching TV together.
E) Reject if t > 2.485, t = 2.77, single-earner couples spend more time watching TV together.
Unlock Deck
Unlock for access to all 87 flashcards in this deck.
Unlock Deck
k this deck
44
A recent study compared the time spent together by single and dual- earner couples. According to the records kept during the study, the mean amount of time spent together watching TV among single- earner couples was 55 minutes per day, with a standard deviation of 15.5 minutes. For the dual-earner couples, the mean time was 48.4 and the standard deviation was 18.1. At a 0.01 significance level, can we conclude that the single-earner couples on average spend more time watching TV together? There were 12 single-earner and 12 dual-earner couples studied. State the decision rule, the value of the test statistic, and your decision.
A) Reject if t > 2.485, t = 2.57, insufficient evidence to say that single-earner couples spend more time watching TV together.
B) Reject if t > 2.508, t = 0.96, insufficient evidence to say that single-earner couples spend more time watching TV together.
C) Reject if t > 2.473, t = 2.57, single-earner couples spend more time watching TV together.
D) Reject if t > 2.508, t = 0.96, single-earner couples spend more time watching TV together.
E) Reject if t > 2.485, t = 2.01, single-earner couples spend more time watching TV together.
Unlock Deck
Unlock for access to all 87 flashcards in this deck.
Unlock Deck
k this deck
45
i. The paired difference test has (n1 + n2 - 2) degrees of freedom.
ii. The paired t test is especially appropriate when the sample sizes of two groups are the same.
Iii) A statistics professor wants to compare grades of two different groups of students taking the same course in two different sections. This is an example of a paired sample.
A) (i), (ii) and (iii) are all correct statements
B) (i) and (ii) are correct statements, but not (iii).
C) (i) and (iii) are correct statements but not (ii).
D) (ii) and (iii) are correct statements but not (i).
E) (i), (ii) and (iii) are all false statements
Unlock Deck
Unlock for access to all 87 flashcards in this deck.
Unlock Deck
k this deck
46
Of 150 adults who tried a new peach-flavoured peppermint patty, 81 rated it excellent. Of 200 children sampled, 123 rated it excellent. Using the 0.10 level of significance, can we conclude that there is a significant difference in the proportion of adults and the proportion of children who rate the new flavour as excellent? State the decision rule, the value of the test statistic, and your decision.
A) Reject if z > 1.645 or < -1.645, z = -1.28, no difference
B) Reject if z > 1.645 or < -1.645, z = -1.28, difference exists
C) Reject if z > 1.96 or < -1.96, z = -0.66, no difference
D) Reject if z > 1.96 or < -1.96, z = -1.41, difference exists
E) Reject if z > 1.645 or < -1.645, z = -1.41, no difference
Unlock Deck
Unlock for access to all 87 flashcards in this deck.
Unlock Deck
k this deck
47
To compare the effect of weather on sales of soft drinks, a soda manufacturer sampled two regions of the country with the following results. Is there a difference in sales between the 2 regions? i. The alternate hypothesis is pa - pb ≠ 0
Ii) Using the 1% level of significance, the critical value is ±2.58.
Iii) The z-statistic is 3.57.
A) (i), (ii) and (iii) are all correct statements
B) (i) and (ii) are correct statements, but not (iii).
C) (i) and (iii) are correct statements but not (ii).
D) (ii) and (iii) are correct statements but not (i).
E) (ii) is a correct statement, but not (i) and (iii).
i. The alternate hypothesis is pa - pb ≠ 0Ii) Using the 1% level of significance, the critical value is ±2.58.
Iii) The z-statistic is 3.57.
A) (i), (ii) and (iii) are all correct statements
B) (i) and (ii) are correct statements, but not (iii).
C) (i) and (iii) are correct statements but not (ii).
D) (ii) and (iii) are correct statements but not (i).
E) (ii) is a correct statement, but not (i) and (iii).
Unlock Deck
Unlock for access to all 87 flashcards in this deck.
Unlock Deck
k this deck
48
Of 150 adults who tried a new peach-flavoured peppermint patty, 87 rated it excellent. Of 200 children sampled, 123 rated it excellent. Using the 0.10 level of significance, can we conclude that there is a significant difference in the proportion of adults and the proportion of children who rate the new flavour as excellent? State the decision rule, the value of the test statistic, and your decision.
A) Reject if z > 1.645 or < -1.645, z = -0.66, no difference
B) Reject if z > 1.645, z = -0.66, no difference
C) Reject if z > 1.645 or < -1.645, z = -5.28, difference exists
D) Reject if z > 1.96 or < -1.96, z = -0.66, no difference
E) Reject if z > 1.96 or < -1.96, z = -2.26, difference exists
A) Reject if z > 1.645 or < -1.645, z = -0.66, no difference
B) Reject if z > 1.645, z = -0.66, no difference
C) Reject if z > 1.645 or < -1.645, z = -5.28, difference exists
D) Reject if z > 1.96 or < -1.96, z = -0.66, no difference
E) Reject if z > 1.96 or < -1.96, z = -2.26, difference exists
Unlock Deck
Unlock for access to all 87 flashcards in this deck.
Unlock Deck
k this deck
49
To compare the effect of weather on sales of soft drinks, a soda manufacturer sampled two regions of the country with the following results. Is there a difference in sales between the 2 regions? i. Using the 1% level of significance, the critical value is ±2.58.
ii. The z-statistic is 3.57.
Iii) Your decision is to reject the null hypothesis
A) (i), (ii) and (iii) are all correct statements
B) (i) and (ii) are correct statements, but not (iii).
C) (i) and (iii) are correct statements but not (ii).
D) (ii) and (iii) are correct statements but not (i).
E) (ii) is a correct statement, but not (i) and (iii).
i. Using the 1% level of significance, the critical value is ±2.58. ii. The z-statistic is 3.57.
Iii) Your decision is to reject the null hypothesis
A) (i), (ii) and (iii) are all correct statements
B) (i) and (ii) are correct statements, but not (iii).
C) (i) and (iii) are correct statements but not (ii).
D) (ii) and (iii) are correct statements but not (i).
E) (ii) is a correct statement, but not (i) and (iii).
Unlock Deck
Unlock for access to all 87 flashcards in this deck.
Unlock Deck
k this deck
50
Of 250 adults who tried a new multi-grain cereal, Wow!, 187 rated it excellent; of 100 children sampled, 66 rated it excellent. Using the 0.1 significance level and the alternate hypothesis p1 not equal to p2, what is the null hypothesis?
A) p1 - p2> 0
B) p1 - p2< 0
C) p1 - p2 = 0
D) None of these statements are correct
A) p1 - p2> 0
B) p1 - p2< 0
C) p1 - p2 = 0
D) None of these statements are correct
Unlock Deck
Unlock for access to all 87 flashcards in this deck.
Unlock Deck
k this deck
51
Of 150 adults who tried a new peach-flavoured peppermint patty, 75 rated it excellent. Of 200 children sampled, 123 rated it excellent. Using the 0.10 level of significance, can we conclude that there is a significant difference in the proportion of adults and the proportion of children who rate the new flavour as excellent? State the decision rule, the value of the test statistic, and your decision.
A) Reject if z > 1.645, z = -0.66, no difference
B) Reject if z > 1.645 or < -1.645, z = -5.28, difference exists
C) Reject if z > 1.96 or < -1.96, z = -2.15 no difference
D) Reject if z > 1.96 or < -1.96, z = -2.26, difference exists
E) Reject if z > 1.645 or < -1.645, z = -2.15, difference exists
A) Reject if z > 1.645, z = -0.66, no difference
B) Reject if z > 1.645 or < -1.645, z = -5.28, difference exists
C) Reject if z > 1.96 or < -1.96, z = -2.15 no difference
D) Reject if z > 1.96 or < -1.96, z = -2.26, difference exists
E) Reject if z > 1.645 or < -1.645, z = -2.15, difference exists
Unlock Deck
Unlock for access to all 87 flashcards in this deck.
Unlock Deck
k this deck
52
A recent study compared the time spent together by single and dual- earner couples. According to the records kept during the study, the mean amount of time spent together watching TV among single- earner couples was 65 minutes per day, with a standard deviation of 15.5 minutes. For the dual-earner couples, the mean time was 48.4 and the standard deviation was 18.1. At a 0.01 significance level, can we conclude that the single-earner couples on average spend more time watching TV together? There were 15 single-earner and 12 dual-earner couples studied. State the decision rule, the value of the test statistic, and your decision.
A) Reject if t > 2.485, t = 2.01, single-earner couples spend more time watching TV together.
B) Reject if t > 2.473, t = 1.95, insufficient evidence to say that single-earner couples spend more time watching TV together.
C) Reject if t > 2.473, t = 2.57, single-earner couples spend more time watching TV together.
D) Reject if t > 2.485, t = 2.57, insufficient evidence to say that single-earner couples spend more time watching TV together.
E) Reject if t > 2.485, t = 2.57, single-earner couples spend more time watching TV together.
Unlock Deck
Unlock for access to all 87 flashcards in this deck.
Unlock Deck
k this deck
53
A recent study compared the time spent together by single and dual- earner couples. According to the records kept during the study, the mean amount of time spent together watching TV among single- earner couples was 61 minutes per day, with a standard deviation of 15.5 minutes. For the dual-earner couples, the mean time was 48.4 and the standard deviation was 18.1. At a 0.01 significance level, can we conclude that the single-earner couples on average spend more time watching TV together? There were 15 single-earner and 12 dual-earner couples studied. State the decision rule, the value of the test statistic, and your decision.
A) Reject if t > 2.485, t = 1.95, insufficient evidence to say that single-earner couples spend more time watching TV together.
B) Reject if t > 2.485, t = 2.11, insufficient evidence to say that single-earner couples spend more time watching TV together.
C) Reject if t > 2.473, t = 1.95, insufficient evidence to say that single-earner couples spend more time watching TV together.
D) Reject if t > 2.473, t = 2.55, single-earner couples spend more time watching TV together.
E) Reject if t > 2.485, t = 2.55, single-earner couples spend more time watching TV together.
Unlock Deck
Unlock for access to all 87 flashcards in this deck.
Unlock Deck
k this deck
54
Of 250 adults who tried a new multi-grain cereal, Wow!, 187 rated it excellent; of 100 children sampled, 66 rated it excellent. What test statistic should we use?
A) z-statistic
B) Right one-tailed test
C) Left one-tailed test
D) Two-tailed test
E) None of these statements are correct
A) z-statistic
B) Right one-tailed test
C) Left one-tailed test
D) Two-tailed test
E) None of these statements are correct
Unlock Deck
Unlock for access to all 87 flashcards in this deck.
Unlock Deck
k this deck
55
i. If samples taken from two populations are not independent, then a test of paired differences is applied.
Ii) The paired difference test has (n1 + n2 - 2) degrees of freedom.
Iii) A statistics professor wants to compare grades of two different groups of students taking the same
Course in two different sections. This is an example of a paired sample.
A) (i), (ii) and (iii) are all correct statements
B) (i) and (ii) are correct statements, but not (iii).
C) (i) is a correct statement, but not (ii) or (iii).
D) (ii) and (iii) are correct statements but not (i).
E) (ii) is a correct statement, but not (i) and (iii).
Unlock Deck
Unlock for access to all 87 flashcards in this deck.
Unlock Deck
k this deck
56
When is it appropriate to use the paired difference t-test?
A) Four samples are compared at once
B) Any two samples are compared
C) Two independent samples are compared
D) Two dependent samples are compared
E) None of these statements is correct
A) Four samples are compared at once
B) Any two samples are compared
C) Two independent samples are compared
D) Two dependent samples are compared
E) None of these statements is correct
Unlock Deck
Unlock for access to all 87 flashcards in this deck.
Unlock Deck
k this deck
57
A recent study compared the time spent together by single and dual-earner couples. According to the records kept during the study, the mean amount of time spent together watching TV among single- earner couples was 60 minutes per day, with a standard deviation of 15.5 minutes. For the dual-earner couples, the mean time was 48.4 and the standard deviation was 18.1. At a 0.01 significance level, can we conclude that the single-earner couples on average spend more time watching TV together? There were 12 single-earner and 12 dual-earner couples studied. State the decision rule, the value of the test statistic, and your decision.
A) Reject if t > 2.485, t = 2.77, single-earner couples spend more time watching TV together.
B) Reject if t > 2.508, t = 1.96, insufficient evidence to say that single-earner couples spend more time watching TV together.
C) Reject if t > 2.797, t = 2.57, single-earner couples spend more time watching TV together.
D) Reject if t > 2.508, t = 1.69, insufficient evidence to say that single-earner couples spend more time watching TV together.
E) Reject if t > 2.508, t = 0.96, insufficient evidence to say that single-earner couples spend more time watching TV together.
Unlock Deck
Unlock for access to all 87 flashcards in this deck.
Unlock Deck
k this deck
58
i. If samples taken from two populations are not independent, then a test of paired differences is applied.
Ii) The paired difference test has (n - 1) degrees of freedom.
Iii) The paired t test is especially appropriate when the sample sizes of two groups are the same.
A) (i), (ii) and (iii) are all correct statements
B) (i) and (ii) are correct statements, but not (iii).
C) (i) and (iii) are correct statements but not (ii).
D) (ii) and (iii) are correct statements but not (i).
E) (ii) is a correct statement, but not (i) and (iii).
Unlock Deck
Unlock for access to all 87 flashcards in this deck.
Unlock Deck
k this deck
59
Of 150 adults who tried a new peach-flavoured peppermint patty, 99 rated it excellent. Of 200 children sampled, 123 rated it excellent. Using the 0.10 level of significance, can we conclude that there is a significant difference in the proportion of adults and the proportion of children who rate the new flavour as excellent? State the decision rule, the value of the test statistic, and your decision.
A) Reject if z > 1.96 or < -1.96, z = -2.26, difference exists
B) Reject if z > 1.96 or < -1.96, z = -0.66, no difference
C) Reject if z > 1.645 or < -1.645, z = 0.87, difference exists
D) Reject if z > 1.645 or < -1.645, z = -0.28, difference exists
E) Reject if z > 1.645 or < -1.645, z = 0.87, no difference
Unlock Deck
Unlock for access to all 87 flashcards in this deck.
Unlock Deck
k this deck
60
Of 150 adults who tried a new peach-flavoured peppermint patty, 90 rated it excellent. Of 200 children sampled, 123 rated it excellent. Using the 0.10 level of significance, can we conclude that there is a significant difference in the proportion of adults and the proportion of children who rate the new flavour as excellent? State the decision rule, the value of the test statistic, and your decision.
A) Reject if z > 1.645 or < -1.645, z = -0.28, difference exists
B) Reject if z > 1.645 or < -1.645, z = -0.28, no difference
C) Reject if z > 1.645 or < -1.645, z = -1.28, difference exists
D) Reject if z > 1.96 or < -1.96, z = -0.66, no difference
E) Reject if z > 1.96 or < -1.96, z = -2.26, difference exists
Unlock Deck
Unlock for access to all 87 flashcards in this deck.
Unlock Deck
k this deck
61
Accounting procedures allow a business to evaluate their inventory at LIFO (Last In First Out) or FIFO (First In First Out). A manufacturer evaluated its finished goods inventory (in $000) for five products both ways. Based on the following results, is LIFO more effective in keeping the value of his inventory lower? What is the degree of freedom?
A) 4
B) 5
C) 15
D) 10
E) 9
What is the degree of freedom?A) 4
B) 5
C) 15
D) 10
E) 9
Unlock Deck
Unlock for access to all 87 flashcards in this deck.
Unlock Deck
k this deck
62
A local retail business wishes to determine if there is a difference in preferred indoor temperature between men and women. A random sample of data is collected, with the following results (note: there are slight differences between Excel and MegaStat output in this test): Using a 0.05 level of significance, can we conclude that there is indeed a difference in the temperature that men prefer compared to women? What is the null hypothesis if we assume men to be group 1 and women group 2?
A) µ1 = µ2, or µd = 0
B) µ1 ≠ µ2, or µd ≠ 0
C) µ1 - µ2 ≤ 20
D) µ1 - µ2 > 20
E) None of these statements are correct
Using a 0.05 level of significance, can we conclude that there is indeed a difference in the temperature that men prefer compared to women? What is the null hypothesis if we assume men to be group 1 and women group 2?A) µ1 = µ2, or µd = 0
B) µ1 ≠ µ2, or µd ≠ 0
C) µ1 - µ2 ≤ 20
D) µ1 - µ2 > 20
E) None of these statements are correct
Unlock Deck
Unlock for access to all 87 flashcards in this deck.
Unlock Deck
k this deck
63
Accounting procedures allow a business to evaluate their inventory at LIFO (Last In First Out) or FIFO (First In First Out). A manufacturer evaluated its finished goods inventory (in $000) for five products both ways. Based on the following results, is LIFO more effective in keeping the value of his inventory lower? What is the decision at the 5% level of significance?
A) Looking at the large P-value of .2019 we conclude LIFO is more effective.
B) Reject the null hypothesis and conclude LIFO is more effective.
C) Reject the alternate hypothesis and conclude LIFO is more effective. DThe large P-value of .2017 indicates that there is a good chance of getting this sample data when the
) two methods are in fact not significantly different, so we conclude that LIFO is not more effective.
E) None of these statements are correct.
What is the decision at the 5% level of significance? A) Looking at the large P-value of .2019 we conclude LIFO is more effective.
B) Reject the null hypothesis and conclude LIFO is more effective.
C) Reject the alternate hypothesis and conclude LIFO is more effective. DThe large P-value of .2017 indicates that there is a good chance of getting this sample data when the
) two methods are in fact not significantly different, so we conclude that LIFO is not more effective.
E) None of these statements are correct.
Unlock Deck
Unlock for access to all 87 flashcards in this deck.
Unlock Deck
k this deck
64
Accounting procedures allow a business to evaluate their inventory at LIFO (Last In First Out) or FIFO (First In First Out). A manufacturer evaluated its finished goods inventory (in $000) for five products both ways. Based on the following results, is LIFO more effective in keeping the value of his inventory lower? This example is what type of test?
A) One sample test of means.
B) Two sample test of means.
C) Paired t-test.
D) Test of proportions.
E) None of these statements are correct
This example is what type of test?A) One sample test of means.
B) Two sample test of means.
C) Paired t-test.
D) Test of proportions.
E) None of these statements are correct
Unlock Deck
Unlock for access to all 87 flashcards in this deck.
Unlock Deck
k this deck
65
The employees at the East Vancouver office of a multinational company are demanding higher salaries than those offered at the company office located in Oshawa Ontario. Their justification for the pay difference is that the difference between the average price of single-family houses in East Vancouver and that in Oshawa is more than $60,000. Before making a decision, the company management wants to study the difference in the prices of single-family houses for sale at the two locations.
The results of their search of recent house sales are as follows (in $000, rounded to the nearest
Thousand): Assuming that the population distributions are approximately normal, can we conclude at the 0.05 significance level that the difference between the two population means is greater than $60,000?
If we let East Vancouver be population 1 and Oshawa be population 2, what is the null hypothesis?
A) µ1 = µ2, or µd = 0
B) µ1 ≠ µ2, or µd ≠ 0
C) µ1 - µ2 ≤ 60
D) µ1 - µ2 > 60
E) None of these statements are correct
The results of their search of recent house sales are as follows (in $000, rounded to the nearest
Thousand):
Assuming that the population distributions are approximately normal, can we conclude at the 0.05 significance level that the difference between the two population means is greater than $60,000?If we let East Vancouver be population 1 and Oshawa be population 2, what is the null hypothesis?
A) µ1 = µ2, or µd = 0
B) µ1 ≠ µ2, or µd ≠ 0
C) µ1 - µ2 ≤ 60
D) µ1 - µ2 > 60
E) None of these statements are correct
Unlock Deck
Unlock for access to all 87 flashcards in this deck.
Unlock Deck
k this deck
66
The employees at the East Vancouver office of a multinational company are demanding higher salaries than those offered at the company office located in Oshawa Ontario. Their justification for the pay difference is that the difference between the average price of single-family houses in East Vancouver and that in Oshawa is more than $60,000. Before making a decision, the company management wants to study the difference in the prices of single-family houses for sale at the two locations.
The results of their search of recent house sales are as follows (in $000, rounded to the nearest thousand): Assuming that the population distributions are approximately normal, can we conclude at the 0.05 significance level that the difference between the two population means is greater than $60,000? This example is what type of test?
A) One sample test of means.
B) Two sample test of means.
C) Paired t-test.
D) Test of proportions.
E) None of these statements are correct
The results of their search of recent house sales are as follows (in $000, rounded to the nearest thousand):
Assuming that the population distributions are approximately normal, can we conclude at the 0.05 significance level that the difference between the two population means is greater than $60,000? This example is what type of test?A) One sample test of means.
B) Two sample test of means.
C) Paired t-test.
D) Test of proportions.
E) None of these statements are correct
Unlock Deck
Unlock for access to all 87 flashcards in this deck.
Unlock Deck
k this deck
67
The employees at the East Vancouver office of a multinational company are demanding higher salaries than those offered at the company office located in Oshawa Ontario. Their justification for the pay difference is that the difference between the average price of single-family houses in East Vancouver and that in Oshawa is more than $60,000. Before making a decision, the company management wants to study the difference in the prices of single-family houses for sale at the two locations.
The results of their search of recent house sales are as follows (in $000, rounded to the nearest thousand): Assuming that the population distributions are approximately normal, can we conclude at the 0.05 significance level that the difference between the two population means is greater than $60,000? What is the value of calculated t?
A) +1.93
B) +2.76
C) -2.76
D) -2.028
E) None of these statements are correct.
The results of their search of recent house sales are as follows (in $000, rounded to the nearest thousand):
Assuming that the population distributions are approximately normal, can we conclude at the 0.05 significance level that the difference between the two population means is greater than $60,000? What is the value of calculated t?A) +1.93
B) +2.76
C) -2.76
D) -2.028
E) None of these statements are correct.
Unlock Deck
Unlock for access to all 87 flashcards in this deck.
Unlock Deck
k this deck
68
The employees at the East Vancouver office of a multinational company are demanding higher salaries than those offered at the company office located in Oshawa Ontario. Their justification for the pay difference is that the difference between the average price of single-family houses in East Vancouver and that in Oshawa is more than $60,000. Before making a decision, the company management wants to study the difference in the prices of single-family houses for sale at the two locations. The results of their search of recent house sales are as follows (in $000, rounded to the nearest thousand): Assuming that the population distributions are approximately normal, can we conclude at the 0.05 significance level that the difference between the two population means is greater than $60,000? What is the alternate hypothesis?
A) µ1 = µ2, or µd = 0
B) µ1 ≠ µ2, or µd ≠ 0
C) µ1 - µ2 ≤ 60
D) µ1 - µ2 > 60
E) None of these statements are correct
Assuming that the population distributions are approximately normal, can we conclude at the 0.05 significance level that the difference between the two population means is greater than $60,000? What is the alternate hypothesis?A) µ1 = µ2, or µd = 0
B) µ1 ≠ µ2, or µd ≠ 0
C) µ1 - µ2 ≤ 60
D) µ1 - µ2 > 60
E) None of these statements are correct
Unlock Deck
Unlock for access to all 87 flashcards in this deck.
Unlock Deck
k this deck
69
The employees at the East Vancouver office of a multinational company are demanding higher salaries than those offered at the company office located in Oshawa Ontario. Their justification for the pay difference is that the difference between the average price of single-family houses in East Vancouver and that in Oshawa is more than $60,000. Before making a decision, the company management wants to study the difference in the prices of single-family houses for sale at the two locations.
The results of their search of recent house sales are as follows (in $000, rounded to the nearest thousand): Assuming that the population distributions are approximately normal, can we conclude at the 0.05 significance level that the difference between the two population means is greater than $60,000? What is the degree of freedom?
A) 4
B) 5
C) 15
D) 10
E) 9
The results of their search of recent house sales are as follows (in $000, rounded to the nearest thousand):
Assuming that the population distributions are approximately normal, can we conclude at the 0.05 significance level that the difference between the two population means is greater than $60,000? What is the degree of freedom?A) 4
B) 5
C) 15
D) 10
E) 9
Unlock Deck
Unlock for access to all 87 flashcards in this deck.
Unlock Deck
k this deck
70
A random sample of 20 statistics students was given 15 multiple-choice questions and 15 open- ended questions-all on the same material. The professor was interested in determining which type of questions the students scored higher. This experiment is an example of
A) a one sample test of means.
B) a two sample test of means.
C) a paired t-test.
D) a test of proportions.
E) None of these statements are correct
A) a one sample test of means.
B) a two sample test of means.
C) a paired t-test.
D) a test of proportions.
E) None of these statements are correct
Unlock Deck
Unlock for access to all 87 flashcards in this deck.
Unlock Deck
k this deck
71
The results of a mathematics placement exam at Mercy College for two campuses is as follows: We want to test the hypothesis that the mean score on Campus 1 is higher than on Campus 2. Using the printout above, what decision(s) can be made?
A) Looking at the P-value we conclude that there is no significant difference in the results from each campus
B) At a 5% level of significance we conclude that there is no significant difference in the results from each campus
C) At a 1% level of significance we conclude that campus 1 results are higher than campus 2 results
D) A & B are true
E) B & C are true
We want to test the hypothesis that the mean score on Campus 1 is higher than on Campus 2. Using the printout above, what decision(s) can be made?A) Looking at the P-value we conclude that there is no significant difference in the results from each campus
B) At a 5% level of significance we conclude that there is no significant difference in the results from each campus
C) At a 1% level of significance we conclude that campus 1 results are higher than campus 2 results
D) A & B are true
E) B & C are true
Unlock Deck
Unlock for access to all 87 flashcards in this deck.
Unlock Deck
k this deck
72
Accounting procedures allow a business to evaluate their inventory at LIFO (Last In First Out) or FIFO (First In First Out). A manufacturer evaluated its finished goods inventory (in $000) for five products both ways. Based on the following results, is LIFO more effective in keeping the value of his inventory lower? What is the value of calculated t?
A) +0.93
B) ±2.776
C) +0.0.47
D) -2.028
E) None of these statements are correct.
What is the value of calculated t?A) +0.93
B) ±2.776
C) +0.0.47
D) -2.028
E) None of these statements are correct.
Unlock Deck
Unlock for access to all 87 flashcards in this deck.
Unlock Deck
k this deck
73
Married women are more often than not working outside the home on at least a part-time basis, as do most mannered men. Does a husband's employment status affect his wife's well being? In an attempt to answer this question, 75 married female professionals were surveyed as to their job satisfaction. In this sample, 45 husbands were employed, and 30 were unemployed. The Learning Objective of the study was to compare the mean job satisfaction levels of the married women with working husbands, with the mean job satisfaction levels of the married women with husbands that stayed at home.
If you were to use Excel's Data Analysis to assist in your solution to this problem, which test would you use?
A) T-Test: paired 2-sample for means
B) T-test: 2-sample assuming equal variances
C) T-test: 2-sample assuming unequal variances
D) Z-test: 2-sample for mean
E) F-test: 2-sample for variances
Unlock Deck
Unlock for access to all 87 flashcards in this deck.
Unlock Deck
k this deck
74
Accounting procedures allow a business to evaluate their inventory at LIFO (Last In First Out) or FIFO (First In First Out). A manufacturer evaluated its finished goods inventory (in $000) for five products both ways. Based on the following results, is LIFO more effective in keeping the value of his inventory lower? What is the alternate hypothesis?
A) µF = µL, or µd = 0
B) µF ≠ µL, or µd ≠ 0
C) µF ≤ µL
D) µF > µL
E) None of these statements are correct
What is the alternate hypothesis?A) µF = µL, or µd = 0
B) µF ≠ µL, or µd ≠ 0
C) µF ≤ µL
D) µF > µL
E) None of these statements are correct
Unlock Deck
Unlock for access to all 87 flashcards in this deck.
Unlock Deck
k this deck
75
Married women are more often than not working outside the home on at least a part-time basis, as do most mannered men. Does a husband's employment status affect his wife's well being? In an attempt to answer this question, 75 married female professionals were surveyed as to their job satisfaction. In this sample, 45 husbands were employed, and 30 were unemployed. The Learning Objective of the study was to compare the mean job satisfaction levels of the married women with working husbands, with the mean job satisfaction levels of the married women with husbands that stayed at home.
The test statistic for this problem has what type of distribution?
A) Normal z
B) Student's t
C) Positively skewed
D) Negatively skewed
E) Binomial
The test statistic for this problem has what type of distribution?
A) Normal z
B) Student's t
C) Positively skewed
D) Negatively skewed
E) Binomial
Unlock Deck
Unlock for access to all 87 flashcards in this deck.
Unlock Deck
k this deck
76
Accounting procedures allow a business to evaluate their inventory at LIFO (Last In First Out) or FIFO (First In First Out). A manufacturer evaluated its finished goods inventory (in $000) for five products both ways. Based on the following results, is LIFO more effective in keeping the value of his inventory lower? What is the null hypothesis?
A) µF = µL, or µd = 0
B) µF ≠ µL, or µd ≠ 0
C) µF ≤ µL
D) µF > µL
E) None of these statements are correct
What is the null hypothesis?A) µF = µL, or µd = 0
B) µF ≠ µL, or µd ≠ 0
C) µF ≤ µL
D) µF > µL
E) None of these statements are correct
Unlock Deck
Unlock for access to all 87 flashcards in this deck.
Unlock Deck
k this deck
77
Accounting procedures allow a business to evaluate their inventory at LIFO (Last In First Out) or FIFO (First In First Out). A manufacturer evaluated its finished goods inventory (in $000) for five products both ways. Based on the following results, is LIFO more effective in keeping the value of his inventory lower? If you use the 5% level of significance, what is the critical t value?
A) +2.571
B) ±2.776
C) +2.262
D) ±2.228
E) None of these statements are correct.
If you use the 5% level of significance, what is the critical t value?A) +2.571
B) ±2.776
C) +2.262
D) ±2.228
E) None of these statements are correct.
Unlock Deck
Unlock for access to all 87 flashcards in this deck.
Unlock Deck
k this deck
78
Accounting procedures allow a business to evaluate their inventory at LIFO (Last In First Out) or FIFO (First In First Out). A manufacturer evaluated its finished goods inventory (in $000) for five products both ways. Based on the following results, is LIFO more effective in keeping the value of his inventory lower? What is the decision at the 5% level of significance?
A) Fail to reject the null hypothesis and conclude LIFO is more effective.
B) Reject the null hypothesis and conclude LIFO is more effective.
C) Reject the alternate hypothesis and conclude LIFO is more effective.
D) Fail to reject the null hypothesis and conclude LIFO is not more effective.
E) None of these statements are correct.
What is the decision at the 5% level of significance?A) Fail to reject the null hypothesis and conclude LIFO is more effective.
B) Reject the null hypothesis and conclude LIFO is more effective.
C) Reject the alternate hypothesis and conclude LIFO is more effective.
D) Fail to reject the null hypothesis and conclude LIFO is not more effective.
E) None of these statements are correct.
Unlock Deck
Unlock for access to all 87 flashcards in this deck.
Unlock Deck
k this deck
79
A local retail business wishes to determine if there is a difference in preferred indoor temperature between men and women. A random sample of data is collected, with the following results: If you were to use Excel's Data Analysis to assist in your solution to this problem, which test would you use?
A) T-Test: paired 2-sample for means
B) T-test: 2-sample assuming equal variances
C) T-test: 2-sample assuming unequal variances
D) Z-test: 2-sample for mean
E) F-test: 2-sample for variances
If you were to use Excel's Data Analysis to assist in your solution to this problem, which test would you use?A) T-Test: paired 2-sample for means
B) T-test: 2-sample assuming equal variances
C) T-test: 2-sample assuming unequal variances
D) Z-test: 2-sample for mean
E) F-test: 2-sample for variances
Unlock Deck
Unlock for access to all 87 flashcards in this deck.
Unlock Deck
k this deck
80
The employees at the East Vancouver office of a multinational company are demanding higher salaries than those offered at the company office located in Oshawa Ontario. Their justification for the pay difference is that the difference between the average price of single-family houses in East Vancouver and that in Oshawa is more than $60,000. Before making a decision, the company management wants to study the difference in the prices of single-family houses for sale at the two locations. The results of their search of recent house sales are as follows (in $000, rounded to the nearest thousand): Assuming that the population distributions are approximately normal, can we conclude at the 0.05 significance level that the difference between the two population means is greater than $60,000?
If you use the 5% level of significance, what is the critical t value?
A) 2.228
B) 1.812
C) 1.833
D) ±2.262
E) None of these statements are correct.
Assuming that the population distributions are approximately normal, can we conclude at the 0.05 significance level that the difference between the two population means is greater than $60,000?If you use the 5% level of significance, what is the critical t value?
A) 2.228
B) 1.812
C) 1.833
D) ±2.262
E) None of these statements are correct.
Unlock Deck
Unlock for access to all 87 flashcards in this deck.
Unlock Deck
k this deck
Unlock Deck
Unlock for access to all 87 flashcards in this deck.


