Deck 3: Graphing and Functions
Full screen (f)
Question
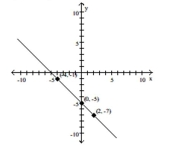
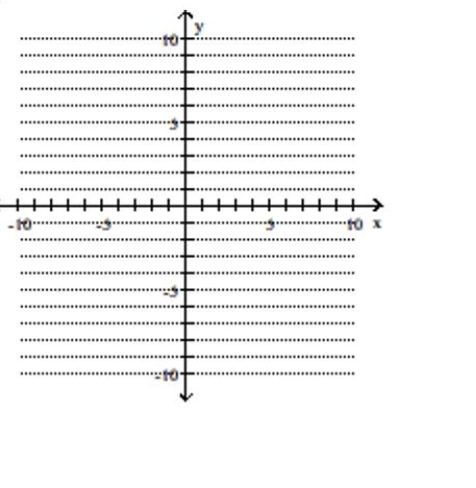
Consider the points plotted in the graph below.
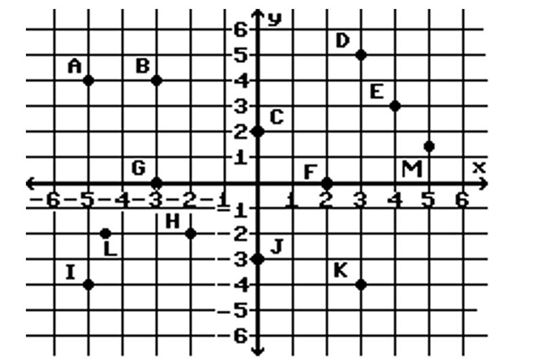
Give the coordinates for point B.
A)(4, -3)
B)(-5, 4)
C)(3, 4)
D)(-3, 4)
Give the coordinates for point B.
A)(4, -3)
B)(-5, 4)
C)(3, 4)
D)(-3, 4)
Question
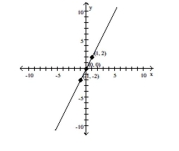
Consider the points plotted in the graph below.
Give the coordinates for points G and H.
A)G: (0, -3), H: (-2, -2)
B)G: (-3, 0), H: (-2, -2)
C)G: (-3, 0), H: (-2, 2)
D)G: (0, -3), H: (-2, 2)
Give the coordinates for points G and H.
A)G: (0, -3), H: (-2, -2)
B)G: (-3, 0), H: (-2, -2)
C)G: (-3, 0), H: (-2, 2)
D)G: (0, -3), H: (-2, 2)
Question
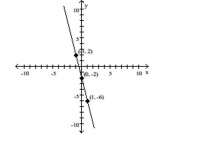
Consider the points plotted in the graph below.
Give the coordinates for points C and D.
A)C: (2, 0), D: (5, 3)
B)C: (2, 0), D: (3, 5)
C)C: (0, 2), D: (5, 3)
D)C: (0, 2), D: (3, 5)
Give the coordinates for points C and D.
A)C: (2, 0), D: (5, 3)
B)C: (2, 0), D: (3, 5)
C)C: (0, 2), D: (5, 3)
D)C: (0, 2), D: (3, 5)
Question
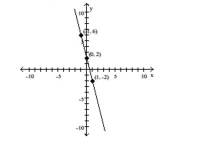
Consider the points plotted in the graph below.
Give the coordinates for points I and J.
A)I: (5, 4), J: (0, -3)
B)I: (-4, -5), J: (-3, 0)
C)I: (5, 4), J: (-3, 0)
D)I: (-5, -4), J: (0, -3)
Give the coordinates for points I and J.
A)I: (5, 4), J: (0, -3)
B)I: (-4, -5), J: (-3, 0)
C)I: (5, 4), J: (-3, 0)
D)I: (-5, -4), J: (0, -3)
Question
Consider the points plotted in the graph below.
Give the c oordinates for p oint M. A)
B)
C)
D)
Give the c oordinates for p oint M. A)
B)
C)
D)
Question
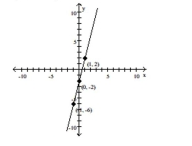
Consider the points plotted in the graph below.
Give the coordinates for points E and F.
A)E: (4, 3), F: (0, 2)
B)E: (4, 3), F: (2, 0)
C)E: (3, 4), F: (2, 0)
D)E: (3, 4), F: (0, 2)
Give the coordinates for points E and F.
A)E: (4, 3), F: (0, 2)
B)E: (4, 3), F: (2, 0)
C)E: (3, 4), F: (2, 0)
D)E: (3, 4), F: (0, 2)
Question
Plot the point
(2, -1) A)
A)
B)
C)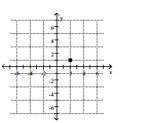
D)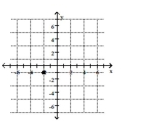
(2, -1)
A)B)
C)
D)
Question
Plot the point
(-1.5, -3)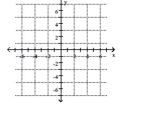
A)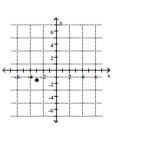
B)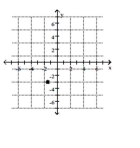
C)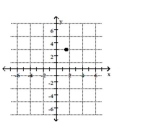
D)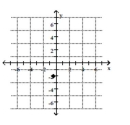
(-1.5, -3)
A)
B)
C)
D)
Question
Consider the points plotted in the graph below.
Give the coordinates for point K.
A)(3, -4)
B)(4, 3)
C)(3, 4)
D)(-4, 3)
Give the coordinates for point K.
A)(3, -4)
B)(4, 3)
C)(3, 4)
D)(-4, 3)
Question
Plot the point
(-1, -3)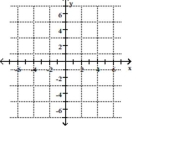
A)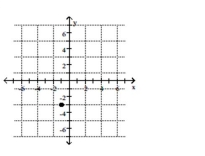
B)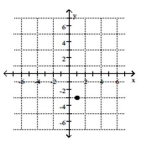 C)
C)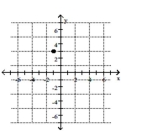
D)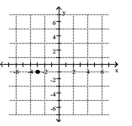
(-1, -3)
A)
B)
C)D)
Question
Plot the point
(0, -2)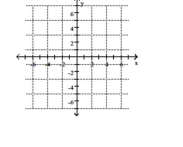
A)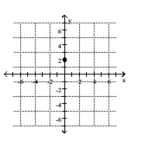
B)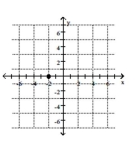
C)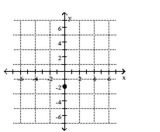
D)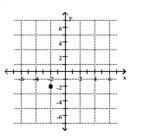 4
4
(0, -2)
A)
B)
C)
D)
4 Question
Consider the points plotted in the graph below.
Give the coordinates for point A.
A)(-5, 4)
B)(4, 5)
C)(5, 4)
D)(4, -5)
Give the coordinates for point A.
A)(-5, 4)
B)(4, 5)
C)(5, 4)
D)(4, -5)
Question
Plot the point
(-4, 1)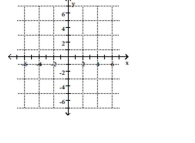
A)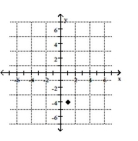
B)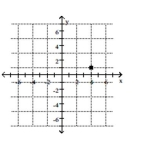
C )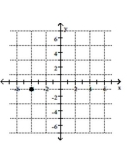
D)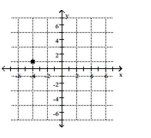
(-4, 1)
A)
B)
C )
D)
Question
Plot the point
(0, -4.5)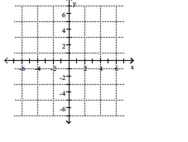
A)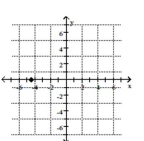
B)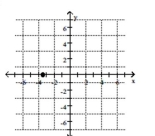 C)
C)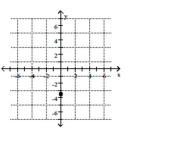
D)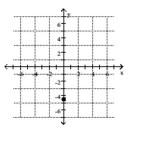
(0, -4.5)
A)
B)
C)D)
Question
Consider the points plotted in the graph below.
Give the coordinates for point .
A)
B)
C)
D)
Give the coordinates for point .
A)
B)
C)
D)
Question
Plot the point
(-2.5, 0)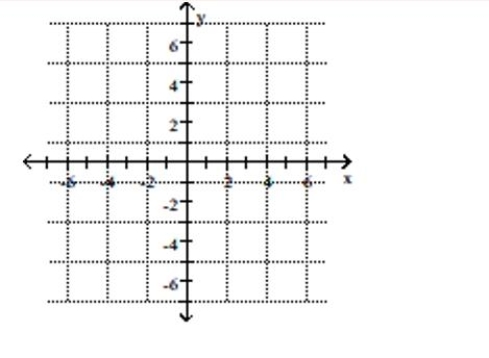 A)
A)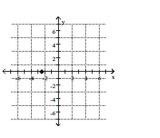
B)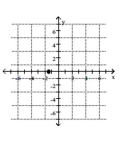
C)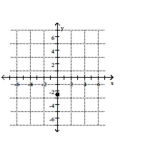
D)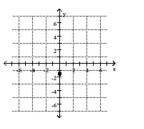
(-2.5, 0)
A)B)
C)
D)
Question
Plot the point
(3, 6)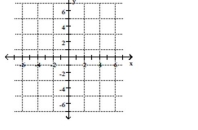
A)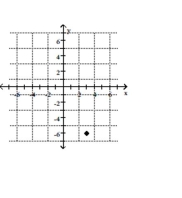
B)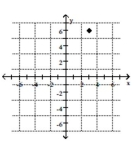
C)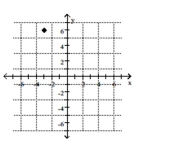
D)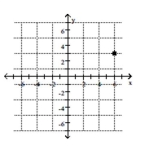
(3, 6)
A)
B)
C)
D)
Question
Question
Plot the point
(-2.5, 1.5)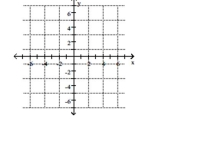
A)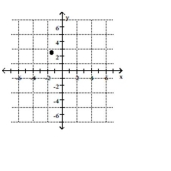
B)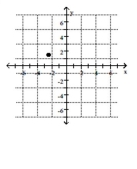
C)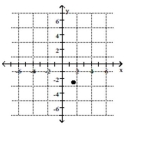
D)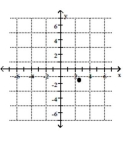 8
8
(-2.5, 1.5)
A)
B)
C)
D)
8 Question
Plot the point
(3, 0)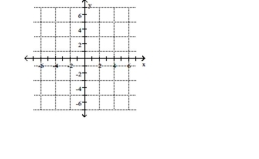
A)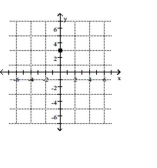
B)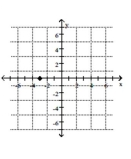
C)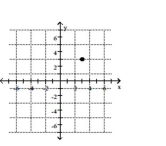
D)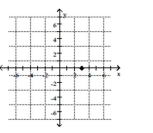
(3, 0)
A)
B)
C)
D)
Question
The map below has horizontal and vertical grid markers for ease of use. For example, Newport is located in grid A4. Use
the grid labels to indicate the location of the given city.
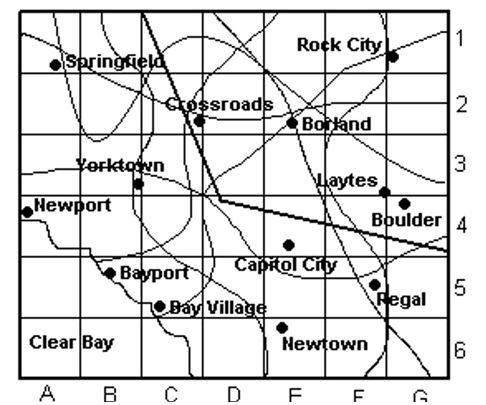
Springfield A)
B) A2
C)
D)
the grid labels to indicate the location of the given city.
Springfield A)
B) A2
C)
D)
Question
Complete the ordered pairs so that each is a solution of the linear equation. Then plot each solution and graph the
equation by connecting the points by a straight line.
A)
,
B)
C)
D)
,
16
equation by connecting the points by a straight line.
A)
,
B)
C)
D)
,
16
Question
The map below has horizontal and vertical grid markers for ease of use. For example, Newport is located in grid A4. Use
the grid labels to indicate the location of the given city.
Borland A) D5
В)
C)
D) EA
the grid labels to indicate the location of the given city.
Borland A) D5
В)
C)
D) EA
Question
Question
The map below has horizontal and vertical grid markers for ease of use. For example, Newport is located in grid A4. Use
the grid labels to indicate the location of the given city.
Regal A)
В)
(c) G6
D)
the grid labels to indicate the location of the given city.
Regal A)
В)
(c) G6
D)
Question
Question
The map below has horizontal and vertical grid markers for ease of use. For example, Newport is located in grid A4. Use
the grid labels to indicate the location of the given city.
Boulder A) G3
B) D7
C) 44
D)
the grid labels to indicate the location of the given city.
Boulder A) G3
B) D7
C) 44
D)
Question
Question
Question
The map below has horizontal and vertical grid markers for ease of use. For example, Newport is located in grid A4. Use
the grid labels to indicate the location of the given city.
Capitol City A) F2
B) E1
C)
D) E2
the grid labels to indicate the location of the given city.
Capitol City A) F2
B) E1
C)
D) E2
Question
Question
Question
Question
The map below has horizontal and vertical grid markers for ease of use. For example, Newport is located in grid A4. Use
the grid labels to indicate the location of the given city.
Bay Village A) B5
B) C6
C) C5
D)
the grid labels to indicate the location of the given city.
Bay Village A) B5
B) C6
C) C5
D)
Question
Question
The map below has horizontal and vertical grid markers for ease of use. For example, Newport is located in grid A4. Use
the grid labels to indicate the location of the given city.
Newtown A) F5
B) E6
C) G4
D)
the grid labels to indicate the location of the given city.
Newtown A) F5
B) E6
C) G4
D)
Question
The map below has horizontal and vertical grid markers for ease of use. For example, Newport is located in grid A4. Use
the grid labels to indicate the location of the given city.
Rock City A)
B)
C)
D)
the grid labels to indicate the location of the given city.
Rock City A)
B)
C)
D)
Question
The map below has horizontal and vertical grid markers for ease of use. For example, Newport is located in grid A4. Use
the grid labels to indicate the location of the given city.
Bayport A)
B) B5
C)
D)
the grid labels to indicate the location of the given city.
Bayport A)
B) B5
C)
D)
Question
Find the missing coordinate to complete the ordered pair.

A)
B)
C)
D)
A)
B)
C)
D)
Question
Question
Complete the ordered pairs so that each is a solution of the linear equation. Then plot each solution and graph the
equation by connecting the points by a straight line.
 A)
A)

B) ,
C)
,
D)
equation by connecting the points by a straight line.
A) B) ,
C)
,
D)
Question
Graph the equation by plotting three points and connecting them.
 A)
A)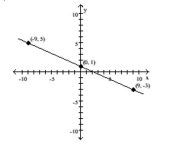
B)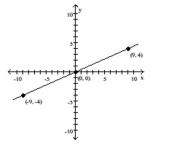
C)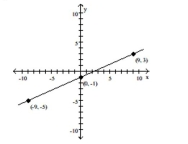
D)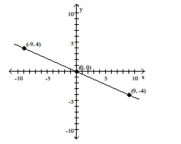
A)B)
C)
D)
Question
Solve.
As part of a charity bike-a-thon, friends have pledged Randall certain amounts of money per each mile that he bikes. To estimate how much money he will earn for the charity, he uses the formula A = 5.90m, where A is the
Amount in dollars of pledges earned and m is the number of miles Randall rides. Graph the equation for m = 0,
20, 40, and 60.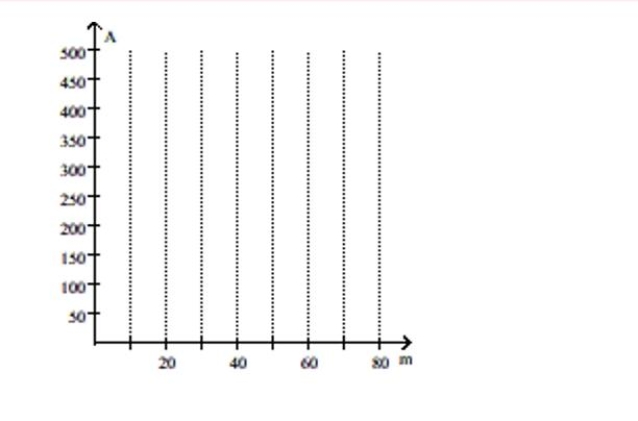 A)
A)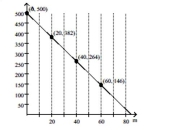
B)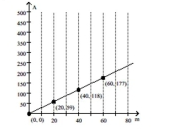
C)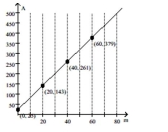
D)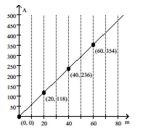
As part of a charity bike-a-thon, friends have pledged Randall certain amounts of money per each mile that he bikes. To estimate how much money he will earn for the charity, he uses the formula A = 5.90m, where A is the
Amount in dollars of pledges earned and m is the number of miles Randall rides. Graph the equation for m = 0,
20, 40, and 60.
A)B)
C)
D)
Question
Complete the ordered pairs so that each is a solution of the linear equation. Then plot each solution and graph the
equation by connecting the points by a straight line.
,
,
,
A)
B)
 C)
C)
D)
equation by connecting the points by a straight line.
,
,
,
A)
B)
C) D)
Question
Graph the equation.
 A)
A)
B)
C)
D)
A)B)
C)
D)
Question
Complete the ordered pairs so that each is a solution of the linear equation. Then plot each solution and graph the
equation by connecting the points by a straight line.
 A)
A)
B)
C)
D)
equation by connecting the points by a straight line.
A)B)
C)
D)
Question
Graph the equation.
 A)
A)
B)
C)
D)
A)B)
C)
D)
Question
Question
Graph the equation.
A)
B)
C)
D)
A)
B)
C)
D)
Question
Graph the equation by plotting the intercepts.
 A)
A)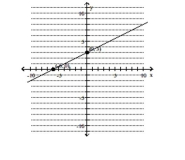
B)
C)
D)
A)B)
C)
D)
Question
Graph the equation by plotting the intercepts.
 A)
A)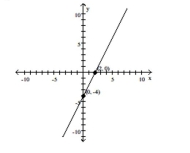
B)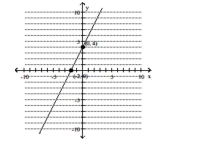
C)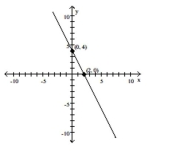
D)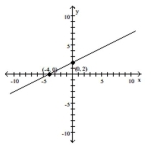
A)B)
C)
D)
Question
Graph the equation by plotting the intercepts.
 A)
A)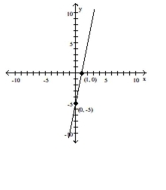
B)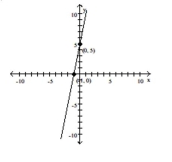
C)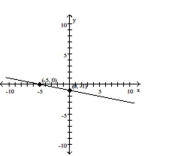
D)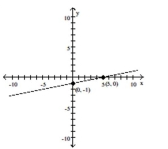
A)B)
C)
D)
Question
Graph the equation by plotting three points and connecting them.
 A)
A)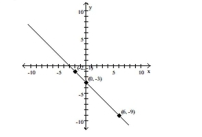
B)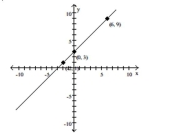
C)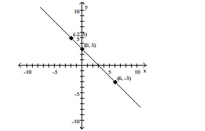
D)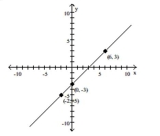
A)B)
C)
D)
Question
Question
Graph the equation by plotting the intercepts.
 A)
A)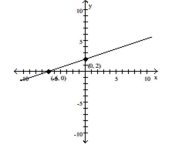
B)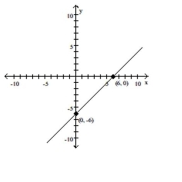
C)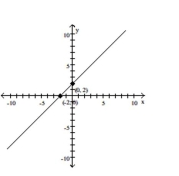 1
1
D)1ecb32e_817c_09ea_a9b7_7156727a66cc_TB6914_00
A)B)
C)
1D)1ecb32e_817c_09ea_a9b7_7156727a66cc_TB6914_00
Question
Graph the equation by plotting three points and connecting them.
 A)
A)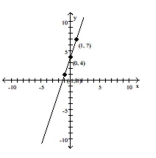
B)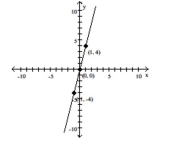
C)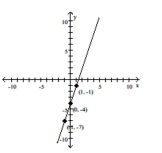
D)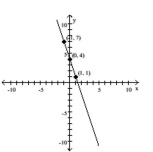
A)B)
C)
D)
Question
Question
Graph the equation by plotting three points and connecting them.
 A)
A)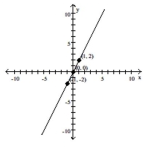
B)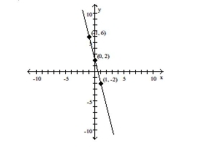
C)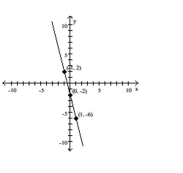
D)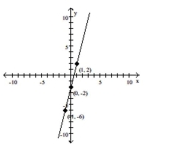
A)B)
C)
D)
Question
Graph the equation.
 A)
A)
B)
C)
D)
A)B)
C)
D)
Question
Graph the equation.
2y = 16 A)
A)
B)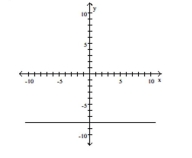
C)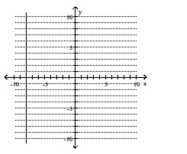
D)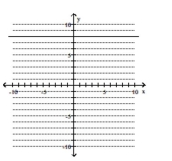
2y = 16
A)B)
C)
D)
Question
Graph the equation by plotting the intercepts.
A)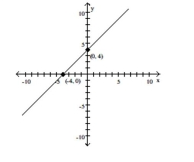
B)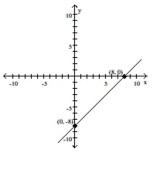
C)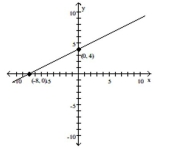
D)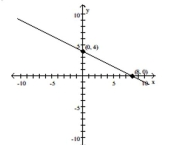
A)B)
C)
D)
Question
Solve.
The population of an endangered species living in a controlled habitat is given by the equation P = 7t + 49, where P is the population and t is the time in months since the population was moved to the habitat. Graph the
Equation for t = 0, 6, 12, and 18.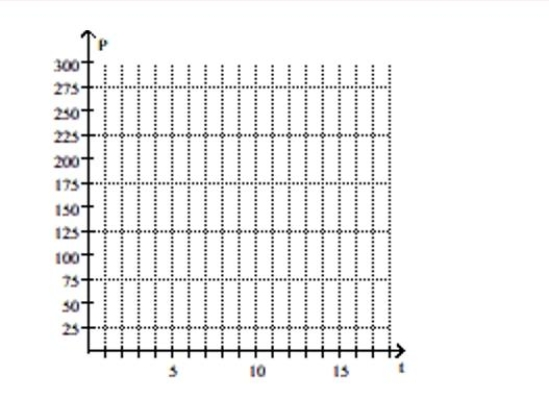 A)
A)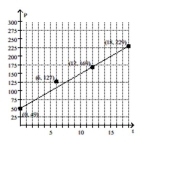
B)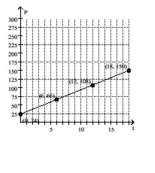
C)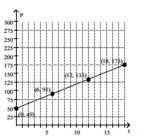
D)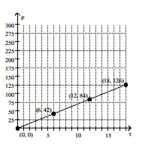
The population of an endangered species living in a controlled habitat is given by the equation P = 7t + 49, where P is the population and t is the time in months since the population was moved to the habitat. Graph the
Equation for t = 0, 6, 12, and 18.
A)B)
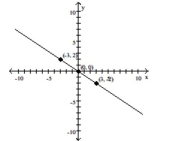
C)
D)
Question
Graph the equation by plotting the intercepts.
 A)
A)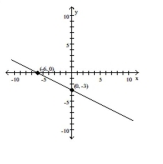
B)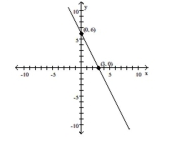
C)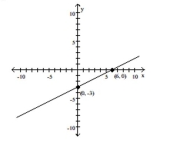
D)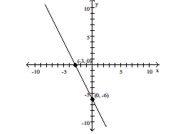
A)B)
C)
D)
Question
Question
Question
Question
Question
Graph the line y = mx + b for the given values.
A)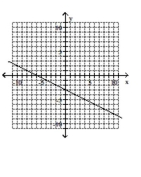
B)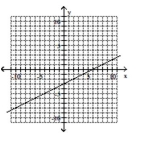
C)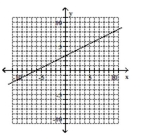
D)
A)
B)
C)
D)
Question
Question
Question
Question
Question
Question
Question
Question
Question
Question
Question
Question

Unlock Deck
Sign up to unlock the cards in this deck!
Unlock Deck
Unlock Deck
1/88
Play
Full screen (f)
Deck 3: Graphing and Functions
1
Consider the points plotted in the graph below.
Give the coordinates for point B.
A)(4, -3)
B)(-5, 4)
C)(3, 4)
D)(-3, 4)
Give the coordinates for point B.
A)(4, -3)
B)(-5, 4)
C)(3, 4)
D)(-3, 4)
D
2
Consider the points plotted in the graph below.
Give the coordinates for points G and H.
A)G: (0, -3), H: (-2, -2)
B)G: (-3, 0), H: (-2, -2)
C)G: (-3, 0), H: (-2, 2)
D)G: (0, -3), H: (-2, 2)
Give the coordinates for points G and H.
A)G: (0, -3), H: (-2, -2)
B)G: (-3, 0), H: (-2, -2)
C)G: (-3, 0), H: (-2, 2)
D)G: (0, -3), H: (-2, 2)
B
3
Consider the points plotted in the graph below.
Give the coordinates for points C and D.
A)C: (2, 0), D: (5, 3)
B)C: (2, 0), D: (3, 5)
C)C: (0, 2), D: (5, 3)
D)C: (0, 2), D: (3, 5)
Give the coordinates for points C and D.
A)C: (2, 0), D: (5, 3)
B)C: (2, 0), D: (3, 5)
C)C: (0, 2), D: (5, 3)
D)C: (0, 2), D: (3, 5)
D
4
Consider the points plotted in the graph below.
Give the coordinates for points I and J.
A)I: (5, 4), J: (0, -3)
B)I: (-4, -5), J: (-3, 0)
C)I: (5, 4), J: (-3, 0)
D)I: (-5, -4), J: (0, -3)
Give the coordinates for points I and J.
A)I: (5, 4), J: (0, -3)
B)I: (-4, -5), J: (-3, 0)
C)I: (5, 4), J: (-3, 0)
D)I: (-5, -4), J: (0, -3)
Unlock Deck
Unlock for access to all 88 flashcards in this deck.
Unlock Deck
k this deck
5
Consider the points plotted in the graph below.
Give the c oordinates for p oint M. A)
B)
C)
D)
Give the c oordinates for p oint M. A)
B)
C)
D)
Unlock Deck
Unlock for access to all 88 flashcards in this deck.
Unlock Deck
k this deck
6
Consider the points plotted in the graph below.
Give the coordinates for points E and F.
A)E: (4, 3), F: (0, 2)
B)E: (4, 3), F: (2, 0)
C)E: (3, 4), F: (2, 0)
D)E: (3, 4), F: (0, 2)
Give the coordinates for points E and F.
A)E: (4, 3), F: (0, 2)
B)E: (4, 3), F: (2, 0)
C)E: (3, 4), F: (2, 0)
D)E: (3, 4), F: (0, 2)
Unlock Deck
Unlock for access to all 88 flashcards in this deck.
Unlock Deck
k this deck
7
Plot the point
(2, -1) A)
B)
C)
D)
(2, -1)
A)B)
C)
D)
Unlock Deck
Unlock for access to all 88 flashcards in this deck.
Unlock Deck
k this deck
8
Plot the point
(-1.5, -3)
A)
B)
C)
D)
(-1.5, -3)
A)
B)
C)
D)
Unlock Deck
Unlock for access to all 88 flashcards in this deck.
Unlock Deck
k this deck
9
Consider the points plotted in the graph below.
Give the coordinates for point K.
A)(3, -4)
B)(4, 3)
C)(3, 4)
D)(-4, 3)
Give the coordinates for point K.
A)(3, -4)
B)(4, 3)
C)(3, 4)
D)(-4, 3)
Unlock Deck
Unlock for access to all 88 flashcards in this deck.
Unlock Deck
k this deck
10
Plot the point
(-1, -3)
A)
B) C)
D)
(-1, -3)
A)
B)
C)D)
Unlock Deck
Unlock for access to all 88 flashcards in this deck.
Unlock Deck
k this deck
11
Plot the point
(0, -2)
A)
B)
C)
D) 4
(0, -2)
A)
B)
C)
D)
4 Unlock Deck
Unlock for access to all 88 flashcards in this deck.
Unlock Deck
k this deck
12
Consider the points plotted in the graph below.
Give the coordinates for point A.
A)(-5, 4)
B)(4, 5)
C)(5, 4)
D)(4, -5)
Give the coordinates for point A.
A)(-5, 4)
B)(4, 5)
C)(5, 4)
D)(4, -5)
Unlock Deck
Unlock for access to all 88 flashcards in this deck.
Unlock Deck
k this deck
13
Plot the point
(-4, 1)
A)
B)
C )
D)
(-4, 1)
A)
B)
C )
D)
Unlock Deck
Unlock for access to all 88 flashcards in this deck.
Unlock Deck
k this deck
14
Plot the point
(0, -4.5)
A)
B) C)
D)
(0, -4.5)
A)
B)
C)D)
Unlock Deck
Unlock for access to all 88 flashcards in this deck.
Unlock Deck
k this deck
15
Consider the points plotted in the graph below.
Give the coordinates for point .
A)
B)
C)
D)
Give the coordinates for point .
A)
B)
C)
D)
Unlock Deck
Unlock for access to all 88 flashcards in this deck.
Unlock Deck
k this deck
16
Plot the point
(-2.5, 0) A)
B)
C)
D)
(-2.5, 0)
A)B)
C)
D)
Unlock Deck
Unlock for access to all 88 flashcards in this deck.
Unlock Deck
k this deck
17
Plot the point
(3, 6)
A)
B)
C)
D)
(3, 6)
A)
B)
C)
D)
Unlock Deck
Unlock for access to all 88 flashcards in this deck.
Unlock Deck
k this deck
18
Choose the one alternative that best completes the statement or answers the question.
Solve for y.
A)
B)
C)
D)
Solve for y.
A)
B)
C)
D)
Unlock Deck
Unlock for access to all 88 flashcards in this deck.
Unlock Deck
k this deck
19
Plot the point
(-2.5, 1.5)
A)
B)
C)
D) 8
(-2.5, 1.5)
A)
B)
C)
D)
8 Unlock Deck
Unlock for access to all 88 flashcards in this deck.
Unlock Deck
k this deck
20
Plot the point
(3, 0)
A)
B)
C)
D)
(3, 0)
A)
B)
C)
D)
Unlock Deck
Unlock for access to all 88 flashcards in this deck.
Unlock Deck
k this deck
21
The map below has horizontal and vertical grid markers for ease of use. For example, Newport is located in grid A4. Use
the grid labels to indicate the location of the given city.
Springfield A)
B) A2
C)
D)
the grid labels to indicate the location of the given city.
Springfield A)
B) A2
C)
D)
Unlock Deck
Unlock for access to all 88 flashcards in this deck.
Unlock Deck
k this deck
22
Complete the ordered pairs so that each is a solution of the linear equation. Then plot each solution and graph the
equation by connecting the points by a straight line.
A)
,
B)
C)
D)
,
16
equation by connecting the points by a straight line.
A)
,
B)
C)
D)
,
16
Unlock Deck
Unlock for access to all 88 flashcards in this deck.
Unlock Deck
k this deck
23
The map below has horizontal and vertical grid markers for ease of use. For example, Newport is located in grid A4. Use
the grid labels to indicate the location of the given city.
Borland A) D5
В)
C)
D) EA
the grid labels to indicate the location of the given city.
Borland A) D5
В)
C)
D) EA
Unlock Deck
Unlock for access to all 88 flashcards in this deck.
Unlock Deck
k this deck
24
Find the missing coordinate to complete the ordered pair.
A)
В)
C)
D)
A)
В)
C)
D)
Unlock Deck
Unlock for access to all 88 flashcards in this deck.
Unlock Deck
k this deck
25
The map below has horizontal and vertical grid markers for ease of use. For example, Newport is located in grid A4. Use
the grid labels to indicate the location of the given city.
Regal A)
В)
(c) G6
D)
the grid labels to indicate the location of the given city.
Regal A)
В)
(c) G6
D)
Unlock Deck
Unlock for access to all 88 flashcards in this deck.
Unlock Deck
k this deck
26
Find the missing coordinate to complete the ordered pair.
A)
В)
C)
D)
A)
В)
C)
D)
Unlock Deck
Unlock for access to all 88 flashcards in this deck.
Unlock Deck
k this deck
27
The map below has horizontal and vertical grid markers for ease of use. For example, Newport is located in grid A4. Use
the grid labels to indicate the location of the given city.
Boulder A) G3
B) D7
C) 44
D)
the grid labels to indicate the location of the given city.
Boulder A) G3
B) D7
C) 44
D)
Unlock Deck
Unlock for access to all 88 flashcards in this deck.
Unlock Deck
k this deck
28
Find the missing coordinate to complete the ordered pair.
A)
B)
C)
D)
A)
B)
C)
D)
Unlock Deck
Unlock for access to all 88 flashcards in this deck.
Unlock Deck
k this deck
29
Find the missing coordinate to complete the ordered pair.
A)
B)
C)
D)
A)
B)
C)
D)
Unlock Deck
Unlock for access to all 88 flashcards in this deck.
Unlock Deck
k this deck
30
The map below has horizontal and vertical grid markers for ease of use. For example, Newport is located in grid A4. Use
the grid labels to indicate the location of the given city.
Capitol City A) F2
B) E1
C)
D) E2
the grid labels to indicate the location of the given city.
Capitol City A) F2
B) E1
C)
D) E2
Unlock Deck
Unlock for access to all 88 flashcards in this deck.
Unlock Deck
k this deck
31
Choose the one alternative that best completes the statement or answers the question.
Solve for y.
A)
B)
C)
D)
Solve for y.
A)
B)
C)
D)
Unlock Deck
Unlock for access to all 88 flashcards in this deck.
Unlock Deck
k this deck
32
Find the missing coordinate to complete the ordered pair.
A) , )
B)
C)
D)
A) , )
B)
C)
D)
Unlock Deck
Unlock for access to all 88 flashcards in this deck.
Unlock Deck
k this deck
33
Choose the one alternative that best completes the statement or answers the question.
Solve for y.
A)
B)
C)
D)
Solve for y.
A)
B)
C)
D)
Unlock Deck
Unlock for access to all 88 flashcards in this deck.
Unlock Deck
k this deck
34
The map below has horizontal and vertical grid markers for ease of use. For example, Newport is located in grid A4. Use
the grid labels to indicate the location of the given city.
Bay Village A) B5
B) C6
C) C5
D)
the grid labels to indicate the location of the given city.
Bay Village A) B5
B) C6
C) C5
D)
Unlock Deck
Unlock for access to all 88 flashcards in this deck.
Unlock Deck
k this deck
35
Find the missing coordinate to complete the ordered pair.
A)
B)
C)
D)
A)
B)
C)
D)
Unlock Deck
Unlock for access to all 88 flashcards in this deck.
Unlock Deck
k this deck
36
The map below has horizontal and vertical grid markers for ease of use. For example, Newport is located in grid A4. Use
the grid labels to indicate the location of the given city.
Newtown A) F5
B) E6
C) G4
D)
the grid labels to indicate the location of the given city.
Newtown A) F5
B) E6
C) G4
D)
Unlock Deck
Unlock for access to all 88 flashcards in this deck.
Unlock Deck
k this deck
37
The map below has horizontal and vertical grid markers for ease of use. For example, Newport is located in grid A4. Use
the grid labels to indicate the location of the given city.
Rock City A)
B)
C)
D)
the grid labels to indicate the location of the given city.
Rock City A)
B)
C)
D)
Unlock Deck
Unlock for access to all 88 flashcards in this deck.
Unlock Deck
k this deck
38
The map below has horizontal and vertical grid markers for ease of use. For example, Newport is located in grid A4. Use
the grid labels to indicate the location of the given city.
Bayport A)
B) B5
C)
D)
the grid labels to indicate the location of the given city.
Bayport A)
B) B5
C)
D)
Unlock Deck
Unlock for access to all 88 flashcards in this deck.
Unlock Deck
k this deck
39
Find the missing coordinate to complete the ordered pair.
A)
B)
C)
D)
A)
B)
C)
D)
Unlock Deck
Unlock for access to all 88 flashcards in this deck.
Unlock Deck
k this deck
40
Find the missing coordinate to complete the ordered pair.
A)
В)
C)
D)
A)
В)
C)
D)
Unlock Deck
Unlock for access to all 88 flashcards in this deck.
Unlock Deck
k this deck
40
Complete the ordered pairs so that each is a solution of the linear equation. Then plot each solution and graph the
equation by connecting the points by a straight line.
A)
B) ,
C)
,
D)
equation by connecting the points by a straight line.
A) B) ,
C)
,
D)
Unlock Deck
Unlock for access to all 88 flashcards in this deck.
Unlock Deck
k this deck
41
Graph the equation by plotting three points and connecting them.
A)
B)
C)
D)
A)B)
C)
D)
Unlock Deck
Unlock for access to all 88 flashcards in this deck.
Unlock Deck
k this deck
42
Solve.
As part of a charity bike-a-thon, friends have pledged Randall certain amounts of money per each mile that he bikes. To estimate how much money he will earn for the charity, he uses the formula A = 5.90m, where A is the
Amount in dollars of pledges earned and m is the number of miles Randall rides. Graph the equation for m = 0,
20, 40, and 60. A)
B)
C)
D)
As part of a charity bike-a-thon, friends have pledged Randall certain amounts of money per each mile that he bikes. To estimate how much money he will earn for the charity, he uses the formula A = 5.90m, where A is the
Amount in dollars of pledges earned and m is the number of miles Randall rides. Graph the equation for m = 0,
20, 40, and 60.
A)B)
C)
D)
Unlock Deck
Unlock for access to all 88 flashcards in this deck.
Unlock Deck
k this deck
42
Complete the ordered pairs so that each is a solution of the linear equation. Then plot each solution and graph the
equation by connecting the points by a straight line.
,
,
,
A)
B)
C)
D)
equation by connecting the points by a straight line.
,
,
,
A)
B)
C) D)
Unlock Deck
Unlock for access to all 88 flashcards in this deck.
Unlock Deck
k this deck
43
Graph the equation.
A)
B)
C)
D)
A)B)
C)
D)
Unlock Deck
Unlock for access to all 88 flashcards in this deck.
Unlock Deck
k this deck
43
Complete the ordered pairs so that each is a solution of the linear equation. Then plot each solution and graph the
equation by connecting the points by a straight line.
A)
B)
C)
D)
equation by connecting the points by a straight line.
A)B)
C)
D)
Unlock Deck
Unlock for access to all 88 flashcards in this deck.
Unlock Deck
k this deck
44
Graph the equation.
A)
B)
C)
D)
A)B)
C)
D)
Unlock Deck
Unlock for access to all 88 flashcards in this deck.
Unlock Deck
k this deck
45
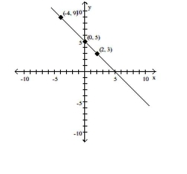
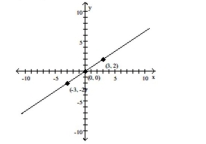
Find the slope of a straight line that passes through the given pair of points.
(1, 2)and (3, 5) A)
B)
C)
D)
(1, 2)and (3, 5) A)
B)
C)
D)
Unlock Deck
Unlock for access to all 88 flashcards in this deck.
Unlock Deck
k this deck
46
Graph the equation.
A)
B)
C)
D)
A)
B)
C)
D)
Unlock Deck
Unlock for access to all 88 flashcards in this deck.
Unlock Deck
k this deck
47
Graph the equation by plotting the intercepts.
A)
B)
C)
D)
A)B)
C)
D)
Unlock Deck
Unlock for access to all 88 flashcards in this deck.
Unlock Deck
k this deck
48
Graph the equation by plotting the intercepts.
A)
B)
C)
D)
A)B)
C)
D)
Unlock Deck
Unlock for access to all 88 flashcards in this deck.
Unlock Deck
k this deck
49
Graph the equation by plotting the intercepts.
A)
B)
C)
D)
A)B)
C)
D)
Unlock Deck
Unlock for access to all 88 flashcards in this deck.
Unlock Deck
k this deck
50
Graph the equation by plotting three points and connecting them.
A)
B)
C)
D)
A)B)
C)
D)
Unlock Deck
Unlock for access to all 88 flashcards in this deck.
Unlock Deck
k this deck
51
Find the slope of a straight line that passes through the given pair of points.
and
A)
B)
C) ــــــــــــ
D)
and
A)
B)
C) ــــــــــــ
D)
Unlock Deck
Unlock for access to all 88 flashcards in this deck.
Unlock Deck
k this deck
52
Graph the equation by plotting the intercepts.
A)
B)
C)1
D)1ecb32e_817c_09ea_a9b7_7156727a66cc_TB6914_00
A)B)
C)
1D)1ecb32e_817c_09ea_a9b7_7156727a66cc_TB6914_00
Unlock Deck
Unlock for access to all 88 flashcards in this deck.
Unlock Deck
k this deck
53
Graph the equation by plotting three points and connecting them.
A)
B)
C)
D)
A)B)
C)
D)
Unlock Deck
Unlock for access to all 88 flashcards in this deck.
Unlock Deck
k this deck
54
Find the slope of a straight line that passes through the given pair of points.
and
A)
B) 9
C)
D)
and
A)
B) 9
C)
D)
Unlock Deck
Unlock for access to all 88 flashcards in this deck.
Unlock Deck
k this deck
55
Graph the equation by plotting three points and connecting them.
A)
B)
C)
D)
A)B)
C)
D)
Unlock Deck
Unlock for access to all 88 flashcards in this deck.
Unlock Deck
k this deck
56
Graph the equation.
A)
B)
C)
D)
A)B)
C)
D)
Unlock Deck
Unlock for access to all 88 flashcards in this deck.
Unlock Deck
k this deck
57
Graph the equation.
2y = 16 A)
B)
C)
D)
2y = 16
A)B)
C)
D)
Unlock Deck
Unlock for access to all 88 flashcards in this deck.
Unlock Deck
k this deck
58
Graph the equation by plotting the intercepts.
A)
B)
C)
D)
A)B)
C)
D)
Unlock Deck
Unlock for access to all 88 flashcards in this deck.
Unlock Deck
k this deck
59
Solve.
The population of an endangered species living in a controlled habitat is given by the equation P = 7t + 49, where P is the population and t is the time in months since the population was moved to the habitat. Graph the
Equation for t = 0, 6, 12, and 18. A)
B)
C)
D)
The population of an endangered species living in a controlled habitat is given by the equation P = 7t + 49, where P is the population and t is the time in months since the population was moved to the habitat. Graph the
Equation for t = 0, 6, 12, and 18.
A)B)
C)
D)
Unlock Deck
Unlock for access to all 88 flashcards in this deck.
Unlock Deck
k this deck
60
Graph the equation by plotting the intercepts.
A)
B)
C)
D)
A)B)
C)
D)
Unlock Deck
Unlock for access to all 88 flashcards in this deck.
Unlock Deck
k this deck
61
Find the slope and the y-intercept
A)
B)
D)
A)
B)
D)
Unlock Deck
Unlock for access to all 88 flashcards in this deck.
Unlock Deck
k this deck
62
Write the equation of the line in slope-intercept form.
-intercept
A)
B)
C)
D)
-intercept
A)
B)
C)
D)
Unlock Deck
Unlock for access to all 88 flashcards in this deck.
Unlock Deck
k this deck
63
Find the slope and the y-intercept
y = 9x + 3 A)
B)
C)
D)
y = 9x + 3 A)
B)
C)
D)
Unlock Deck
Unlock for access to all 88 flashcards in this deck.
Unlock Deck
k this deck
64
Write the equation of the line in slope-intercept form.
A)
B)
C)
D)
A)
B)
C)
D)
Unlock Deck
Unlock for access to all 88 flashcards in this deck.
Unlock Deck
k this deck
65
Graph the line y = mx + b for the given values.
A)
B)
C)
D)
A)
B)
C)
D)
Unlock Deck
Unlock for access to all 88 flashcards in this deck.
Unlock Deck
k this deck
66
Find the slope and the y-intercept
A) , )
B)
C)
D)
A) , )
B)
C)
D)
Unlock Deck
Unlock for access to all 88 flashcards in this deck.
Unlock Deck
k this deck
67
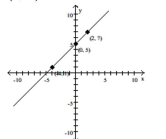
Find the slope of a straight line that passes through the given pair of points.
(4, -2)and (3, 9)
A)-1
B)11
C)0
D)-11
(4, -2)and (3, 9)
A)-1
B)11
C)0
D)-11
Unlock Deck
Unlock for access to all 88 flashcards in this deck.
Unlock Deck
k this deck
68
Write the equation of the line in slope-intercept form.
-intercept
A)
B)
C)
D)
-intercept
A)
B)
C)
D)
Unlock Deck
Unlock for access to all 88 flashcards in this deck.
Unlock Deck
k this deck
69
Find the slope and the y-intercept
A)
B)
C)
D)
A)
B)
C)
D)
Unlock Deck
Unlock for access to all 88 flashcards in this deck.
Unlock Deck
k this deck
70
Find the slope of a straight line that passes through the given pair of points.
and
A)
B) 15
C)
D)
and
A)
B) 15
C)
D)
Unlock Deck
Unlock for access to all 88 flashcards in this deck.
Unlock Deck
k this deck
71
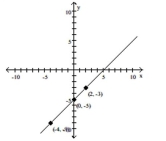
Find the slope of a straight line that passes through the given pair of points.
and
A)
B)
C)
D)
and
A)
B)
C)
D)
Unlock Deck
Unlock for access to all 88 flashcards in this deck.
Unlock Deck
k this deck
72
Find the slope and the y-intercept
y = 6
A)m = 0; (0, 6)
B)m = 0; no y-intercept
C)m = 6; (0, 0)
D)m = 1; (0, 6)
y = 6
A)m = 0; (0, 6)
B)m = 0; no y-intercept
C)m = 6; (0, 0)
D)m = 1; (0, 6)
Unlock Deck
Unlock for access to all 88 flashcards in this deck.
Unlock Deck
k this deck
73
Find the slope and the y-intercept
x + y = 12
A)m = -1; (0, 12)
B)m = 0; (0, 12)
C)m = -1; (0, -12)
D)m = 1; (0, 12)
x + y = 12
A)m = -1; (0, 12)
B)m = 0; (0, 12)
C)m = -1; (0, -12)
D)m = 1; (0, 12)
Unlock Deck
Unlock for access to all 88 flashcards in this deck.
Unlock Deck
k this deck
74
Find the slope and the y-intercept
7x - 8y = 56 A)
B)
C)
D)
7x - 8y = 56 A)
B)
C)
D)
Unlock Deck
Unlock for access to all 88 flashcards in this deck.
Unlock Deck
k this deck
75
Find the slope and the y-intercept
A)
B)
C)
D)
A)
B)
C)
D)
Unlock Deck
Unlock for access to all 88 flashcards in this deck.
Unlock Deck
k this deck
76
Find the slope of a straight line that passes through the given pair of points.
(-5, -5)and (2, -5)
A)-2
B)1
C)2
D)0
(-5, -5)and (2, -5)
A)-2
B)1
C)2
D)0
Unlock Deck
Unlock for access to all 88 flashcards in this deck.
Unlock Deck
k this deck
77
Find the slope and the y-intercept
10x + y = -8 A)
B)
C)
D)
10x + y = -8 A)
B)
C)
D)
Unlock Deck
Unlock for access to all 88 flashcards in this deck.
Unlock Deck
k this deck
Unlock Deck
Unlock for access to all 88 flashcards in this deck.


