Deck 7: Confidence Intervals
Full screen (f)
Question
Find the shaded area under the standard normal curve. ) 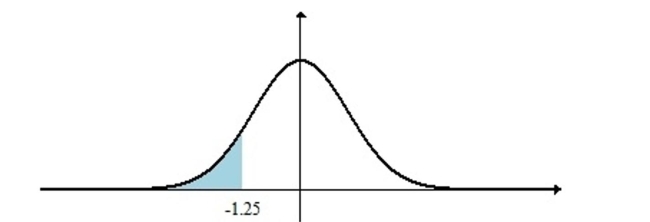
A)0.8944
B)0.1056
C)0.3944
D)0.0528
A)0.8944
B)0.1056
C)0.3944
D)0.0528
Question
Question
Find 
A) 1.44
B) 1.34
C) 1.08
D) 1.51
A) 1.44
B) 1.34
C) 1.08
D) 1.51
Question
The following figure is a probability density curve that represents the lifetime,) 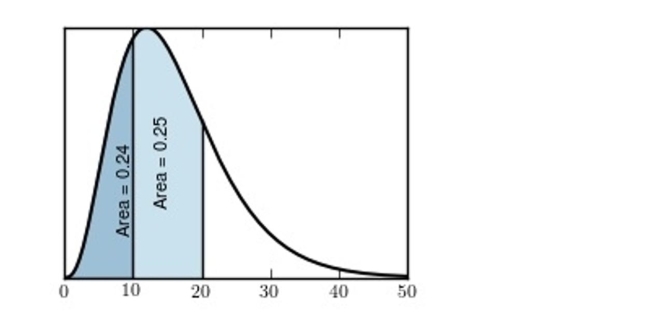 Find the proportion of batteries with lifetimes less than 20 months.
A)0.24
B)0.25
C)0.75
D)0.49
Find the proportion of batteries with lifetimes less than 20 months.A)0.24
B)0.25
C)0.75
D)0.49
Question
Find the shaded area under the standard normal curve. ) 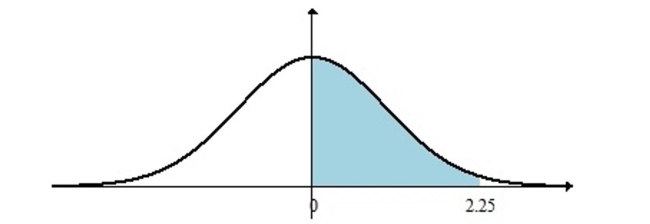
A)0.5122
B)0.9878
C)0.4878
D)0.2439
A)0.5122
B)0.9878
C)0.4878
D)0.2439
Question
A normal population has a mean  and standard deviation
  What is the 86 th percentile of the population?
A) 10.94
B) 9.73
C) 13.38
D) 12.16
and standard deviation What is the 86 th percentile of the population?A) 10.94
B) 9.73
C) 13.38
D) 12.16
Question
The following figure is a probability density curve that represents the lifetime, in months, of a 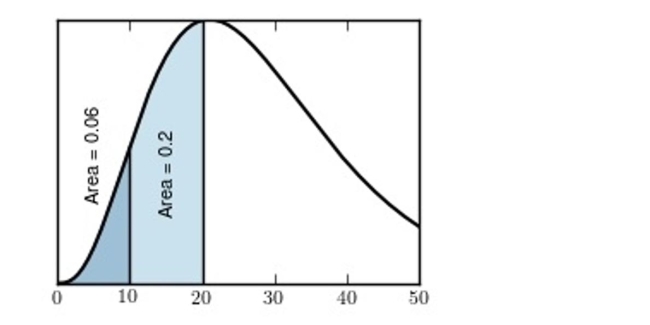 Find the proportion of batteries with lifetimes between 10 and 20 months.
A)0.74
B)0.06
C)0.26
D)0.20
Find the proportion of batteries with lifetimes between 10 and 20 months.A)0.74
B)0.06
C)0.26
D)0.20
Question
Question
Question
Question
Question
Question
A normal population has a mean  and standard deviation
  What proportion of the population is between 26 and 31 ?
A) 0.2138
B) 0.7862
C) 0.4562
D) 0.6700
and standard deviation What proportion of the population is between 26 and 31 ?A) 0.2138
B) 0.7862
C) 0.4562
D) 0.6700
Question
Find the shaded area under the standard normal curve. ) 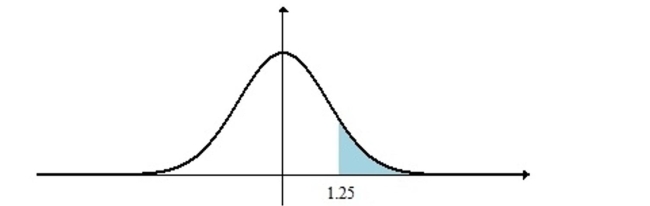
A)0.0528
B)0.3944
C)0.1056
D)0.8944
A)0.0528
B)0.3944
C)0.1056
D)0.8944
Question
A normal population has a mean  and standard deviation
  What proportion of the population is less than 41 ?
A) 0.8106
B) 1.0000
C) 0.2611
D) 0.7389
and standard deviation What proportion of the population is less than 41 ?A) 0.8106
B) 1.0000
C) 0.2611
D) 0.7389
Question
The following figure is a probability density curve that represents the lifetime,) 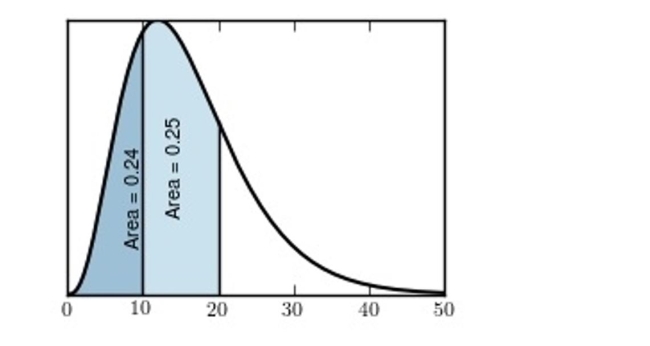 What is the probability that a randomly chosen battery lasts longer than 20 months?
A)0.49
B)0.24
C)0.25
D)0.51
What is the probability that a randomly chosen battery lasts longer than 20 months?A)0.49
B)0.24
C)0.25
D)0.51
Question
Question
A normal population has a mean  and standard deviation
  What is the probability that a randomly chosen value will be greater than 31 ?
A) 0.4443
B) 0.7881
C) 0.5557
D) 0.7580
and standard deviation What is the probability that a randomly chosen value will be greater than 31 ? A) 0.4443
B) 0.7881
C) 0.5557
D) 0.7580
Question
Question
Find the shaded area under the standard normal curve. ) 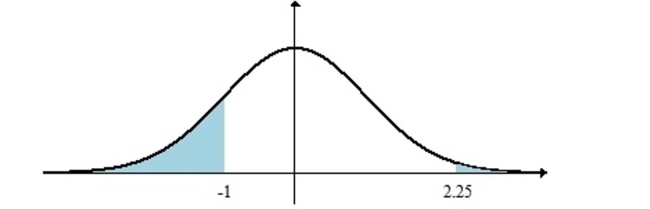
A)0.4878
B)0.8291
C)0.1709
D)0.0854
A)0.4878
B)0.8291
C)0.1709
D)0.0854
Question
Question
Question
Use the Central Limit Theorem to find the indicated probability. The sample size is n , the population proportion is  , and the sample proportion is
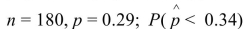
A) 0.9463
B) 0.9525
C) 0.9306
D) 0.9474
, and the sample proportion isA) 0.9463
B) 0.9525
C) 0.9306
D) 0.9474
Question
Question
For a particular diamond mine, 76% of the diamonds fail to qualify as "gemstone grade". A random sample of 96 diamonds is analysed. Find the mean 
A) 0.044
B) 0.24
C) 0.96
D) 0.76
A) 0.044
B) 0.24
C) 0.96
D) 0.76
Question
Question
Question
A sample of size 39 will be drawn from a population with mean 26 and standard deviation 14. Find the probability that  will be less than 29 .
A) 0.8925
B) 0.0901
C) 0.9099
D) 0.8770
will be less than 29 . A) 0.8925
B) 0.0901
C) 0.9099
D) 0.8770
Question
A sample of size 70 will be drawn from a population with mean 24 and standard deviation 10. Find the probability that  will be between 22 and 25 .
A) 0.7521
B) 0.0475
C) 0.7326
D) 0.2005
will be between 22 and 25 .A) 0.7521
B) 0.0475
C) 0.7326
D) 0.2005
Question
Use the Central Limit Theorem to find the indicated probability. The sample size is n , the population proportion is  , and the sample proportion is

A) 0.0749
B) 0.1251
C) 0.9251
D) 0.8000
, and the sample proportion isA) 0.0749
B) 0.1251
C) 0.9251
D) 0.8000
Question
Question
Question
Question
Use the Central Limit Theorem to find the indicated probability. The sample size is n , the population proportion is  , and the sample proportion is
A) 0.6103
B) 0.3483
C) 0.3300
D) 0.3897
, and the sample proportion isA) 0.6103
B) 0.3483
C) 0.3300
D) 0.3897
Question
A sample of size 42 will be drawn from a population with mean 34 and standard deviation 8. Find the probability that  will be greater than 36 .
A) 0.0526
B) 0.9474
C) 0.0749
D) 0.0351
will be greater than 36 .A) 0.0526
B) 0.9474
C) 0.0749
D) 0.0351
Question
A sample of size 40 will be drawn from a population with mean 98 and standard deviation 24. Find the 21st percentile of 
A) 90.8
B) 91.4
C) 93.8
D) 94.9
A) 90.8
B) 91.4
C) 93.8
D) 94.9
Question
Question
Question
Question
Question
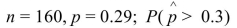
Use the normal approximation to find the indicated probability. The sample size is n , the population proportion of successes is p , and X is the number of successes in the sample. 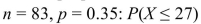
A) 0.3936
B) 0.3446
C) 0.6406
D) 0.3594
A) 0.3936
B) 0.3446
C) 0.6406
D) 0.3594
Question
Question
Question
At a cell phone assembly plant, 77% of the cell phone keypads pass inspection. A random sample of 98 keypads is analysed. Find the mean 
A) 0.23
B) 0.77
C) 0.96
D) 0.043
A) 0.23
B) 0.77
C) 0.96
D) 0.043
Question
Question
Question
Use the normal approximation to find the indicated probability. The sample size is n , the population proportion of successes is p , and X is the number of successes in the sample. 
A) 0.6330
B) 0.1251
C) 0.7580
D) 0.2420
A) 0.6330
B) 0.1251
C) 0.7580
D) 0.2420
Question
Question
Question
Use the normal approximation to find the indicated probability. The sample size is n , the population proportion of successes is p , and X is the number of successes in the sample. 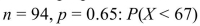
A) 0.1210
B) 0.8888
C) 0.8621
D) 0.8790
A) 0.1210
B) 0.8888
C) 0.8621
D) 0.8790
Question
Question
A public relations firm found that only 88% of voters in a certain state are satisfied with their state representative. How large a sample of voters should be drawn so that the sample proportion  of voters who are satisfied with their representative is approximately normally distributed?
A) 101
B) 12
C) 84
D) 10
of voters who are satisfied with their representative is approximately normally distributed?A) 101
B) 12
C) 84
D) 10
Question
Use the normal approximation to find the indicated probability. The sample size is n , the population proportion of successes is p , and X is the number of successes in the sample.

A) 0.6179
B) 0.0375
C) 0.5804
D) 0.3821
A) 0.6179
B) 0.0375
C) 0.5804
D) 0.3821
Question
For a particular diamond mine, 80% of the diamonds fail to qualify as "gemstone grade". A random sample of 113 diamonds is analysed. Find the mean 
A) 0.20
B) 0.96
C) 0.80
D) 0.038
A) 0.20
B) 0.96
C) 0.80
D) 0.038
Question
Question
Use the normal approximation to find the indicated probability. The sample size is n , the population proportion of successes is  , and X is the number of successes in the sample.
ppp
A) 0.7611
B) 0.2743
C) 0.7517
D) 0.7257
, and X is the number of successes in the sample.ppp
A) 0.7611
B) 0.2743
C) 0.7517
D) 0.7257
Question
Question
Use the normal approximation to find the indicated probability. The sample size is n , the population proportion of successes is p , and X is the number of successes in the sample. 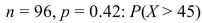
A) 0.1423
B) 0.1611
C) 0.1292
D) 0.8708
A) 0.1423
B) 0.1611
C) 0.1292
D) 0.8708
Question
A public relations firm found that only 9 % of voters in a certain state are satisfied with their U.S. senators. How large a sample of voters should be drawn so that the sample proportion  of voters who are satisfied with their senators is approximately normally distributed?
A) 11
B) 10
C) 125
D) 112
of voters who are satisfied with their senators is approximately normally distributed?A) 11
B) 10
C) 125
D) 112
Question
At a cell phone assembly plant, 80 % of the cell phone keypads pass inspection. A random sample of 116 keypads is analysed. Find the mean 
A) 0.80
B) 0.20
C) 0.037
D) 0.96
A) 0.80
B) 0.20
C) 0.037
D) 0.96
Question
The following stem-and-leaf plots each illustrate a sample. ) 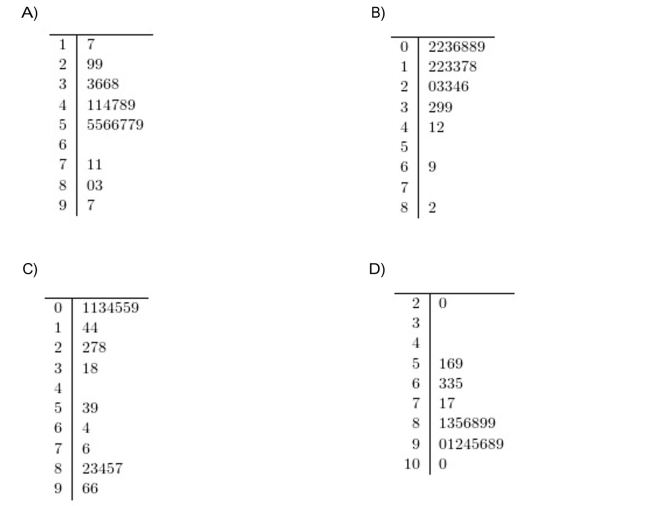
Question
The following boxplots each illustrate a sample. ) 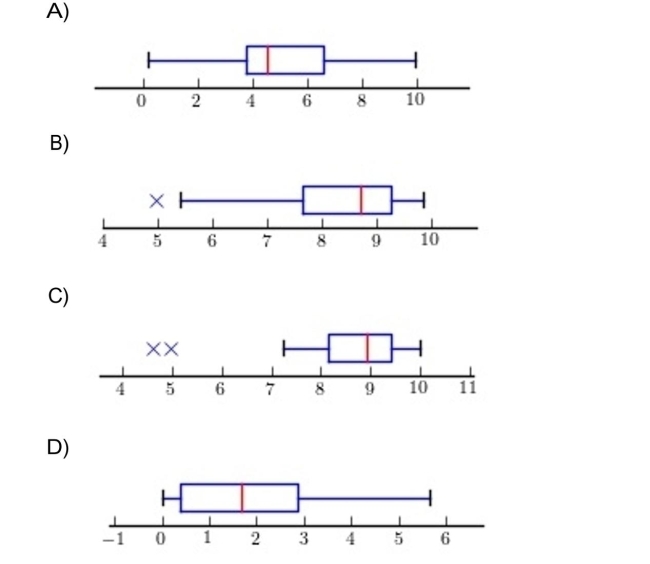
Question
The following dotplots each illustrate a sample. ) 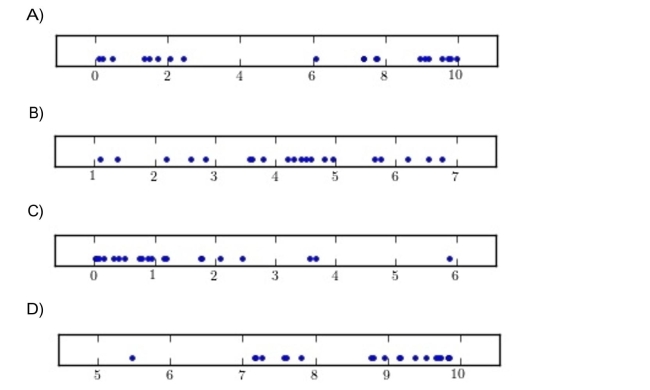
Question
Question
The following histograms each illustrate a sample. ) 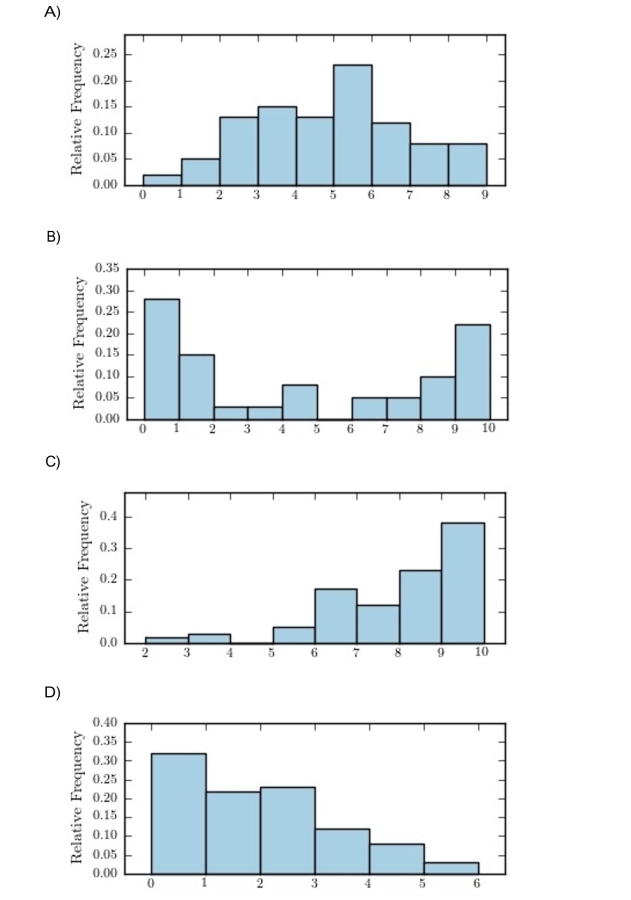

Unlock Deck
Sign up to unlock the cards in this deck!
Unlock Deck
Unlock Deck
1/65
Play
Full screen (f)
Deck 7: Confidence Intervals
1
Find the shaded area under the standard normal curve. )
A)0.8944
B)0.1056
C)0.3944
D)0.0528
A)0.8944
B)0.1056
C)0.3944
D)0.0528
B
2
Find the z-scores that bound the middle 74% of the area under the standard normal curve.
A)-1.13, 1.13
B)-1.24, 1.24
C)-0.99, 0.99
D)-1.07, 1.07
A)-1.13, 1.13
B)-1.24, 1.24
C)-0.99, 0.99
D)-1.07, 1.07
A
3
Find
A) 1.44
B) 1.34
C) 1.08
D) 1.51
A) 1.44
B) 1.34
C) 1.08
D) 1.51
1.44
4
The following figure is a probability density curve that represents the lifetime,) Find the proportion of batteries with lifetimes less than 20 months.
A)0.24
B)0.25
C)0.75
D)0.49
Find the proportion of batteries with lifetimes less than 20 months.A)0.24
B)0.25
C)0.75
D)0.49
Unlock Deck
Unlock for access to all 65 flashcards in this deck.
Unlock Deck
k this deck
5
Find the shaded area under the standard normal curve. )
A)0.5122
B)0.9878
C)0.4878
D)0.2439
A)0.5122
B)0.9878
C)0.4878
D)0.2439
Unlock Deck
Unlock for access to all 65 flashcards in this deck.
Unlock Deck
k this deck
6
A normal population has a mean and standard deviation What is the 86 th percentile of the population?
A) 10.94
B) 9.73
C) 13.38
D) 12.16
and standard deviation What is the 86 th percentile of the population?A) 10.94
B) 9.73
C) 13.38
D) 12.16
Unlock Deck
Unlock for access to all 65 flashcards in this deck.
Unlock Deck
k this deck
7
The following figure is a probability density curve that represents the lifetime, in months, of a Find the proportion of batteries with lifetimes between 10 and 20 months.
A)0.74
B)0.06
C)0.26
D)0.20
Find the proportion of batteries with lifetimes between 10 and 20 months.A)0.74
B)0.06
C)0.26
D)0.20
Unlock Deck
Unlock for access to all 65 flashcards in this deck.
Unlock Deck
k this deck
8
Find the area under the standard normal curve that lies outside the interval betweenz = -2.2 and z = -1.3.
A)0.4032
B)0.9171
C)0.0829
D)0.5968
A)0.4032
B)0.9171
C)0.0829
D)0.5968
Unlock Deck
Unlock for access to all 65 flashcards in this deck.
Unlock Deck
k this deck
9
Find the area under the standard normal curve to the left of z = -0.7.
A)0.7580
B)0.2580
C)0.1210
D)0.2420
A)0.7580
B)0.2580
C)0.1210
D)0.2420
Unlock Deck
Unlock for access to all 65 flashcards in this deck.
Unlock Deck
k this deck
10
Find the z-score for which the area to the left is 0.79.
A)1.04
B)0.58
C)0.64
D)0.81
A)1.04
B)0.58
C)0.64
D)0.81
Unlock Deck
Unlock for access to all 65 flashcards in this deck.
Unlock Deck
k this deck
11
Find the z-score for which the area to the right is 0.07.
A)1.59
B)1.35
C)1.48
D)1.74
A)1.59
B)1.35
C)1.48
D)1.74
Unlock Deck
Unlock for access to all 65 flashcards in this deck.
Unlock Deck
k this deck
12
Find the area under the standard normal curve to the right of z = 1.6.
A)0.0548
B)0.4452
C)0.0274
D)0.9452
A)0.0548
B)0.4452
C)0.0274
D)0.9452
Unlock Deck
Unlock for access to all 65 flashcards in this deck.
Unlock Deck
k this deck
13
A normal population has a mean and standard deviation What proportion of the population is between 26 and 31 ?
A) 0.2138
B) 0.7862
C) 0.4562
D) 0.6700
and standard deviation What proportion of the population is between 26 and 31 ?A) 0.2138
B) 0.7862
C) 0.4562
D) 0.6700
Unlock Deck
Unlock for access to all 65 flashcards in this deck.
Unlock Deck
k this deck
14
Find the shaded area under the standard normal curve. )
A)0.0528
B)0.3944
C)0.1056
D)0.8944
A)0.0528
B)0.3944
C)0.1056
D)0.8944
Unlock Deck
Unlock for access to all 65 flashcards in this deck.
Unlock Deck
k this deck
15
A normal population has a mean and standard deviation What proportion of the population is less than 41 ?
A) 0.8106
B) 1.0000
C) 0.2611
D) 0.7389
and standard deviation What proportion of the population is less than 41 ?A) 0.8106
B) 1.0000
C) 0.2611
D) 0.7389
Unlock Deck
Unlock for access to all 65 flashcards in this deck.
Unlock Deck
k this deck
16
The following figure is a probability density curve that represents the lifetime,) What is the probability that a randomly chosen battery lasts longer than 20 months?
A)0.49
B)0.24
C)0.25
D)0.51
What is the probability that a randomly chosen battery lasts longer than 20 months?A)0.49
B)0.24
C)0.25
D)0.51
Unlock Deck
Unlock for access to all 65 flashcards in this deck.
Unlock Deck
k this deck
17
Find the area under the standard normal curve that lies between z = 1.8 and z = 2.
A)0.0132
B)0.4772
C)0.5228
D)0.9868
A)0.0132
B)0.4772
C)0.5228
D)0.9868
Unlock Deck
Unlock for access to all 65 flashcards in this deck.
Unlock Deck
k this deck
18
A normal population has a mean and standard deviation What is the probability that a randomly chosen value will be greater than 31 ?
A) 0.4443
B) 0.7881
C) 0.5557
D) 0.7580
and standard deviation What is the probability that a randomly chosen value will be greater than 31 ? A) 0.4443
B) 0.7881
C) 0.5557
D) 0.7580
Unlock Deck
Unlock for access to all 65 flashcards in this deck.
Unlock Deck
k this deck
19
A bottler of drinking water fills plastic bottles with a mean volume of 999 milliliters(mL)and standard deviation 4 mL. The fill volumes are normally distributed. Whatproportion of bottles have volumes greater than 994 mL?
A)1.0000
B)0.8944
C)0.9599
D)0.8925
A)1.0000
B)0.8944
C)0.9599
D)0.8925
Unlock Deck
Unlock for access to all 65 flashcards in this deck.
Unlock Deck
k this deck
20
Find the shaded area under the standard normal curve. )
A)0.4878
B)0.8291
C)0.1709
D)0.0854
A)0.4878
B)0.8291
C)0.1709
D)0.0854
Unlock Deck
Unlock for access to all 65 flashcards in this deck.
Unlock Deck
k this deck
21
The weights of 6-week-old poults (juvenile turkeys)are normally distributed with a mean9.1 pounds and standard deviation 2.4 pound(s). Find the 13th percentile of the weights.
A)7.67 lb
B)6.39 lb
C)7.03 lb
D)5.75 lb
A)7.67 lb
B)6.39 lb
C)7.03 lb
D)5.75 lb
Unlock Deck
Unlock for access to all 65 flashcards in this deck.
Unlock Deck
k this deck
22
The weights of 6-week-old poults (juvenile turkeys)are normally distributed with a mean9.1 pounds and standard deviation 2.4 pounds. Find the first quartile of the weight.
A)8.24 lb
B)8.99 lb
C)6.74 lb
D)7.49 lb
A)8.24 lb
B)8.99 lb
C)6.74 lb
D)7.49 lb
Unlock Deck
Unlock for access to all 65 flashcards in this deck.
Unlock Deck
k this deck
23
Use the Central Limit Theorem to find the indicated probability. The sample size is n , the population proportion is , and the sample proportion is
A) 0.9463
B) 0.9525
C) 0.9306
D) 0.9474
, and the sample proportion isA) 0.9463
B) 0.9525
C) 0.9306
D) 0.9474
Unlock Deck
Unlock for access to all 65 flashcards in this deck.
Unlock Deck
k this deck
24
The mean annual income for people in a certain city (in thousands of dollars)is 38, witha standard deviation of 31. A pollster draws a sample of 43 people to interview. Find the68th percentile of the sample mean.
A)37.7 thousand dollars
B)38.7 thousand dollars
C)40.2 thousand dollars
D)42.3 thousand dollars
A)37.7 thousand dollars
B)38.7 thousand dollars
C)40.2 thousand dollars
D)42.3 thousand dollars
Unlock Deck
Unlock for access to all 65 flashcards in this deck.
Unlock Deck
k this deck
25
For a particular diamond mine, 76% of the diamonds fail to qualify as "gemstone grade". A random sample of 96 diamonds is analysed. Find the mean
A) 0.044
B) 0.24
C) 0.96
D) 0.76
A) 0.044
B) 0.24
C) 0.96
D) 0.76
Unlock Deck
Unlock for access to all 65 flashcards in this deck.
Unlock Deck
k this deck
26
A bottler of drinking water fills plastic bottles with a mean volume of 994 milliliters(mL)and standard deviation 5 mL. The fill volumes are normally distributed. Whatproportion of bottles have volumes less than 995 mL?
A)0.5793
B)0.9974
C)0.5596
D)1.0000
A)0.5793
B)0.9974
C)0.5596
D)1.0000
Unlock Deck
Unlock for access to all 65 flashcards in this deck.
Unlock Deck
k this deck
27
The mean annual income for people in a certain city (in thousands of dollars)is 40, witha standard deviation of 35. A pollster draws a sample of 48 people to interview. What isthe probability that the sample mean income is between 34 and45 (thousands of dollars)?
A)0.2781
B)0.1611
C)0.8389
D)0.7219
A)0.2781
B)0.1611
C)0.8389
D)0.7219
Unlock Deck
Unlock for access to all 65 flashcards in this deck.
Unlock Deck
k this deck
28
A sample of size 39 will be drawn from a population with mean 26 and standard deviation 14. Find the probability that will be less than 29 .
A) 0.8925
B) 0.0901
C) 0.9099
D) 0.8770
will be less than 29 . A) 0.8925
B) 0.0901
C) 0.9099
D) 0.8770
Unlock Deck
Unlock for access to all 65 flashcards in this deck.
Unlock Deck
k this deck
29
A sample of size 70 will be drawn from a population with mean 24 and standard deviation 10. Find the probability that will be between 22 and 25 .
A) 0.7521
B) 0.0475
C) 0.7326
D) 0.2005
will be between 22 and 25 .A) 0.7521
B) 0.0475
C) 0.7326
D) 0.2005
Unlock Deck
Unlock for access to all 65 flashcards in this deck.
Unlock Deck
k this deck
30
Use the Central Limit Theorem to find the indicated probability. The sample size is n , the population proportion is , and the sample proportion is
A) 0.0749
B) 0.1251
C) 0.9251
D) 0.8000
, and the sample proportion isA) 0.0749
B) 0.1251
C) 0.9251
D) 0.8000
Unlock Deck
Unlock for access to all 65 flashcards in this deck.
Unlock Deck
k this deck
31
A ferry will safely accommodate 66 tons of passenger cars. Assume that the mean weightof a passenger car is 1.7 tons with standard deviation 0.5 tons. If a random sample of 36cars are loaded onto the ferry, what is the probability that the maximum safe weight willbe exceeded?
A)0.0548
B)0.0668
C)0.9452
D)0.0384
A)0.0548
B)0.0668
C)0.9452
D)0.0384
Unlock Deck
Unlock for access to all 65 flashcards in this deck.
Unlock Deck
k this deck
32
A bottler of drinking water fills plastic bottles with a mean volume of 993 milliliters(mL)and standard deviation 6 mL. The fill volumes are normally distributed. Whatproportion of bottles have volumes between 991 mL and 997 mL?
A)0.3779
B)0.7486
C)0.3707
D)0.3377
A)0.3779
B)0.7486
C)0.3707
D)0.3377
Unlock Deck
Unlock for access to all 65 flashcards in this deck.
Unlock Deck
k this deck
33
A certain car model has a mean gas mileage of 29 miles per gallon (mpg)with a standarddeviation 5 mpg. A pizza delivery company buys 38 of these cars. What is the probabilitythat the average mileage of the fleet is greater than 27.8 mpg?
A)0.9535
B)0.9306
C)0.0465
D)0.8599
A)0.9535
B)0.9306
C)0.0465
D)0.8599
Unlock Deck
Unlock for access to all 65 flashcards in this deck.
Unlock Deck
k this deck
34
Use the Central Limit Theorem to find the indicated probability. The sample size is n , the population proportion is , and the sample proportion is
A) 0.6103
B) 0.3483
C) 0.3300
D) 0.3897
, and the sample proportion isA) 0.6103
B) 0.3483
C) 0.3300
D) 0.3897
Unlock Deck
Unlock for access to all 65 flashcards in this deck.
Unlock Deck
k this deck
35
A sample of size 42 will be drawn from a population with mean 34 and standard deviation 8. Find the probability that will be greater than 36 .
A) 0.0526
B) 0.9474
C) 0.0749
D) 0.0351
will be greater than 36 .A) 0.0526
B) 0.9474
C) 0.0749
D) 0.0351
Unlock Deck
Unlock for access to all 65 flashcards in this deck.
Unlock Deck
k this deck
36
A sample of size 40 will be drawn from a population with mean 98 and standard deviation 24. Find the 21st percentile of
A) 90.8
B) 91.4
C) 93.8
D) 94.9
A) 90.8
B) 91.4
C) 93.8
D) 94.9
Unlock Deck
Unlock for access to all 65 flashcards in this deck.
Unlock Deck
k this deck
37
The mean number of pets per household is 3.25 with standard deviation 1.3. A sample of59 households is drawn. Find the 74th percentile of the sample mean.
A)4.11
B)2.70
C)3.86
D)3.36
A)4.11
B)2.70
C)3.86
D)3.36
Unlock Deck
Unlock for access to all 65 flashcards in this deck.
Unlock Deck
k this deck
38
The weights of 6-week-old poults (juvenile turkeys)are normally distributed with a mean8.6 pounds and standard deviation 1.9 pounds. A turkey farmer wants to provide amoney-back guarantee that her 6-week poults will weigh at least a certain amount. Whatweight should she guarantee so that she will have to give her customer's money backonly 1% of the time?
A)4.59 lb
B)3.34 lb
C)5.00 lb
D)4.17 lb
A)4.59 lb
B)3.34 lb
C)5.00 lb
D)4.17 lb
Unlock Deck
Unlock for access to all 65 flashcards in this deck.
Unlock Deck
k this deck
39
The mean annual income for people in a certain city (in thousands of dollars)is 42, witha standard deviation of 38. A pollster draws a sample of 40 people to interview. What isthe probability that the sample mean income is less than 35 (thousands of dollars)?
A)0.8554
B)0.1210
C)0.1446
D)0.0934
A)0.8554
B)0.1210
C)0.1446
D)0.0934
Unlock Deck
Unlock for access to all 65 flashcards in this deck.
Unlock Deck
k this deck
40
A certain car model has a mean gas mileage of 31 miles per gallon (mpg)with a standarddeviation 3 mpg. A pizza delivery company buys 35 of these cars. What is the probabilitythat the average mileage of the fleet is between 30.9 and 31.2 mpg?
A)0.2310
B)0.6517
C)0.4207
D)0.7690
A)0.2310
B)0.6517
C)0.4207
D)0.7690
Unlock Deck
Unlock for access to all 65 flashcards in this deck.
Unlock Deck
k this deck
41
Use the normal approximation to find the indicated probability. The sample size is n , the population proportion of successes is p , and X is the number of successes in the sample.
A) 0.3936
B) 0.3446
C) 0.6406
D) 0.3594
A) 0.3936
B) 0.3446
C) 0.6406
D) 0.3594
Unlock Deck
Unlock for access to all 65 flashcards in this deck.
Unlock Deck
k this deck
42
At a cell phone assembly plant, 77% of the cell phone keypads pass inspection. Arandom sample of 111 keypads is analysed. Find the probability that the proportion of thesample keypads that pass inspection is between 0.72 and 0.8.
A)0.6677
B)0.8944
C)0.1056
D)0.7734
A)0.6677
B)0.8944
C)0.1056
D)0.7734
Unlock Deck
Unlock for access to all 65 flashcards in this deck.
Unlock Deck
k this deck
43
At a cell phone assembly plant, 81% of the cell phone keypads pass inspection. Arandom sample of 97 keypads is analysed. Find the probability that more than 85% of thesample keypads pass inspection.
A)0.1587
B)0.8413
C)0.8577
D)0.1423
A)0.1587
B)0.8413
C)0.8577
D)0.1423
Unlock Deck
Unlock for access to all 65 flashcards in this deck.
Unlock Deck
k this deck
44
At a cell phone assembly plant, 77% of the cell phone keypads pass inspection. A random sample of 98 keypads is analysed. Find the mean
A) 0.23
B) 0.77
C) 0.96
D) 0.043
A) 0.23
B) 0.77
C) 0.96
D) 0.043
Unlock Deck
Unlock for access to all 65 flashcards in this deck.
Unlock Deck
k this deck
45
A gardener buys a package of seeds. Seventy-five percent of seeds of this type germinate.The gardener plants 90 seeds. Approximate the probability that the number of seeds thatgerminate is between 57.5 and 72.5 exclusive.
A)0.1461
B)0.8643
C)0.8539
D)0.0104
A)0.1461
B)0.8643
C)0.8539
D)0.0104
Unlock Deck
Unlock for access to all 65 flashcards in this deck.
Unlock Deck
k this deck
46
A gardener buys a package of seeds. Eighty-two percent of seeds of this type germinate.The gardener plants 130 seeds. Approximate the probability that 99 or more seedsgerminate.
A)0.9803
B)0.9678
C)0.9884
D)0.9842
A)0.9803
B)0.9678
C)0.9884
D)0.9842
Unlock Deck
Unlock for access to all 65 flashcards in this deck.
Unlock Deck
k this deck
47
Use the normal approximation to find the indicated probability. The sample size is n , the population proportion of successes is p , and X is the number of successes in the sample.
A) 0.6330
B) 0.1251
C) 0.7580
D) 0.2420
A) 0.6330
B) 0.1251
C) 0.7580
D) 0.2420
Unlock Deck
Unlock for access to all 65 flashcards in this deck.
Unlock Deck
k this deck
48
A gardener buys a package of seeds. Eighty-five percent of seeds of this type germinate.The gardener plants 110 seeds. Approximate the probability that fewer than 85 seedsgerminate.
A)0.0082
B)0.9918
C)0.9964
D)0.0036
A)0.0082
B)0.9918
C)0.9964
D)0.0036
Unlock Deck
Unlock for access to all 65 flashcards in this deck.
Unlock Deck
k this deck
49
For a particular diamond mine, 77% of the diamonds fail to qualify as "gemstone grade".A random sample of 112 diamonds is analysed. Find the probability that more than 81%of the sample diamonds fail to qualify as gemstone grade.
A)0.8729
B)0.1271
C)0.1562
D)0.8438
A)0.8729
B)0.1271
C)0.1562
D)0.8438
Unlock Deck
Unlock for access to all 65 flashcards in this deck.
Unlock Deck
k this deck
50
Use the normal approximation to find the indicated probability. The sample size is n , the population proportion of successes is p , and X is the number of successes in the sample.
A) 0.1210
B) 0.8888
C) 0.8621
D) 0.8790
A) 0.1210
B) 0.8888
C) 0.8621
D) 0.8790
Unlock Deck
Unlock for access to all 65 flashcards in this deck.
Unlock Deck
k this deck
51
For a particular diamond mine, 75% of the diamonds fail to qualify as "gemstone grade".A random sample of 110 diamonds is analysed. Find the probability that less than 81%of the sample diamonds fail to qualify as gemstone grade.
A)0.0735
B)0.9265
C)0.0548
D)0.9452
A)0.0735
B)0.9265
C)0.0548
D)0.9452
Unlock Deck
Unlock for access to all 65 flashcards in this deck.
Unlock Deck
k this deck
52
A public relations firm found that only 88% of voters in a certain state are satisfied with their state representative. How large a sample of voters should be drawn so that the sample proportion of voters who are satisfied with their representative is approximately normally distributed?
A) 101
B) 12
C) 84
D) 10
of voters who are satisfied with their representative is approximately normally distributed?A) 101
B) 12
C) 84
D) 10
Unlock Deck
Unlock for access to all 65 flashcards in this deck.
Unlock Deck
k this deck
53
Use the normal approximation to find the indicated probability. The sample size is n , the population proportion of successes is p , and X is the number of successes in the sample.
A) 0.6179
B) 0.0375
C) 0.5804
D) 0.3821
A) 0.6179
B) 0.0375
C) 0.5804
D) 0.3821
Unlock Deck
Unlock for access to all 65 flashcards in this deck.
Unlock Deck
k this deck
54
For a particular diamond mine, 80% of the diamonds fail to qualify as "gemstone grade". A random sample of 113 diamonds is analysed. Find the mean
A) 0.20
B) 0.96
C) 0.80
D) 0.038
A) 0.20
B) 0.96
C) 0.80
D) 0.038
Unlock Deck
Unlock for access to all 65 flashcards in this deck.
Unlock Deck
k this deck
55
At a cell phone assembly plant, 83% of the cell phone keypads pass inspection. Arandom sample of 192 keypads is analysed. Find the probability that less than 86% of thesample keypads pass inspection.
A)0.8962
B)0.1335
C)0.8665
D)0.1038
A)0.8962
B)0.1335
C)0.8665
D)0.1038
Unlock Deck
Unlock for access to all 65 flashcards in this deck.
Unlock Deck
k this deck
56
Use the normal approximation to find the indicated probability. The sample size is n , the population proportion of successes is , and X is the number of successes in the sample.
ppp
A) 0.7611
B) 0.2743
C) 0.7517
D) 0.7257
, and X is the number of successes in the sample.ppp
A) 0.7611
B) 0.2743
C) 0.7517
D) 0.7257
Unlock Deck
Unlock for access to all 65 flashcards in this deck.
Unlock Deck
k this deck
57
For a particular diamond mine, 82% of the diamonds fail to qualify as "gemstone grade".A random sample of 90 diamonds is analysed. Find the probability that the proportion ofthe sample diamonds that fail to qualify as gemstone grade is between 0.78 and 0.88.
A)0.7695
B)0.1611
C)0.9306
D)0.8389
A)0.7695
B)0.1611
C)0.9306
D)0.8389
Unlock Deck
Unlock for access to all 65 flashcards in this deck.
Unlock Deck
k this deck
58
Use the normal approximation to find the indicated probability. The sample size is n , the population proportion of successes is p , and X is the number of successes in the sample.
A) 0.1423
B) 0.1611
C) 0.1292
D) 0.8708
A) 0.1423
B) 0.1611
C) 0.1292
D) 0.8708
Unlock Deck
Unlock for access to all 65 flashcards in this deck.
Unlock Deck
k this deck
59
A public relations firm found that only 9 % of voters in a certain state are satisfied with their U.S. senators. How large a sample of voters should be drawn so that the sample proportion of voters who are satisfied with their senators is approximately normally distributed?
A) 11
B) 10
C) 125
D) 112
of voters who are satisfied with their senators is approximately normally distributed?A) 11
B) 10
C) 125
D) 112
Unlock Deck
Unlock for access to all 65 flashcards in this deck.
Unlock Deck
k this deck
60
At a cell phone assembly plant, 80 % of the cell phone keypads pass inspection. A random sample of 116 keypads is analysed. Find the mean
A) 0.80
B) 0.20
C) 0.037
D) 0.96
A) 0.80
B) 0.20
C) 0.037
D) 0.96
Unlock Deck
Unlock for access to all 65 flashcards in this deck.
Unlock Deck
k this deck
61
The following stem-and-leaf plots each illustrate a sample. )
Unlock Deck
Unlock for access to all 65 flashcards in this deck.
Unlock Deck
k this deck
62
The following boxplots each illustrate a sample. )
Unlock Deck
Unlock for access to all 65 flashcards in this deck.
Unlock Deck
k this deck
63
The following dotplots each illustrate a sample. )
Unlock Deck
Unlock for access to all 65 flashcards in this deck.
Unlock Deck
k this deck
64
Airlines often sell more tickets for a flight than there are seats because some ticketholders do not show up for the flight. Assume that an airplane has 170 seats forpassengers and that the probability that a person holding a ticket appears for the flight is0.93. If the airline sells 176 tickets, what is the probability that everyone who appears forthe flight will get a seat?
A)0.9625
B)0.9515
C)0.9778
D)0.9608
A)0.9625
B)0.9515
C)0.9778
D)0.9608
Unlock Deck
Unlock for access to all 65 flashcards in this deck.
Unlock Deck
k this deck
65
The following histograms each illustrate a sample. )
Unlock Deck
Unlock for access to all 65 flashcards in this deck.
Unlock Deck
k this deck
Unlock Deck
Unlock for access to all 65 flashcards in this deck.


