Deck 9: Inferences on Two Samples
Full screen (f)
Question
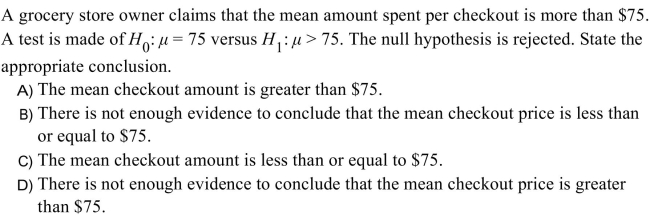
A garden supplier claims that its new variety of giant tomato produces fruit with an mean weight of 45 ounces. A test is made of 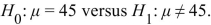
The null hypothesis
is rejected. State the appropriate conclusion.
A) There is not enough evidence to conclude that the mean weight differs from 45 ounces.
B) The mean weight is not equal to 45 ounces.
C) There is not enough evidence to conclude that the mean weight is 45 ounces.
D) The mean weight is equal to 45 ounces.
Question
A fleet of rental cars - all the same make, model, and year - has a mean fuel efficiency of 25.6 miles per gallon (mpg). A random sample of 54 cars are selected and the air filter of each is replaced with a new one. Let  be the population mean fuel efficiency score that would occur if every car's air filter were replaced. The air filter change is deemed effective if
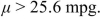
A test is made of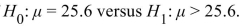
Assume that the air filter changes are effective but the conclusion is reached that the chan might not be effective. Which type of error, of any, has occurred?
A) No error - correct decision
B) Type I
C) Mechanical failure
D) Type II
be the population mean fuel efficiency score that would occur if every car's air filter were replaced. The air filter change is deemed effective if A test is made of
Assume that the air filter changes are effective but the conclusion is reached that the chan might not be effective. Which type of error, of any, has occurred?
A) No error - correct decision
B) Type I
C) Mechanical failure
D) Type II
Question
Question
Question
A garden supplier claims that its new variety of giant tomato produces fruit with an mean weight of 44 ounces. A test is made of 
The null hypothesis
is not rejected. State the appropriate conclusion.
A) There is not enough evidence to conclude that the mean weight differs from 44 ounces.
B) The mean weight is equal to 44 ounces.
C) There is not enough evidence to conclude that the mean weight is 44 ounces.
D) The mean weight is not equal to 44 ounces.
Question
A sample of 75 chewable vitamin tablets have a sample mean of 251 milligrams ofvitamin C. ) 
Question
A new organic pest control formula is being tested on potato plants to see whether it can reduce the level of potato beetle infestation. The mean number of beetles per untreated plant is 5 . It is hoped that the new formula may reduce this infestation rate. State the appropriate null and alternate hypotheses.
A)
B).
C)
D)
A)
B).
C)
D)
Question
A fleet of rental cars - all the same make, model, and year - has a mean fuel efficiency of 24 miles per gallon (mpg). A random sample of 60 cars are selected and the air filter of each is replaced with a new one. Let  be the population mean fuel efficiency score that would occur if every car's air filter were replaced. The air filter change is deemed effective if
  A test is made of
Assume that the air filter changes are not effective. Which type of error is impossible?
A) Type I
B) Type II
be the population mean fuel efficiency score that would occur if every car's air filter were replaced. The air filter change is deemed effective if A test is made of Assume that the air filter changes are not effective. Which type of error is impossible?
A) Type I
B) Type II
Question
Determine whether the outcome is a Type I error, a Type II error, or a correct decision.
A test is made of versus
  The true value of
  is 18 and
not rejected.
A) Type II error
B) Type I error
C) Correct decision
A test is made of
versus The true value of is 18 and not rejected.
A) Type II error
B) Type I error
C) Correct decision
Question
A test is made of 
 The population standard deviation is
  Compute the value of the test
statistic z and determine if is rejected at the
A)
B)
C)
D)
The population standard deviation is Compute the value of the teststatistic z and determine if
is rejected at the A)
B)
C)
D)
Question
A test of  is performed using a significance level of
  The value of the test statistic is
  rejected?
A) Yes
B) No
C) It cannot be determined.
is performed using a significance level of The value of the test statistic is rejected?A) Yes
B) No
C) It cannot be determined.
Question
A test is made of 
A sample of size n=72 is drawn, and The population standard deviation is
  Compute the value of the test statistic z .
A) 0.04
B) 1.63
C) 0.62
D) 0.31
A sample of size n=72 is drawn, and
The population standard deviation is Compute the value of the test statistic z .A) 0.04
B) 1.63
C) 0.62
D) 0.31
Question
Determine whether the outcome is a Type I error, a Type II error, or a correct decision. A test is made of  versus
  The true value of
  is 5 and
  is rejected.
A) Type I error
B) Correct decision
C) Type II error
versus The true value of is 5 and is rejected.A) Type I error
B) Correct decision
C) Type II error
Question
A test is made of 
A sample of size n=68 is drawn, and The population standard deviation is
  Compute the value of the test statistic z .
A) -1.84
B) -0.05
C) -0.41
D) 0.34
A sample of size n=68 is drawn, and
The population standard deviation is Compute the value of the test statistic z .A) -1.84
B) -0.05
C) -0.41
D) 0.34
Question
A fleet of rental cars - all the same make, model, and year - has a mean fuel efficiency of 27 miles per gallon (mpg). A random sample of 54 cars are selected and the air filter of each is replaced with a new one. Let  be the population mean fuel efficiency score that would occur if every car's air filter were replaced. The air filter change is deemed effective if
  A test is made of
  versus
Consider these possible conclusions:
i). The air filter changes are effective.
ii). The air filter changes are not effective.
iii). The air filter changes might not be effective.
Which of the three conclusions is best if is not rejected?
A) ii
B) i
C) iii
be the population mean fuel efficiency score that would occur if every car's air filter were replaced. The air filter change is deemed effective if A test is made of versus Consider these possible conclusions:
i). The air filter changes are effective.
ii). The air filter changes are not effective.
iii). The air filter changes might not be effective.
Which of the three conclusions is best if
is not rejected?A) ii
B) i
C) iii
Question
A fleet of rental cars - all the same make, model, and year - has a mean fuel efficiency of 27 miles per gallon (mpg). A random sample of 43 cars are selected and the air filter of each is replaced with a new one. Let  be the population mean fuel efficiency score that would occur if every car's air filter were replaced. The air filter change is deemed effective if
  A test is made of
Assume that the air filter changes are effective. Which type of error is impossible?
A) Type II
B) Type I
be the population mean fuel efficiency score that would occur if every car's air filter were replaced. The air filter change is deemed effective if A test is made of Assume that the air filter changes are effective. Which type of error is impossible?
A) Type II
B) Type I
Question
A test is made of  A sample of size n=66 is drawn, and
  The population standard deviation is
  Compute the value of the test statistic z and determine if
  is rejected at the
  level.
A)
B)
C)
D)
A sample of size n=66 is drawn, and The population standard deviation is Compute the value of the test statistic z and determine if is rejected at the level.A)
B)
C)
D)
Question
Determine whether the alternative hypothesis is left-tailed, right-tailed, or two-tailed. 
A)left-tailed
B)right-tailed
C)two-tailed
A)left-tailed
B)right-tailed
C)two-tailed
Question
A sample of 50 chewable vitamin tablets have a sample mean of 258 milligrams of vitamin C. Nutritionists want to perform a hypothesis test to determine how strong the evidence is that the mean mass of vitamin C per tablet exceeds 260 milligrams. State the appropriate null and alternate hypotheses.
A)
B)
C)
D)
A)
B)
C)
D)
Question
A fleet of rental cars - all the same make, model, and year - has a mean fuel efficiency of 24.7 miles per gallon (mpg). A random sample of 54 cars are selected and the air filter of each is replaced with a new one. Let  be the population mean fuel efficiency score that would occur if every car's air filter were replaced. The air filter change is deemed effective if https://storage.examlex.com/TB34225555/
 . A test is made of
  versus
Consider these possible conclusions:
i). The air filter changes are effective.
ii). The air filter changes are not effective.
iii). The air filter changes might not be successful.
Which of the three conclusions is best if is rejected?
A) iii
B) ii
C) i
be the population mean fuel efficiency score that would occur if every car's air filter were replaced. The air filter change is deemed effective if https://storage.examlex.com/TB34225555/. A test is made of versus Consider these possible conclusions:
i). The air filter changes are effective.
ii). The air filter changes are not effective.
iii). The air filter changes might not be successful.
Which of the three conclusions is best if
is rejected?A) iii
B) ii
C) i
Question
A test of  is performed using a significance level of
  The value of the test statistic is z=-2.19 .
If the true value of is 44 , does the conclusion result in a Type I error, a Type II error, or correct decision?
A) Type II error
B) Type I error
C) Correct decision
is performed using a significance level of The value of the test statistic is z=-2.19 .If the true value of
is 44 , does the conclusion result in a Type I error, a Type II error, or correct decision?A) Type II error
B) Type I error
C) Correct decision
Question
If P=0.026 , which of the following is the best conclusion?
A) If is true, the probability of obtaining a test statistic as extreme as or more extreme than the one actually observed is 0.026 .
B) The probability that is false is 0.026 .
C) The probability that is true is 0.026 .
D) If is false, the probability of obtaining a test statistic as extreme as or more extreme than the one actually observed is 0.026 .
A) If
is true, the probability of obtaining a test statistic as extreme as or more extreme than the one actually observed is 0.026 .B) The probability that
is false is 0.026 .C) The probability that
is true is 0.026 .D) If
is false, the probability of obtaining a test statistic as extreme as or more extreme than the one actually observed is 0.026 . Question
A test of  is performed using a significance level of
  The P -value is 0.062 .
If the true value of is 60 , does the conclusion result in a Type I error, a Type II error, or correct decision?
A) Type I error
B) Correct decision
C) Type II error
is performed using a significance level of The P -value is 0.062 .If the true value of
is 60 , does the conclusion result in a Type I error, a Type II error, or correct decision?A) Type I error
B) Correct decision
C) Type II error
Question
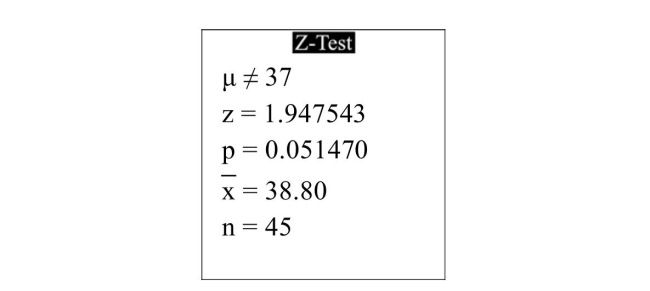
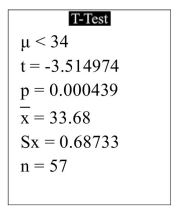
The following display from a TI-84 Plus calculator presents the results of a hypothesis test. What is the value of the test statistic?
A)38.80
B)0.051470
C)1.947543
D)37
Question
A test of 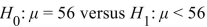 is performed using a significance level of
  The P -value is 0.174 .
If the true value of is 56 , does the conclusion result in a Type I error, a Type II error, or correct decision?
A) Type I error
B) Correct decision
C) Type II error
is performed using a significance level of The P -value is 0.174 .If the true value of
is 56 , does the conclusion result in a Type I error, a Type II error, or correct decision?A) Type I error
B) Correct decision
C) Type II error
Question
A test of 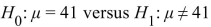 is performed using a significance level of
  The P -value is 0.028 .
If the true value of is 41 , does the conclusion result in a Type I error, a Type II error, or correct decision?
A) Correct decision
B) Type II error
C) Type I error
is performed using a significance level of The P -value is 0.028 .If the true value of
is 41 , does the conclusion result in a Type I error, a Type II error, or correct decision?A) Correct decision
B) Type II error
C) Type I error
Question
A test of 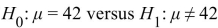 is performed using a significance level of
  The value of the test statistic is z=-2.71 . Is
  rejected?
A) Yes
B) It cannot be determined.
C) No
is performed using a significance level of The value of the test statistic is z=-2.71 . Is rejected?A) Yes
B) It cannot be determined.
C) No
Question
The Golden Comet is a hybrid chicken that is prized for its high egg production 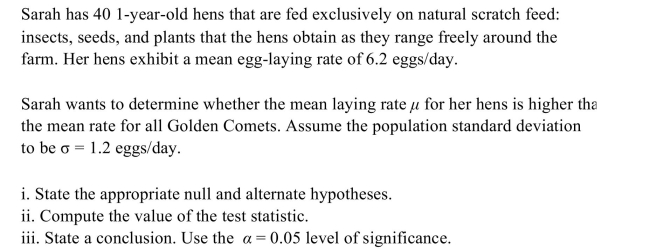 rate and gentle disposition. According to recent studies, the mean rate of egg
rate and gentle disposition. According to recent studies, the mean rate of egg Question
The Golden Comet is a hybrid chicken that is prized for its high egg production rate and exhibit a mean egg-laying rate of 6.0 eggs/day. 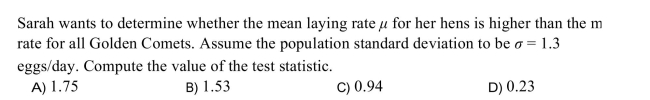
Question
Mercury is a heavy metal that can cause severe health problems in even small concentrations. 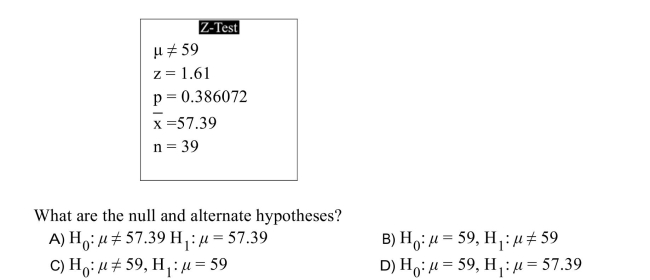
Question
A test of  is performed using a significance level of
  The value of the test statistic is z=-2.02 .
If the true value of is 46 , does the conclusion result in a Type I error, a Type II error, or correct decision?
A) Correct decision
B) Type I error
C) Type II error
is performed using a significance level of The value of the test statistic is z=-2.02 .If the true value of
is 46 , does the conclusion result in a Type I error, a Type II error, or correct decision?A) Correct decision
B) Type I error
C) Type II error
Question
The Golden Comet is a hybrid chicken that is prized for its high egg production rate and seeds, and plants that the hens obtain as they range freely around the farm. Her hens
Exhibit a mean egg-laying rate of 6.8 eggs/day.
N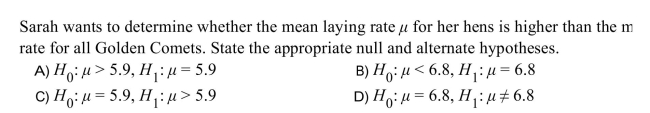
Exhibit a mean egg-laying rate of 6.8 eggs/day.
N
Question
A test of  is performed using a significance level of
  The value of the test statistic is z=-1.85 .
If the true value of is 62 , does the conclusion result in a Type I error, a Type II error, or correct decision?
A) Correct decision
B) Type I error
C) Type II error
is performed using a significance level of The value of the test statistic is z=-1.85 .If the true value of
is 62 , does the conclusion result in a Type I error, a Type II error, or correct decision?A) Correct decision
B) Type I error
C) Type II error
Question
A test of 
is performed using a significance level of The P -value is 0.164 . Is
  rejected?
A) No
B) Yes
C) It cannot be determined.
is performed using a significance level of
The P -value is 0.164 . Is rejected?A) No
B) Yes
C) It cannot be determined.
Question
A test of  is performed using a significance level of
  The P -value is 0.194 .
If the true value of is 40 , does the conclusion result in a Type I error, a Type II error, or correct decision?
A) Type I error
B) Type II error
C) Correct decision
is performed using a significance level of The P -value is 0.194 .If the true value of
is 40 , does the conclusion result in a Type I error, a Type II error, or correct decision?A) Type I error
B) Type II error
C) Correct decision
Question
A test of  is performed using a significance level of
  The value of the test statistic is z=-1.84 .
If the true value of is 55 does the conclusion result in a Type I error, a Type II error, or \varepsilon correct decision?
A) Type II error
B) Correct decision
C) Type I error
is performed using a significance level of The value of the test statistic is z=-1.84 .If the true value of
is 55 does the conclusion result in a Type I error, a Type II error, or \varepsilon correct decision?A) Type II error
B) Correct decision
C) Type I error
Question
A test of 
is performed using a significance level of The P -value is 0.009 . Is
  rejected?
A) Yes
B) No
C) It cannot be determined.
is performed using a significance level of
The P -value is 0.009 . Is rejected?A) Yes
B) No
C) It cannot be determined.
Question
The following display from a TI-84 Plus calculator presents the results of a hypothesis test. ) 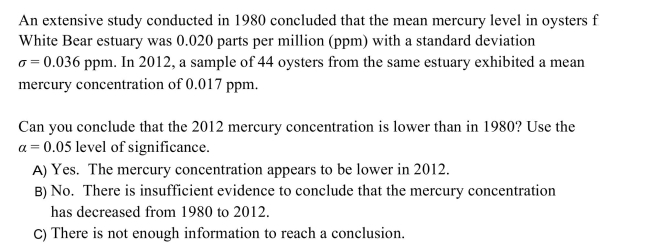
Question
At a water bottling facility, a technician is testing a bottle filling machine that is supposed to deliver 500 milliliters of water. The technician dispenses 49 samples of water and determines the volume of each sample. The 49 samples have a mean volume of 
The machine is out of calibration if the mean volume differs from 500 mL.
The technician wants to perform a hypothesis test to determine whether the machine is ou calibration. State the appropriate null and alternate hypotheses.
A)
B)
C)
D)
The machine is out of calibration if the mean volume differs from 500 mL.
The technician wants to perform a hypothesis test to determine whether the machine is ou calibration. State the appropriate null and alternate hypotheses.
A)
B)
C)
D)
Question
 te the
 Question
A sample of 41 students enroll in a program that claims to improve scores on the quantitative 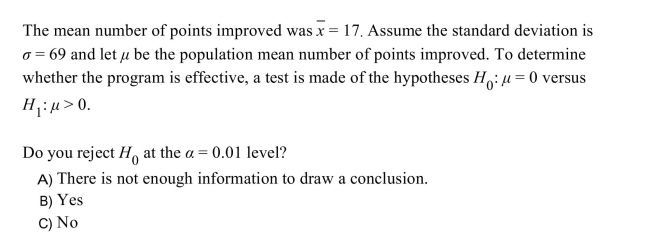
Question
Question
Find the critical values for the following values of the significance level  sample size n , and alternate hypothesis
A) -1.645,1.645
B) -2.228,2.228
C) -2.201,2.201
D) -1.812,1.812
sample size n , and alternate hypothesis A) -1.645,1.645
B) -2.228,2.228
C) -2.201,2.201
D) -1.812,1.812
Question
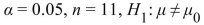
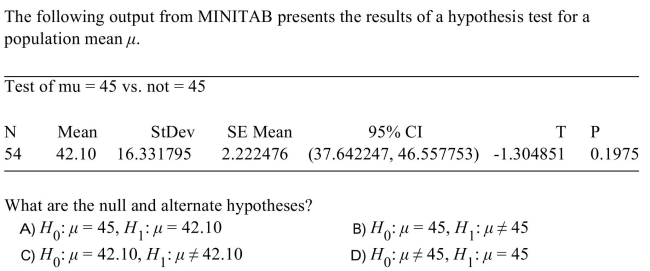
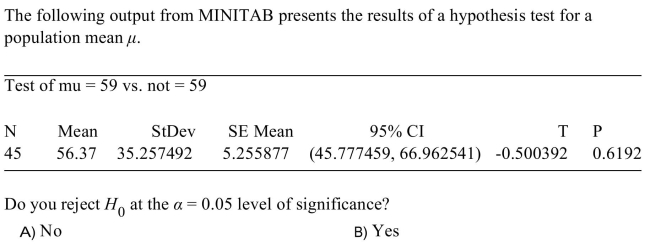
The following output from MINITAB presents the results of a hypothesis test. ) 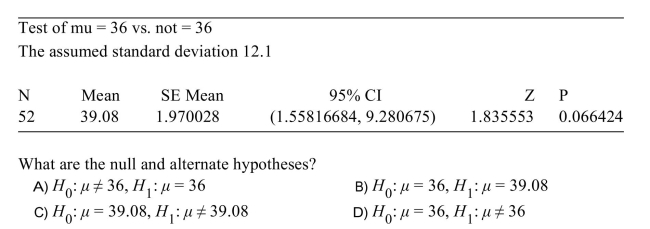
Question
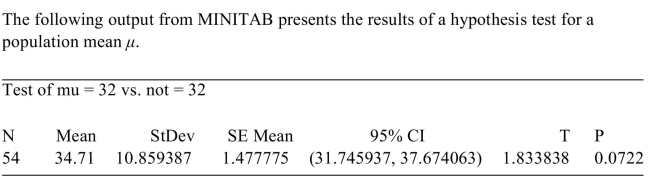
The following output from MINITAB presents the results of a hypothesis test. ) 
Question
A sample of 46 students enroll in a program that claims to improve scores on the quantitative 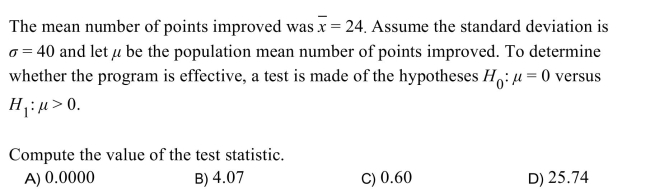
Question
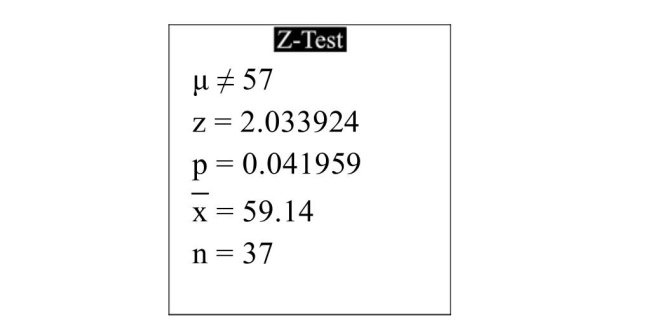
The following display from a TI-84 Plus calculator presents the results of a hypothesis test. What is the P-value?
A)59.14
B)2.033924
C)57
D)0.041959
Question
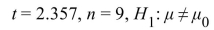
Use technology to find the P -value for the following values of the test statistic t , sample size n , and alternate hypothesis 
A) 0.0930
B) 0.0578
C) 0.1156
D) 0.0465
A) 0.0930
B) 0.0578
C) 0.1156
D) 0.0465
Question
The following display from a TI-84 Plus calculator presents the results of a hypothesis test. ) 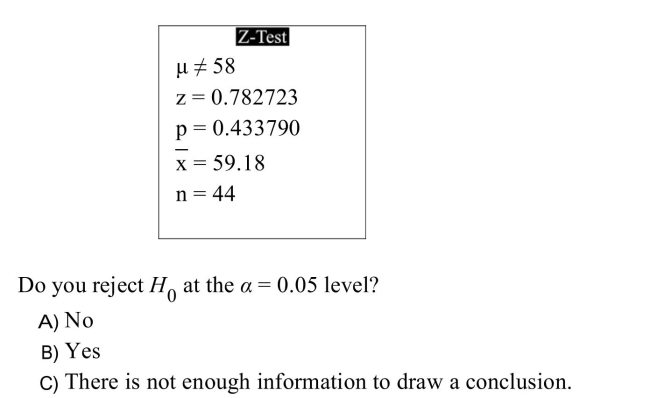
Question
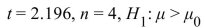
Use technology to find the P -value for the following values of the test statistic t , sample size n , and alternate hypothesis 
A) 0.0428
B) 0.0214
C) 0.0462
D) 0.0231
A) 0.0428
B) 0.0214
C) 0.0462
D) 0.0231
Question
The mean annual tuition and fees for a sample of 15 private colleges was $35,500 with astandard deviation of $6500. ) 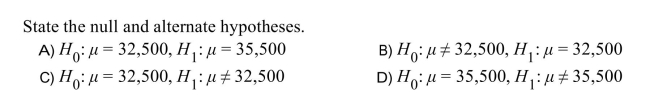
Question
Forty-five members of a bowling league sign up for a program that claims to improve 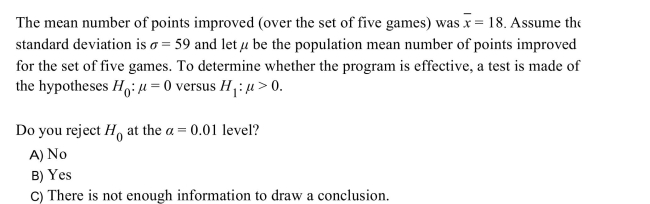
Question
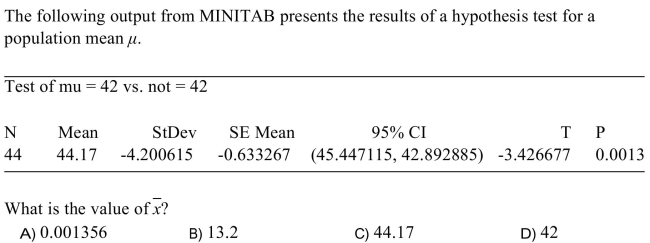
The following output from MINITAB presents the results of a hypothesis test. ) 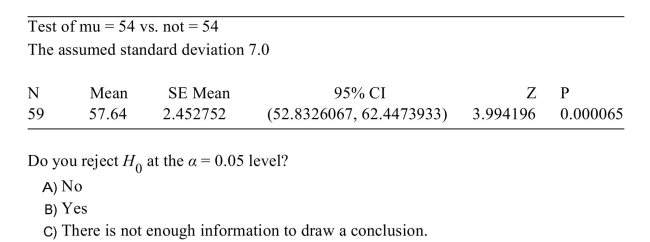
Question
Question
Forty-two members of a bowling league sign up for a program that claims to improve 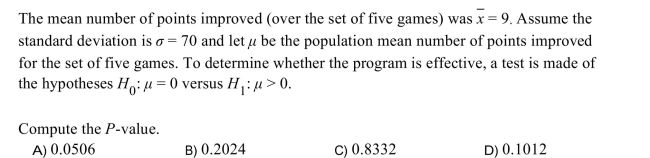
Question
The following output from MINITAB presents the results of a hypothesis test. ) 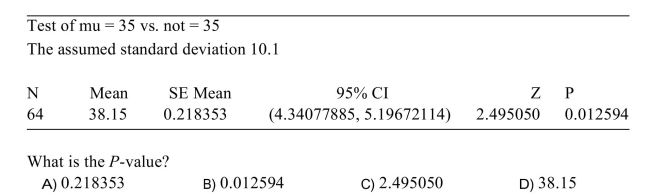
Question
Fifty members of a bowling league sign up for a program that claims to improve bowling scores. 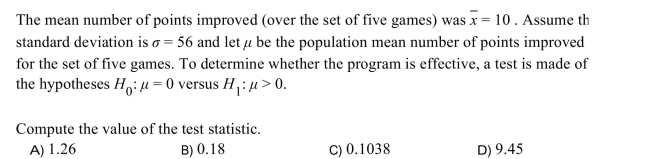
Question
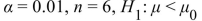
Find the critical value for the following values of the significance level  sample size n , and alternate hypothesis
A) -4.032
B) -3.143
C) -2.326
D) -3.365
sample size n , and alternate hypothesis A) -4.032
B) -3.143
C) -2.326
D) -3.365
Question
Question
A sample of 40 students enroll in a program that claims to improve scores on the quantitative 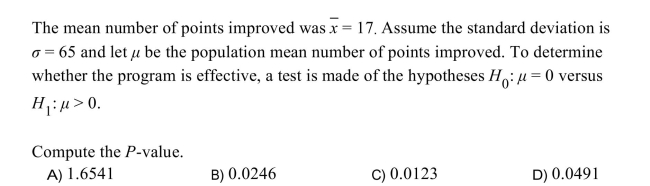
Question
The following display from a TI-84 Plus calculator presents the results of a hypothesis test for a population mean 
Do you reject at the
  level of significance?
A) No
B) Yes
Do you reject
at the level of significance?A) No
B) Yes
Question
A random sample of size 16 from a normal distribution has standard deviation s=32 .
Test
Use the
level of significance.
A) Do not reject
B) Reject
Test
Use the
level of significance.
A) Do not reject
B) Reject
Question
Question
The following display from a TI-84 Plus calculator presents the results of a hypothesis 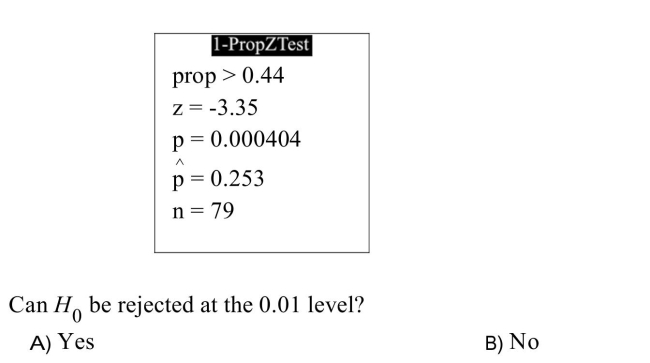
Question
The following display from a TI-84 Plus calculator presents the results of a hypothesis test for a population mean 
State the null and alternate hypotheses.
A)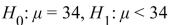
B)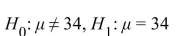
C)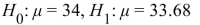
D)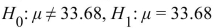
State the null and alternate hypotheses.
A)
B)
C)
D)
Question
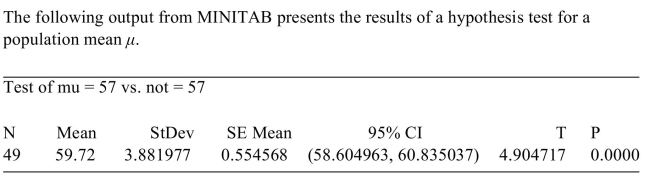 1 What is the value of s?
A)9.4
B)0.554568
C)3.881977
D)0.000011
Question
The following display from a TI-84 Plus calculator presents the results of a hypothesis test for a population mean 
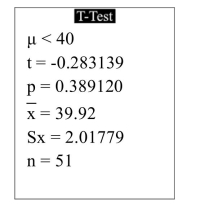
What is the value of
A) -0.283139
B) 40
C) 0.389120
D) 39.92
What is the value of
A) -0.283139
B) 40
C) 0.389120
D) 39.92
Question
Question
A machine that fills beverage cans is supposed to put 16 ounces of beverage in each can.Following are the amounts measured in a simple random sample of eight cans. ) 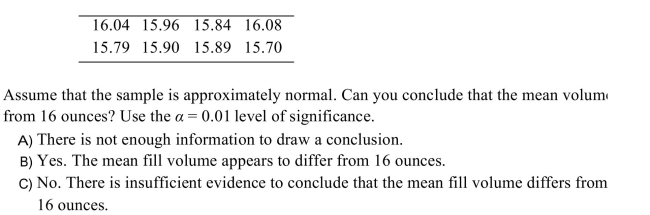
Question
The following display from a TI-84 Plus calculator presents the results of a hypothesis 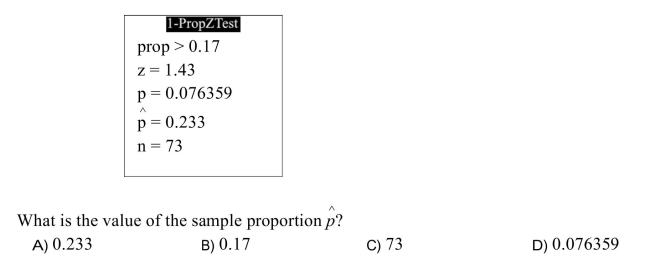
Question
In a simple random sample of size 73, there were 44 individuals in the category of interest. It is desired to test 
versus
Compute the test statistic z .
A) 0.60
B) -3.65
C) 0.05
D) 8.68
versus
Compute the test statistic z .
A) 0.60
B) -3.65
C) 0.05
D) 8.68
Question
The following display from a TI-84 Plus calculator presents the results of a hypothesis test for a population mean

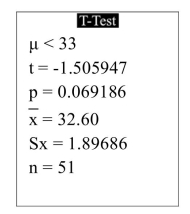
How many degrees of freedom are there?
A) 51
B) 33
C) 50
D) 52
How many degrees of freedom are there?
A) 51
B) 33
C) 50
D) 52
Question
The following display from a TI-84 Plus calculator presents the results of a hypothesis test for a population mean 
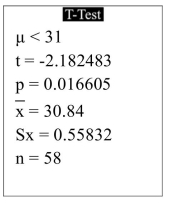
What is the value of s ?
A) 0.55832
B) 0.016605
C) -2.182483
D) 30.84
What is the value of s ?
A) 0.55832
B) 0.016605
C) -2.182483
D) 30.84
Question
 1
1 Question
In a simple random sample of size 77 , there were 37 individuals in the category of interest. Compute the sample proportion 
A) 0.481
B) 0.519
C) 114
D) 0.925
A) 0.481
B) 0.519
C) 114
D) 0.925
Question
In a simple random sample of size 95 , there were 66 individuals in the category of interest. It is desired to test  0.05 level?
versus
Do you reject at the
A) Yes
B) No
0.05 level?versus
Do you reject
at theA) Yes
B) No
Question
 3
3 Question
 5 How many degrees of freedom are there?
A)53
B)32
C)55
D)54
Question
 6
6 Question
The mean annual tuition and fees for a sample of 11 private colleges was $34,100 with astandard deviation of $5400 A dotplot shows that it is reasonable to assume that thepopulation is approximately normal. ) 

Unlock Deck
Sign up to unlock the cards in this deck!
Unlock Deck
Unlock Deck
1/86
Play
Full screen (f)
Deck 9: Inferences on Two Samples
1
A garden supplier claims that its new variety of giant tomato produces fruit with an mean weight of 45 ounces. A test is made of
The null hypothesis
is rejected. State the appropriate conclusion.
A) There is not enough evidence to conclude that the mean weight differs from 45 ounces.
B) The mean weight is not equal to 45 ounces.
C) There is not enough evidence to conclude that the mean weight is 45 ounces.
D) The mean weight is equal to 45 ounces.
The mean weight is not equal to 45 ounces.
2
A fleet of rental cars - all the same make, model, and year - has a mean fuel efficiency of 25.6 miles per gallon (mpg). A random sample of 54 cars are selected and the air filter of each is replaced with a new one. Let be the population mean fuel efficiency score that would occur if every car's air filter were replaced. The air filter change is deemed effective if
A test is made of
Assume that the air filter changes are effective but the conclusion is reached that the chan might not be effective. Which type of error, of any, has occurred?
A) No error - correct decision
B) Type I
C) Mechanical failure
D) Type II
be the population mean fuel efficiency score that would occur if every car's air filter were replaced. The air filter change is deemed effective if A test is made of
Assume that the air filter changes are effective but the conclusion is reached that the chan might not be effective. Which type of error, of any, has occurred?
A) No error - correct decision
B) Type I
C) Mechanical failure
D) Type II
Type II
3
C
4
Unlock Deck
Unlock for access to all 86 flashcards in this deck.
Unlock Deck
k this deck
5
A garden supplier claims that its new variety of giant tomato produces fruit with an mean weight of 44 ounces. A test is made of
The null hypothesis
is not rejected. State the appropriate conclusion.
A) There is not enough evidence to conclude that the mean weight differs from 44 ounces.
B) The mean weight is equal to 44 ounces.
C) There is not enough evidence to conclude that the mean weight is 44 ounces.
D) The mean weight is not equal to 44 ounces.
Unlock Deck
Unlock for access to all 86 flashcards in this deck.
Unlock Deck
k this deck
6
A sample of 75 chewable vitamin tablets have a sample mean of 251 milligrams ofvitamin C. )
Unlock Deck
Unlock for access to all 86 flashcards in this deck.
Unlock Deck
k this deck
7
A new organic pest control formula is being tested on potato plants to see whether it can reduce the level of potato beetle infestation. The mean number of beetles per untreated plant is 5 . It is hoped that the new formula may reduce this infestation rate. State the appropriate null and alternate hypotheses.
A)
B).
C)
D)
A)
B).
C)
D)
Unlock Deck
Unlock for access to all 86 flashcards in this deck.
Unlock Deck
k this deck
8
A fleet of rental cars - all the same make, model, and year - has a mean fuel efficiency of 24 miles per gallon (mpg). A random sample of 60 cars are selected and the air filter of each is replaced with a new one. Let be the population mean fuel efficiency score that would occur if every car's air filter were replaced. The air filter change is deemed effective if A test is made of
Assume that the air filter changes are not effective. Which type of error is impossible?
A) Type I
B) Type II
be the population mean fuel efficiency score that would occur if every car's air filter were replaced. The air filter change is deemed effective if A test is made of Assume that the air filter changes are not effective. Which type of error is impossible?
A) Type I
B) Type II
Unlock Deck
Unlock for access to all 86 flashcards in this deck.
Unlock Deck
k this deck
9
Determine whether the outcome is a Type I error, a Type II error, or a correct decision.
A test is made of versus The true value of is 18 and
not rejected.
A) Type II error
B) Type I error
C) Correct decision
A test is made of
versus The true value of is 18 and not rejected.
A) Type II error
B) Type I error
C) Correct decision
Unlock Deck
Unlock for access to all 86 flashcards in this deck.
Unlock Deck
k this deck
10
A test is made of
The population standard deviation is Compute the value of the test
statistic z and determine if is rejected at the
A)
B)
C)
D)
The population standard deviation is Compute the value of the teststatistic z and determine if
is rejected at the A)
B)
C)
D)
Unlock Deck
Unlock for access to all 86 flashcards in this deck.
Unlock Deck
k this deck
11
A test of is performed using a significance level of The value of the test statistic is rejected?
A) Yes
B) No
C) It cannot be determined.
is performed using a significance level of The value of the test statistic is rejected?A) Yes
B) No
C) It cannot be determined.
Unlock Deck
Unlock for access to all 86 flashcards in this deck.
Unlock Deck
k this deck
12
A test is made of
A sample of size n=72 is drawn, and The population standard deviation is Compute the value of the test statistic z .
A) 0.04
B) 1.63
C) 0.62
D) 0.31
A sample of size n=72 is drawn, and
The population standard deviation is Compute the value of the test statistic z .A) 0.04
B) 1.63
C) 0.62
D) 0.31
Unlock Deck
Unlock for access to all 86 flashcards in this deck.
Unlock Deck
k this deck
13
Determine whether the outcome is a Type I error, a Type II error, or a correct decision. A test is made of versus The true value of is 5 and is rejected.
A) Type I error
B) Correct decision
C) Type II error
versus The true value of is 5 and is rejected.A) Type I error
B) Correct decision
C) Type II error
Unlock Deck
Unlock for access to all 86 flashcards in this deck.
Unlock Deck
k this deck
14
A test is made of
A sample of size n=68 is drawn, and The population standard deviation is Compute the value of the test statistic z .
A) -1.84
B) -0.05
C) -0.41
D) 0.34
A sample of size n=68 is drawn, and
The population standard deviation is Compute the value of the test statistic z .A) -1.84
B) -0.05
C) -0.41
D) 0.34
Unlock Deck
Unlock for access to all 86 flashcards in this deck.
Unlock Deck
k this deck
15
A fleet of rental cars - all the same make, model, and year - has a mean fuel efficiency of 27 miles per gallon (mpg). A random sample of 54 cars are selected and the air filter of each is replaced with a new one. Let be the population mean fuel efficiency score that would occur if every car's air filter were replaced. The air filter change is deemed effective if A test is made of versus
Consider these possible conclusions:
i). The air filter changes are effective.
ii). The air filter changes are not effective.
iii). The air filter changes might not be effective.
Which of the three conclusions is best if is not rejected?
A) ii
B) i
C) iii
be the population mean fuel efficiency score that would occur if every car's air filter were replaced. The air filter change is deemed effective if A test is made of versus Consider these possible conclusions:
i). The air filter changes are effective.
ii). The air filter changes are not effective.
iii). The air filter changes might not be effective.
Which of the three conclusions is best if
is not rejected?A) ii
B) i
C) iii
Unlock Deck
Unlock for access to all 86 flashcards in this deck.
Unlock Deck
k this deck
16
A fleet of rental cars - all the same make, model, and year - has a mean fuel efficiency of 27 miles per gallon (mpg). A random sample of 43 cars are selected and the air filter of each is replaced with a new one. Let be the population mean fuel efficiency score that would occur if every car's air filter were replaced. The air filter change is deemed effective if A test is made of
Assume that the air filter changes are effective. Which type of error is impossible?
A) Type II
B) Type I
be the population mean fuel efficiency score that would occur if every car's air filter were replaced. The air filter change is deemed effective if A test is made of Assume that the air filter changes are effective. Which type of error is impossible?
A) Type II
B) Type I
Unlock Deck
Unlock for access to all 86 flashcards in this deck.
Unlock Deck
k this deck
17
A test is made of A sample of size n=66 is drawn, and The population standard deviation is Compute the value of the test statistic z and determine if is rejected at the level.
A)
B)
C)
D)
A sample of size n=66 is drawn, and The population standard deviation is Compute the value of the test statistic z and determine if is rejected at the level.A)
B)
C)
D)
Unlock Deck
Unlock for access to all 86 flashcards in this deck.
Unlock Deck
k this deck
18
Determine whether the alternative hypothesis is left-tailed, right-tailed, or two-tailed.
A)left-tailed
B)right-tailed
C)two-tailed
A)left-tailed
B)right-tailed
C)two-tailed
Unlock Deck
Unlock for access to all 86 flashcards in this deck.
Unlock Deck
k this deck
19
A sample of 50 chewable vitamin tablets have a sample mean of 258 milligrams of vitamin C. Nutritionists want to perform a hypothesis test to determine how strong the evidence is that the mean mass of vitamin C per tablet exceeds 260 milligrams. State the appropriate null and alternate hypotheses.
A)
B)
C)
D)
A)
B)
C)
D)
Unlock Deck
Unlock for access to all 86 flashcards in this deck.
Unlock Deck
k this deck
20
A fleet of rental cars - all the same make, model, and year - has a mean fuel efficiency of 24.7 miles per gallon (mpg). A random sample of 54 cars are selected and the air filter of each is replaced with a new one. Let be the population mean fuel efficiency score that would occur if every car's air filter were replaced. The air filter change is deemed effective if https://storage.examlex.com/TB34225555/. A test is made of versus
Consider these possible conclusions:
i). The air filter changes are effective.
ii). The air filter changes are not effective.
iii). The air filter changes might not be successful.
Which of the three conclusions is best if is rejected?
A) iii
B) ii
C) i
be the population mean fuel efficiency score that would occur if every car's air filter were replaced. The air filter change is deemed effective if https://storage.examlex.com/TB34225555/. A test is made of versus Consider these possible conclusions:
i). The air filter changes are effective.
ii). The air filter changes are not effective.
iii). The air filter changes might not be successful.
Which of the three conclusions is best if
is rejected?A) iii
B) ii
C) i
Unlock Deck
Unlock for access to all 86 flashcards in this deck.
Unlock Deck
k this deck
21
A test of is performed using a significance level of The value of the test statistic is z=-2.19 .
If the true value of is 44 , does the conclusion result in a Type I error, a Type II error, or correct decision?
A) Type II error
B) Type I error
C) Correct decision
is performed using a significance level of The value of the test statistic is z=-2.19 .If the true value of
is 44 , does the conclusion result in a Type I error, a Type II error, or correct decision?A) Type II error
B) Type I error
C) Correct decision
Unlock Deck
Unlock for access to all 86 flashcards in this deck.
Unlock Deck
k this deck
22
If P=0.026 , which of the following is the best conclusion?
A) If is true, the probability of obtaining a test statistic as extreme as or more extreme than the one actually observed is 0.026 .
B) The probability that is false is 0.026 .
C) The probability that is true is 0.026 .
D) If is false, the probability of obtaining a test statistic as extreme as or more extreme than the one actually observed is 0.026 .
A) If
is true, the probability of obtaining a test statistic as extreme as or more extreme than the one actually observed is 0.026 .B) The probability that
is false is 0.026 .C) The probability that
is true is 0.026 .D) If
is false, the probability of obtaining a test statistic as extreme as or more extreme than the one actually observed is 0.026 . Unlock Deck
Unlock for access to all 86 flashcards in this deck.
Unlock Deck
k this deck
23
A test of is performed using a significance level of The P -value is 0.062 .
If the true value of is 60 , does the conclusion result in a Type I error, a Type II error, or correct decision?
A) Type I error
B) Correct decision
C) Type II error
is performed using a significance level of The P -value is 0.062 .If the true value of
is 60 , does the conclusion result in a Type I error, a Type II error, or correct decision?A) Type I error
B) Correct decision
C) Type II error
Unlock Deck
Unlock for access to all 86 flashcards in this deck.
Unlock Deck
k this deck
24
The following display from a TI-84 Plus calculator presents the results of a hypothesis test. What is the value of the test statistic?
A)38.80
B)0.051470
C)1.947543
D)37
Unlock Deck
Unlock for access to all 86 flashcards in this deck.
Unlock Deck
k this deck
25
A test of is performed using a significance level of The P -value is 0.174 .
If the true value of is 56 , does the conclusion result in a Type I error, a Type II error, or correct decision?
A) Type I error
B) Correct decision
C) Type II error
is performed using a significance level of The P -value is 0.174 .If the true value of
is 56 , does the conclusion result in a Type I error, a Type II error, or correct decision?A) Type I error
B) Correct decision
C) Type II error
Unlock Deck
Unlock for access to all 86 flashcards in this deck.
Unlock Deck
k this deck
26
A test of is performed using a significance level of The P -value is 0.028 .
If the true value of is 41 , does the conclusion result in a Type I error, a Type II error, or correct decision?
A) Correct decision
B) Type II error
C) Type I error
is performed using a significance level of The P -value is 0.028 .If the true value of
is 41 , does the conclusion result in a Type I error, a Type II error, or correct decision?A) Correct decision
B) Type II error
C) Type I error
Unlock Deck
Unlock for access to all 86 flashcards in this deck.
Unlock Deck
k this deck
27
A test of is performed using a significance level of The value of the test statistic is z=-2.71 . Is rejected?
A) Yes
B) It cannot be determined.
C) No
is performed using a significance level of The value of the test statistic is z=-2.71 . Is rejected?A) Yes
B) It cannot be determined.
C) No
Unlock Deck
Unlock for access to all 86 flashcards in this deck.
Unlock Deck
k this deck
28
The Golden Comet is a hybrid chicken that is prized for its high egg production rate and gentle disposition. According to recent studies, the mean rate of egg
rate and gentle disposition. According to recent studies, the mean rate of egg Unlock Deck
Unlock for access to all 86 flashcards in this deck.
Unlock Deck
k this deck
29
The Golden Comet is a hybrid chicken that is prized for its high egg production rate and exhibit a mean egg-laying rate of 6.0 eggs/day.
Unlock Deck
Unlock for access to all 86 flashcards in this deck.
Unlock Deck
k this deck
30
Mercury is a heavy metal that can cause severe health problems in even small concentrations.
Unlock Deck
Unlock for access to all 86 flashcards in this deck.
Unlock Deck
k this deck
31
A test of is performed using a significance level of The value of the test statistic is z=-2.02 .
If the true value of is 46 , does the conclusion result in a Type I error, a Type II error, or correct decision?
A) Correct decision
B) Type I error
C) Type II error
is performed using a significance level of The value of the test statistic is z=-2.02 .If the true value of
is 46 , does the conclusion result in a Type I error, a Type II error, or correct decision?A) Correct decision
B) Type I error
C) Type II error
Unlock Deck
Unlock for access to all 86 flashcards in this deck.
Unlock Deck
k this deck
32
The Golden Comet is a hybrid chicken that is prized for its high egg production rate and seeds, and plants that the hens obtain as they range freely around the farm. Her hens
Exhibit a mean egg-laying rate of 6.8 eggs/day.
N
Exhibit a mean egg-laying rate of 6.8 eggs/day.
N
Unlock Deck
Unlock for access to all 86 flashcards in this deck.
Unlock Deck
k this deck
33
A test of is performed using a significance level of The value of the test statistic is z=-1.85 .
If the true value of is 62 , does the conclusion result in a Type I error, a Type II error, or correct decision?
A) Correct decision
B) Type I error
C) Type II error
is performed using a significance level of The value of the test statistic is z=-1.85 .If the true value of
is 62 , does the conclusion result in a Type I error, a Type II error, or correct decision?A) Correct decision
B) Type I error
C) Type II error
Unlock Deck
Unlock for access to all 86 flashcards in this deck.
Unlock Deck
k this deck
34
A test of
is performed using a significance level of The P -value is 0.164 . Is rejected?
A) No
B) Yes
C) It cannot be determined.
is performed using a significance level of
The P -value is 0.164 . Is rejected?A) No
B) Yes
C) It cannot be determined.
Unlock Deck
Unlock for access to all 86 flashcards in this deck.
Unlock Deck
k this deck
35
A test of is performed using a significance level of The P -value is 0.194 .
If the true value of is 40 , does the conclusion result in a Type I error, a Type II error, or correct decision?
A) Type I error
B) Type II error
C) Correct decision
is performed using a significance level of The P -value is 0.194 .If the true value of
is 40 , does the conclusion result in a Type I error, a Type II error, or correct decision?A) Type I error
B) Type II error
C) Correct decision
Unlock Deck
Unlock for access to all 86 flashcards in this deck.
Unlock Deck
k this deck
36
A test of is performed using a significance level of The value of the test statistic is z=-1.84 .
If the true value of is 55 does the conclusion result in a Type I error, a Type II error, or \varepsilon correct decision?
A) Type II error
B) Correct decision
C) Type I error
is performed using a significance level of The value of the test statistic is z=-1.84 .If the true value of
is 55 does the conclusion result in a Type I error, a Type II error, or \varepsilon correct decision?A) Type II error
B) Correct decision
C) Type I error
Unlock Deck
Unlock for access to all 86 flashcards in this deck.
Unlock Deck
k this deck
37
A test of
is performed using a significance level of The P -value is 0.009 . Is rejected?
A) Yes
B) No
C) It cannot be determined.
is performed using a significance level of
The P -value is 0.009 . Is rejected?A) Yes
B) No
C) It cannot be determined.
Unlock Deck
Unlock for access to all 86 flashcards in this deck.
Unlock Deck
k this deck
38
The following display from a TI-84 Plus calculator presents the results of a hypothesis test. )
Unlock Deck
Unlock for access to all 86 flashcards in this deck.
Unlock Deck
k this deck
39
At a water bottling facility, a technician is testing a bottle filling machine that is supposed to deliver 500 milliliters of water. The technician dispenses 49 samples of water and determines the volume of each sample. The 49 samples have a mean volume of
The machine is out of calibration if the mean volume differs from 500 mL.
The technician wants to perform a hypothesis test to determine whether the machine is ou calibration. State the appropriate null and alternate hypotheses.
A)
B)
C)
D)
The machine is out of calibration if the mean volume differs from 500 mL.
The technician wants to perform a hypothesis test to determine whether the machine is ou calibration. State the appropriate null and alternate hypotheses.
A)
B)
C)
D)
Unlock Deck
Unlock for access to all 86 flashcards in this deck.
Unlock Deck
k this deck
40
te the Unlock Deck
Unlock for access to all 86 flashcards in this deck.
Unlock Deck
k this deck
41
A sample of 41 students enroll in a program that claims to improve scores on the quantitative
Unlock Deck
Unlock for access to all 86 flashcards in this deck.
Unlock Deck
k this deck
42
Thirty-seven members of a bowling league sign up for a program that claims to improve
Unlock Deck
Unlock for access to all 86 flashcards in this deck.
Unlock Deck
k this deck
43
Find the critical values for the following values of the significance level sample size n , and alternate hypothesis
A) -1.645,1.645
B) -2.228,2.228
C) -2.201,2.201
D) -1.812,1.812
sample size n , and alternate hypothesis A) -1.645,1.645
B) -2.228,2.228
C) -2.201,2.201
D) -1.812,1.812
Unlock Deck
Unlock for access to all 86 flashcards in this deck.
Unlock Deck
k this deck
44
The following output from MINITAB presents the results of a hypothesis test. )
Unlock Deck
Unlock for access to all 86 flashcards in this deck.
Unlock Deck
k this deck
45
The following output from MINITAB presents the results of a hypothesis test. )
Unlock Deck
Unlock for access to all 86 flashcards in this deck.
Unlock Deck
k this deck
46
A sample of 46 students enroll in a program that claims to improve scores on the quantitative
Unlock Deck
Unlock for access to all 86 flashcards in this deck.
Unlock Deck
k this deck
47
The following display from a TI-84 Plus calculator presents the results of a hypothesis test. What is the P-value?
A)59.14
B)2.033924
C)57
D)0.041959
Unlock Deck
Unlock for access to all 86 flashcards in this deck.
Unlock Deck
k this deck
48
Use technology to find the P -value for the following values of the test statistic t , sample size n , and alternate hypothesis
A) 0.0930
B) 0.0578
C) 0.1156
D) 0.0465
A) 0.0930
B) 0.0578
C) 0.1156
D) 0.0465
Unlock Deck
Unlock for access to all 86 flashcards in this deck.
Unlock Deck
k this deck
49
The following display from a TI-84 Plus calculator presents the results of a hypothesis test. )
Unlock Deck
Unlock for access to all 86 flashcards in this deck.
Unlock Deck
k this deck
50
Use technology to find the P -value for the following values of the test statistic t , sample size n , and alternate hypothesis
A) 0.0428
B) 0.0214
C) 0.0462
D) 0.0231
A) 0.0428
B) 0.0214
C) 0.0462
D) 0.0231
Unlock Deck
Unlock for access to all 86 flashcards in this deck.
Unlock Deck
k this deck
51
The mean annual tuition and fees for a sample of 15 private colleges was $35,500 with astandard deviation of $6500. )
Unlock Deck
Unlock for access to all 86 flashcards in this deck.
Unlock Deck
k this deck
52
Forty-five members of a bowling league sign up for a program that claims to improve
Unlock Deck
Unlock for access to all 86 flashcards in this deck.
Unlock Deck
k this deck
53
The following output from MINITAB presents the results of a hypothesis test. )
Unlock Deck
Unlock for access to all 86 flashcards in this deck.
Unlock Deck
k this deck
54
A sample of 37 students enroll in a program that claims to improve scores on the
Unlock Deck
Unlock for access to all 86 flashcards in this deck.
Unlock Deck
k this deck
55
Forty-two members of a bowling league sign up for a program that claims to improve
Unlock Deck
Unlock for access to all 86 flashcards in this deck.
Unlock Deck
k this deck
56
The following output from MINITAB presents the results of a hypothesis test. )
Unlock Deck
Unlock for access to all 86 flashcards in this deck.
Unlock Deck
k this deck
57
Fifty members of a bowling league sign up for a program that claims to improve bowling scores.
Unlock Deck
Unlock for access to all 86 flashcards in this deck.
Unlock Deck
k this deck
58
Find the critical value for the following values of the significance level sample size n , and alternate hypothesis
A) -4.032
B) -3.143
C) -2.326
D) -3.365
sample size n , and alternate hypothesis A) -4.032
B) -3.143
C) -2.326
D) -3.365
Unlock Deck
Unlock for access to all 86 flashcards in this deck.
Unlock Deck
k this deck
59
The mean annual tuition and fees for a sample of 9 private colleges was $30,100 with astandard deviation of $5500. A dotplot shows that it is reasonable to assume that thepopulation is approximately normal. You wish to test whether the mean tuition and feesfor private colleges is different from $33,000.Compute the value of the test statistic and state the number of degrees of freedom.
A)-0.527; 9 degrees of freedom
B)-0.527; 8 degrees of freedom
C)-1.582; 9 degrees of freedom
D)-1.582; 8 degrees of freedom
A)-0.527; 9 degrees of freedom
B)-0.527; 8 degrees of freedom
C)-1.582; 9 degrees of freedom
D)-1.582; 8 degrees of freedom
Unlock Deck
Unlock for access to all 86 flashcards in this deck.
Unlock Deck
k this deck
60
A sample of 40 students enroll in a program that claims to improve scores on the quantitative
Unlock Deck
Unlock for access to all 86 flashcards in this deck.
Unlock Deck
k this deck
61
The following display from a TI-84 Plus calculator presents the results of a hypothesis test for a population mean
Do you reject at the level of significance?
A) No
B) Yes
Do you reject
at the level of significance?A) No
B) Yes
Unlock Deck
Unlock for access to all 86 flashcards in this deck.
Unlock Deck
k this deck
62
A random sample of size 16 from a normal distribution has standard deviation s=32 .
Test
Use the
level of significance.
A) Do not reject
B) Reject
Test
Use the
level of significance.
A) Do not reject
B) Reject
Unlock Deck
Unlock for access to all 86 flashcards in this deck.
Unlock Deck
k this deck
63
The mean annual tuition and fees for a sample of 12 private colleges was $39,200with a standard deviation of $4300. A dotplot shows that it is reasonable toassume that the population is approximately normal. You wish to test whether themean tuition and fees for private colleges is different from $35,500.
Unlock Deck
Unlock for access to all 86 flashcards in this deck.
Unlock Deck
k this deck
64
The following display from a TI-84 Plus calculator presents the results of a hypothesis
Unlock Deck
Unlock for access to all 86 flashcards in this deck.
Unlock Deck
k this deck
65
The following display from a TI-84 Plus calculator presents the results of a hypothesis test for a population mean
State the null and alternate hypotheses.
A)
B)
C)
D)
State the null and alternate hypotheses.
A)
B)
C)
D)
Unlock Deck
Unlock for access to all 86 flashcards in this deck.
Unlock Deck
k this deck
66
1 What is the value of s?A)9.4
B)0.554568
C)3.881977
D)0.000011
Unlock Deck
Unlock for access to all 86 flashcards in this deck.
Unlock Deck
k this deck
67
The following display from a TI-84 Plus calculator presents the results of a hypothesis test for a population mean
What is the value of
A) -0.283139
B) 40
C) 0.389120
D) 39.92
What is the value of
A) -0.283139
B) 40
C) 0.389120
D) 39.92
Unlock Deck
Unlock for access to all 86 flashcards in this deck.
Unlock Deck
k this deck
68
Historically, a certain region has experienced 68 thunder days annually. (A "thunder day"is day on which at least one instance of thunder is audible to a normal human ear). Overthe past seven years, the mean number of thunder days is 58 with a standard deviation of26. Can you conclude that the mean number of thunder days is less than 68? Use the = 0.10 level of significance.
A)There is not enough information to draw a conclusion.
B)No. There is insufficient evidence to conclude that the number of thunder days is lessthan 68.
C)Yes. The number of thunder days appears to be less than 68.
A)There is not enough information to draw a conclusion.
B)No. There is insufficient evidence to conclude that the number of thunder days is lessthan 68.
C)Yes. The number of thunder days appears to be less than 68.
Unlock Deck
Unlock for access to all 86 flashcards in this deck.
Unlock Deck
k this deck
69
A machine that fills beverage cans is supposed to put 16 ounces of beverage in each can.Following are the amounts measured in a simple random sample of eight cans. )
Unlock Deck
Unlock for access to all 86 flashcards in this deck.
Unlock Deck
k this deck
70
The following display from a TI-84 Plus calculator presents the results of a hypothesis
Unlock Deck
Unlock for access to all 86 flashcards in this deck.
Unlock Deck
k this deck
71
In a simple random sample of size 73, there were 44 individuals in the category of interest. It is desired to test
versus
Compute the test statistic z .
A) 0.60
B) -3.65
C) 0.05
D) 8.68
versus
Compute the test statistic z .
A) 0.60
B) -3.65
C) 0.05
D) 8.68
Unlock Deck
Unlock for access to all 86 flashcards in this deck.
Unlock Deck
k this deck
72
The following display from a TI-84 Plus calculator presents the results of a hypothesis test for a population mean
How many degrees of freedom are there?
A) 51
B) 33
C) 50
D) 52
How many degrees of freedom are there?
A) 51
B) 33
C) 50
D) 52
Unlock Deck
Unlock for access to all 86 flashcards in this deck.
Unlock Deck
k this deck
73
The following display from a TI-84 Plus calculator presents the results of a hypothesis test for a population mean
What is the value of s ?
A) 0.55832
B) 0.016605
C) -2.182483
D) 30.84
What is the value of s ?
A) 0.55832
B) 0.016605
C) -2.182483
D) 30.84
Unlock Deck
Unlock for access to all 86 flashcards in this deck.
Unlock Deck
k this deck
74
1 Unlock Deck
Unlock for access to all 86 flashcards in this deck.
Unlock Deck
k this deck
75
In a simple random sample of size 77 , there were 37 individuals in the category of interest. Compute the sample proportion
A) 0.481
B) 0.519
C) 114
D) 0.925
A) 0.481
B) 0.519
C) 114
D) 0.925
Unlock Deck
Unlock for access to all 86 flashcards in this deck.
Unlock Deck
k this deck
76
In a simple random sample of size 95 , there were 66 individuals in the category of interest. It is desired to test 0.05 level?
versus
Do you reject at the
A) Yes
B) No
0.05 level?versus
Do you reject
at theA) Yes
B) No
Unlock Deck
Unlock for access to all 86 flashcards in this deck.
Unlock Deck
k this deck
77
3 Unlock Deck
Unlock for access to all 86 flashcards in this deck.
Unlock Deck
k this deck
78
5 How many degrees of freedom are there?A)53
B)32
C)55
D)54
Unlock Deck
Unlock for access to all 86 flashcards in this deck.
Unlock Deck
k this deck
79
6 Unlock Deck
Unlock for access to all 86 flashcards in this deck.
Unlock Deck
k this deck
80
The mean annual tuition and fees for a sample of 11 private colleges was $34,100 with astandard deviation of $5400 A dotplot shows that it is reasonable to assume that thepopulation is approximately normal. )
Unlock Deck
Unlock for access to all 86 flashcards in this deck.
Unlock Deck
k this deck
Unlock Deck
Unlock for access to all 86 flashcards in this deck.


