Deck 6: Estimates and Sample Sizes With One Sample
Full screen (f)
Question
Question
For the next questions, find the critical value  that corresponds to the given confidence level.
90%
that corresponds to the given confidence level.90%
Question
For the next questions, find the critical value that corresponds to the given confidence level.
99%
that corresponds to the given confidence level.99%
Question
Question
Find the minimum sample size required to estimate a population mean 
Margin of error: 5 seconds; confidence level: 95%; seconds
Margin of error: 5 seconds; confidence level: 95%;
seconds Question
Use the following confidence level interval limits to find the point estimate
x and
the margin of error E .
Biologists, studying the weights of mountain whitefish, in grams, find the confidence interval of the mean weights from 328.1 to 713.5 actually does contain the true value of .
.
x and
the margin of error E .
Biologists, studying the weights of mountain whitefish, in grams, find the confidence interval of the mean weights from 328.1 to 713.5 actually does contain the true value of
. Question
Question
For the next questions, assume that a simple random sample has been taken,
the population standard deviation is not known, and the population is normally
distributed. Medical researchers studying cochlear implants, devices placed behind
the bone in the ear to improve hearing, found the following number of implants
over the last twelve years in children under 3 years old. Use a 90% confidence level
and the following sample data:
Find the critical value .
.
the population standard deviation is not known, and the population is normally
distributed. Medical researchers studying cochlear implants, devices placed behind
the bone in the ear to improve hearing, found the following number of implants
over the last twelve years in children under 3 years old. Use a 90% confidence level
and the following sample data:
Find the critical value
. Question
For the next questions, determine which is the correct distribution.
95% Confidence Interval for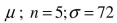 . The sample data appear to come from a normally distributed population.
A) Normal distribution
B) Student t distribution
C) Chi square distribution
D) None of the above
95% Confidence Interval for
. The sample data appear to come from a normally distributed population.A) Normal distribution
B) Student t distribution
C) Chi square distribution
D) None of the above
Question
For the next questions, determine which is the correct distribution.
95% Confidence Interval for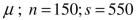 . The sample data appear to come from a normally distributed population.
A) Normal distribution
B) Student t distribution
C) Chi square distribution
D) None of the above
95% Confidence Interval for
. The sample data appear to come from a normally distributed population.A) Normal distribution
B) Student t distribution
C) Chi square distribution
D) None of the above
Question
Find the minimum sample size required to estimate a population mean
Find the margin of error E that corresponds to the above statistics and confidence level.
Find the margin of error E that corresponds to the above statistics and confidence level.
Question
Question
For the next questions, find the critical value tα/2 that corresponds to the given
confidence level.
90%; is unknown ; population appears to be normally distributed
confidence level.
90%;
is unknown ; population appears to be normally distributed Question
For the next questions, find the critical value tα/2 that corresponds to the given
confidence level.
95%; is unknown ; population appears to be normally distributed
confidence level.
95%;
is unknown ; population appears to be normally distributed Question
Find the minimum sample size required to estimate a population mean 
Find the margin of error E that corresponds to the above statistics and confidence level.
Find the margin of error E that corresponds to the above statistics and confidence level.
Question
For the next questions, assume that a simple random sample has been taken,
the population standard deviation is not known, and the population is normally
distributed. Medical researchers studying cochlear implants, devices placed behind
the bone in the ear to improve hearing, found the following number of implants
over the last twelve years in children under 3 years old. Use a 90% confidence level
and the following sample data:
Find the margin of error E that corresponds to the above statistics and confidence level.
Question
Use the following confidence level interval limits to find the point estimate  and
and
the margin of error E .
Medical researchers, studying the improvement of individuals with Down Syndrome on a language and memory test after taking a certain drug, find the confidence interval of the mean test score improvement from 13.96 to 16.04 actually does contain the true value of .
.
andthe margin of error E .
Medical researchers, studying the improvement of individuals with Down Syndrome on a language and memory test after taking a certain drug, find the confidence interval of the mean test score improvement from 13.96 to 16.04 actually does contain the true value of
. Question
Find the minimum sample size required to estimate a population proportion p .
Margin of error: three percentage points; confidence level: 90%; from a prior study, is estimated by the decimal equivalent 60.7%
Margin of error: three percentage points; confidence level: 90%; from a prior study,
is estimated by the decimal equivalent 60.7% Question
Question
For the next questions, determine which is the correct distribution.
95% Confidence Interval for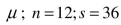 . The sample data appear to come from a normally distributed population.
A) Normal distribution
B) Student t distribution
C) Chi square distribution
D) None of the above
95% Confidence Interval for
. The sample data appear to come from a normally distributed population.A) Normal distribution
B) Student t distribution
C) Chi square distribution
D) None of the above
Question
Use the following confidence level interval limits to find the point estimate  and
and
the margin of error E .
Medical researchers, studying cochlear implants, devices placed behind the bone in the ear to improve hearing, find confidence interval of the mean number of implants over the past 12 years from 186.9 to 408 actually does contain the true value of .
.
andthe margin of error E .
Medical researchers, studying cochlear implants, devices placed behind the bone in the ear to improve hearing, find confidence interval of the mean number of implants over the past 12 years from 186.9 to 408 actually does contain the true value of
. Question
For the next questions, assume that a simple random sample has been taken
and the population is normally distributed. Engineers assessing the variation in
wait time at Starbucks, Dunkin Donuts, and Caribou Coffee determined that the
standard deviation of the wait time for a sample of nine customers was 25.6
seconds. Use a 95% confidence level.
Find the critical value .
.
and the population is normally distributed. Engineers assessing the variation in
wait time at Starbucks, Dunkin Donuts, and Caribou Coffee determined that the
standard deviation of the wait time for a sample of nine customers was 25.6
seconds. Use a 95% confidence level.
Find the critical value
. Question
For the next questions, find the critical value
 that corresponds to the given
confidence level.
95%; is unknown ; population appears to be normally distributed
that corresponds to the givenconfidence level.
95%;
is unknown ; population appears to be normally distributed Question
For the next questions, determine which is the correct distribution.
99% Confidence Interval for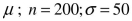 . The sample data appear to come from a normally distributed population.
A) Normal distribution
B) Student t distribution
C) Chi square distribution
D) None of the above
99% Confidence Interval for
. The sample data appear to come from a normally distributed population.A) Normal distribution
B) Student t distribution
C) Chi square distribution
D) None of the above
Question
For the next questions, find the critical value
that corresponds to the given
confidence level.
98%; is unknown ; population appears to be normally distributed
that corresponds to the givenconfidence level.
98%;
is unknown ; population appears to be normally distributed Question
Find the minimum sample size required to estimate a population mean
Margin of error: 7 km; confidence level: 90%;
Margin of error: 7 km; confidence level: 90%;
Question

Unlock Deck
Sign up to unlock the cards in this deck!
Unlock Deck
Unlock Deck
1/29
Play
Full screen (f)
Deck 6: Estimates and Sample Sizes With One Sample
1
Find the minimum sample size required to estimate a population proportion p .
Find the margin of error E that corresponds to the above statistics and confidence level.
Find the margin of error E that corresponds to the above statistics and confidence level.
E = .052
2
For the next questions, find the critical value that corresponds to the given confidence level.
90%
that corresponds to the given confidence level.90%
3
For the next questions, find the critical value that corresponds to the given confidence level.
99%
that corresponds to the given confidence level.99%

4
Find the minimum sample size required to estimate a population proportion p .
Find the margin of error E that corresponds to the above statistics and confidence level.
Find the margin of error E that corresponds to the above statistics and confidence level.
Unlock Deck
Unlock for access to all 29 flashcards in this deck.
Unlock Deck
k this deck
5
Find the minimum sample size required to estimate a population mean
Margin of error: 5 seconds; confidence level: 95%; seconds
Margin of error: 5 seconds; confidence level: 95%;
seconds Unlock Deck
Unlock for access to all 29 flashcards in this deck.
Unlock Deck
k this deck
6
Use the following confidence level interval limits to find the point estimate
x and
the margin of error E .
Biologists, studying the weights of mountain whitefish, in grams, find the confidence interval of the mean weights from 328.1 to 713.5 actually does contain the true value of .
x and
the margin of error E .
Biologists, studying the weights of mountain whitefish, in grams, find the confidence interval of the mean weights from 328.1 to 713.5 actually does contain the true value of
. Unlock Deck
Unlock for access to all 29 flashcards in this deck.
Unlock Deck
k this deck
7
Find the minimum sample size required to estimate a population proportion p .
Margin of error: four percentage points; confidence level: 95%; from a prior study, ˆp is estimated by the decimal equivalent 12.5%
Margin of error: four percentage points; confidence level: 95%; from a prior study, ˆp is estimated by the decimal equivalent 12.5%
Unlock Deck
Unlock for access to all 29 flashcards in this deck.
Unlock Deck
k this deck
8
For the next questions, assume that a simple random sample has been taken,
the population standard deviation is not known, and the population is normally
distributed. Medical researchers studying cochlear implants, devices placed behind
the bone in the ear to improve hearing, found the following number of implants
over the last twelve years in children under 3 years old. Use a 90% confidence level
and the following sample data:
Find the critical value .
the population standard deviation is not known, and the population is normally
distributed. Medical researchers studying cochlear implants, devices placed behind
the bone in the ear to improve hearing, found the following number of implants
over the last twelve years in children under 3 years old. Use a 90% confidence level
and the following sample data:
Find the critical value
. Unlock Deck
Unlock for access to all 29 flashcards in this deck.
Unlock Deck
k this deck
9
For the next questions, assume that a simple random sample has been taken,
the population standard deviation is not known, and the population is normally
distributed. Medical researchers studying cochlear implants, devices placed behind
the bone in the ear to improve hearing, found the following number of implants
over the last twelve years in children under 3 years old. Use a 90% confidence level
and the following sample data:
Find the critical value .
the population standard deviation is not known, and the population is normally
distributed. Medical researchers studying cochlear implants, devices placed behind
the bone in the ear to improve hearing, found the following number of implants
over the last twelve years in children under 3 years old. Use a 90% confidence level
and the following sample data:
Find the critical value
. Unlock Deck
Unlock for access to all 29 flashcards in this deck.
Unlock Deck
k this deck
10
For the next questions, determine which is the correct distribution.
95% Confidence Interval for . The sample data appear to come from a normally distributed population.
A) Normal distribution
B) Student t distribution
C) Chi square distribution
D) None of the above
95% Confidence Interval for
. The sample data appear to come from a normally distributed population.A) Normal distribution
B) Student t distribution
C) Chi square distribution
D) None of the above
Unlock Deck
Unlock for access to all 29 flashcards in this deck.
Unlock Deck
k this deck
11
For the next questions, determine which is the correct distribution.
95% Confidence Interval for . The sample data appear to come from a normally distributed population.
A) Normal distribution
B) Student t distribution
C) Chi square distribution
D) None of the above
95% Confidence Interval for
. The sample data appear to come from a normally distributed population.A) Normal distribution
B) Student t distribution
C) Chi square distribution
D) None of the above
Unlock Deck
Unlock for access to all 29 flashcards in this deck.
Unlock Deck
k this deck
12
Find the minimum sample size required to estimate a population mean
Find the margin of error E that corresponds to the above statistics and confidence level.
Find the margin of error E that corresponds to the above statistics and confidence level.
Unlock Deck
Unlock for access to all 29 flashcards in this deck.
Unlock Deck
k this deck
13
Use the following confidence level interval limits to find the point estimate ˆp and
the margin of error E .
As part of a restoration project at a wetland, biologists planted Lyngbye's sedge shoots. After one year, they find the confidence interval of the proportion of surviving shoots from .648 to .752 actually does contain the true value of p .
the margin of error E .
As part of a restoration project at a wetland, biologists planted Lyngbye's sedge shoots. After one year, they find the confidence interval of the proportion of surviving shoots from .648 to .752 actually does contain the true value of p .
Unlock Deck
Unlock for access to all 29 flashcards in this deck.
Unlock Deck
k this deck
14
For the next questions, find the critical value tα/2 that corresponds to the given
confidence level.
90%; is unknown ; population appears to be normally distributed
confidence level.
90%;
is unknown ; population appears to be normally distributed Unlock Deck
Unlock for access to all 29 flashcards in this deck.
Unlock Deck
k this deck
15
For the next questions, find the critical value tα/2 that corresponds to the given
confidence level.
95%; is unknown ; population appears to be normally distributed
confidence level.
95%;
is unknown ; population appears to be normally distributed Unlock Deck
Unlock for access to all 29 flashcards in this deck.
Unlock Deck
k this deck
16
Find the minimum sample size required to estimate a population mean
Find the margin of error E that corresponds to the above statistics and confidence level.
Find the margin of error E that corresponds to the above statistics and confidence level.
Unlock Deck
Unlock for access to all 29 flashcards in this deck.
Unlock Deck
k this deck
17
For the next questions, assume that a simple random sample has been taken,
the population standard deviation is not known, and the population is normally
distributed. Medical researchers studying cochlear implants, devices placed behind
the bone in the ear to improve hearing, found the following number of implants
over the last twelve years in children under 3 years old. Use a 90% confidence level
and the following sample data:
Find the margin of error E that corresponds to the above statistics and confidence level.
Unlock Deck
Unlock for access to all 29 flashcards in this deck.
Unlock Deck
k this deck
18
Use the following confidence level interval limits to find the point estimate and
the margin of error E .
Medical researchers, studying the improvement of individuals with Down Syndrome on a language and memory test after taking a certain drug, find the confidence interval of the mean test score improvement from 13.96 to 16.04 actually does contain the true value of .
andthe margin of error E .
Medical researchers, studying the improvement of individuals with Down Syndrome on a language and memory test after taking a certain drug, find the confidence interval of the mean test score improvement from 13.96 to 16.04 actually does contain the true value of
. Unlock Deck
Unlock for access to all 29 flashcards in this deck.
Unlock Deck
k this deck
19
Find the minimum sample size required to estimate a population proportion p .
Margin of error: three percentage points; confidence level: 90%; from a prior study, is estimated by the decimal equivalent 60.7%
Margin of error: three percentage points; confidence level: 90%; from a prior study,
is estimated by the decimal equivalent 60.7% Unlock Deck
Unlock for access to all 29 flashcards in this deck.
Unlock Deck
k this deck
20
Use the following confidence level interval limits to find the point estimate ˆp and the margin of error E .
An aquatic site adjacent to an old woodchipping mill is being studied to determine whether environmental liabilities exist from previous woodchipping operations. Because wood chips can leach toxic compounds into the water, environmental consultants measure the proportion of wood chips found in samples taken from various sediment cores. They find the confidence interval of the proportion of wood chips from .194 to .228 actually does contain the true value of p .
An aquatic site adjacent to an old woodchipping mill is being studied to determine whether environmental liabilities exist from previous woodchipping operations. Because wood chips can leach toxic compounds into the water, environmental consultants measure the proportion of wood chips found in samples taken from various sediment cores. They find the confidence interval of the proportion of wood chips from .194 to .228 actually does contain the true value of p .
Unlock Deck
Unlock for access to all 29 flashcards in this deck.
Unlock Deck
k this deck
21
For the next questions, determine which is the correct distribution.
95% Confidence Interval for . The sample data appear to come from a normally distributed population.
A) Normal distribution
B) Student t distribution
C) Chi square distribution
D) None of the above
95% Confidence Interval for
. The sample data appear to come from a normally distributed population.A) Normal distribution
B) Student t distribution
C) Chi square distribution
D) None of the above
Unlock Deck
Unlock for access to all 29 flashcards in this deck.
Unlock Deck
k this deck
22
Use the following confidence level interval limits to find the point estimate and
the margin of error E .
Medical researchers, studying cochlear implants, devices placed behind the bone in the ear to improve hearing, find confidence interval of the mean number of implants over the past 12 years from 186.9 to 408 actually does contain the true value of .
andthe margin of error E .
Medical researchers, studying cochlear implants, devices placed behind the bone in the ear to improve hearing, find confidence interval of the mean number of implants over the past 12 years from 186.9 to 408 actually does contain the true value of
. Unlock Deck
Unlock for access to all 29 flashcards in this deck.
Unlock Deck
k this deck
23
For the next questions, assume that a simple random sample has been taken
and the population is normally distributed. Engineers assessing the variation in
wait time at Starbucks, Dunkin Donuts, and Caribou Coffee determined that the
standard deviation of the wait time for a sample of nine customers was 25.6
seconds. Use a 95% confidence level.
Find the critical value .
and the population is normally distributed. Engineers assessing the variation in
wait time at Starbucks, Dunkin Donuts, and Caribou Coffee determined that the
standard deviation of the wait time for a sample of nine customers was 25.6
seconds. Use a 95% confidence level.
Find the critical value
. Unlock Deck
Unlock for access to all 29 flashcards in this deck.
Unlock Deck
k this deck
24
For the next questions, assume that a simple random sample has been taken
and the population is normally distributed. Engineers assessing the variation in
wait time at Starbucks, Dunkin Donuts, and Caribou Coffee determined that the
standard deviation of the wait time for a sample of nine customers was 25.6
seconds. Use a 95% confidence level.
Find the critical value .
and the population is normally distributed. Engineers assessing the variation in
wait time at Starbucks, Dunkin Donuts, and Caribou Coffee determined that the
standard deviation of the wait time for a sample of nine customers was 25.6
seconds. Use a 95% confidence level.
Find the critical value
. Unlock Deck
Unlock for access to all 29 flashcards in this deck.
Unlock Deck
k this deck
25
For the next questions, find the critical value
that corresponds to the given
confidence level.
95%; is unknown ; population appears to be normally distributed
that corresponds to the givenconfidence level.
95%;
is unknown ; population appears to be normally distributed Unlock Deck
Unlock for access to all 29 flashcards in this deck.
Unlock Deck
k this deck
26
For the next questions, determine which is the correct distribution.
99% Confidence Interval for . The sample data appear to come from a normally distributed population.
A) Normal distribution
B) Student t distribution
C) Chi square distribution
D) None of the above
99% Confidence Interval for
. The sample data appear to come from a normally distributed population.A) Normal distribution
B) Student t distribution
C) Chi square distribution
D) None of the above
Unlock Deck
Unlock for access to all 29 flashcards in this deck.
Unlock Deck
k this deck
27
For the next questions, find the critical value
that corresponds to the given
confidence level.
98%; is unknown ; population appears to be normally distributed
that corresponds to the givenconfidence level.
98%;
is unknown ; population appears to be normally distributed Unlock Deck
Unlock for access to all 29 flashcards in this deck.
Unlock Deck
k this deck
28
Find the minimum sample size required to estimate a population mean
Margin of error: 7 km; confidence level: 90%;
Margin of error: 7 km; confidence level: 90%;
Unlock Deck
Unlock for access to all 29 flashcards in this deck.
Unlock Deck
k this deck
29
For the next questions, assume that a simple random sample has been taken
and the population is normally distributed. Engineers assessing the variation in
wait time at Starbucks, Dunkin Donuts, and Caribou Coffee determined that the
standard deviation of the wait time for a sample of nine customers was 25.6
seconds. Use a 95% confidence level.
Find the margin of error E that corresponds to the above statistics and confidence level.
Unlock Deck
Unlock for access to all 29 flashcards in this deck.
Unlock Deck
k this deck
Unlock Deck
Unlock for access to all 29 flashcards in this deck.


