Deck 13: Comparing Three or More Means
Full screen (f)
Question
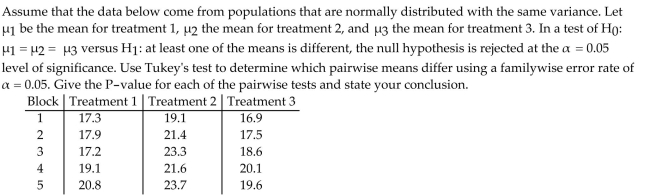
Find the test statistic F to test the hypothesis that the populations have the same mean. Use α = 0.05. 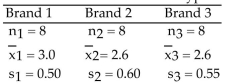
A) 1.403
B) 1.021
C) 1.182
D) 0.832
A) 1.403
B) 1.021
C) 1.182
D) 0.832
Question
Test the hypothesis that the populations have the same mean. Use α= 0.05. 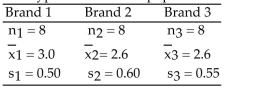
Question
Question
A realtor wishes to compare the square footage of houses in 4 different towns, all of which are pricedapproximately the same. The data are listed below. Can the realtor conclude that the mean square footage inthe four towns are equal? Use α = 0.01. 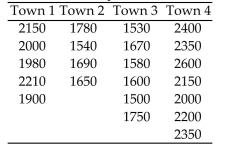
Question
Four different types of insecticides are used on strawberry plants. The number of strawberries on eachrandomly selected plant is given below. Test the hypothesis that the type of insecticide makes no difference inthe mean number of strawberries per plant. Use α = 0.01. 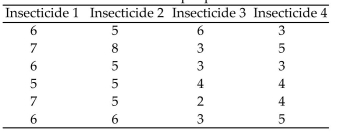
Question
Question
Four different types of insecticides are used on strawberry plants. The number of strawberries on eachrandomly selected plant is given below. Find the critical value F-value to test the hypothesis that the type ofinsecticide makes no difference in the mean number of strawberries per plant. Use α = 0.01. 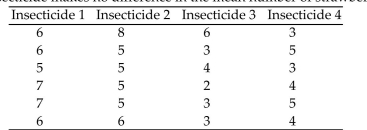
A) 4.94
B) 4.43
C) 26.69
D) 4.18
A) 4.94
B) 4.43
C) 26.69
D) 4.18
Question
Question
The grade point averages of students participating in sports at a local college are to be compared. The data arelisted below. Test the hypothesis that there is no difference in the mean grade point averages of the 3 groups.Use α = 0.05. 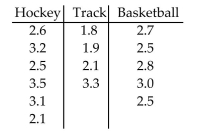
Question
Question
The times (in minutes) to assemble a component for 3 different cell phones are listed below. Workers arerandomly selected. Test the hypothesis that there is no difference in the mean time for each cell phone. Use α =0.01. 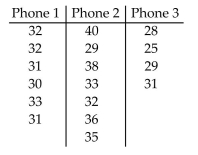
Question
A researcher wishes to determine whether there is a difference in the average age of middle school, highschool, and college teachers. Teachers are randomly selected. Their ages are recorded below. Find the teststatistic F to test the hypothesis that there is no difference in the average age of each group. Use α = 0.01. 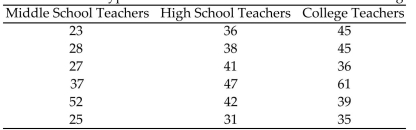
A) 2.517
B) 2.913
C) 3.189
D) 4.312
A) 2.517
B) 2.913
C) 3.189
D) 4.312
Question
A researcher wishes to determine whether there is a difference in the average age of middle school, highschool, and college teachers. Teachers are randomly selected. Their ages are recorded below. Test thehypothesis that there is no difference in the average age of each group. Use α = 0.01. 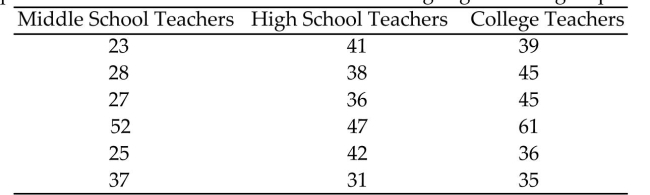
Question
Question
Question
A medical researcher wishes to try three different techniques to lower cholesterol levels of patients with highcholesterol levels. The subjects are randomly selected and assigned to one of three groups. Group 1 is givenmedication, Group 2 is given an exercise program, and Group 3 is assigned a diet program. At the end of sixweeks, each subjectʹs cholesterol level is recorded. Test the hypothesis that there is no difference among themeans. Use α = 0.05. 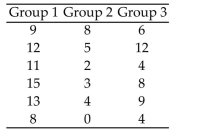
Question
A researcher wishes to determine whether there is a difference in the average age of middle school, highschool, and college teachers. Teachers are randomly selected. Their ages are recorded below. Find the criticalvalue F-value to test the hypothesis that there is no difference in the average age of each group. Useα = 0.01. 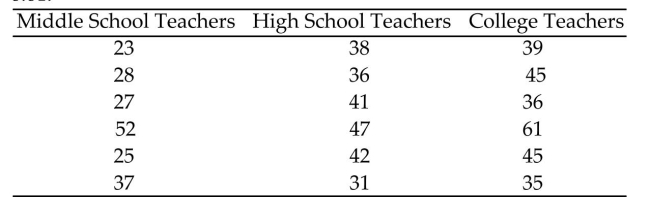
A) 6.36
B) 5.09
C) 9.43
D) 5.42
A) 6.36
B) 5.09
C) 9.43
D) 5.42
Question
Find the critical F0-value to test the hypothesis that the populations have the same mean. Use α= 0.05. 
A) 3.49
B) 3.210
C) 2.819
D) 1.892
A) 3.49
B) 3.210
C) 2.819
D) 1.892
Question
Question
Four different types of insecticides are used on strawberry plants. The number of strawberries on eachrandomly selected plant is given below. Find the test statistic F to test the hypothesis that the type of insecticidemakes no difference in the mean number of strawberries per plant. Use α = 0.01. 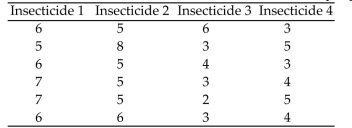
A) 8.357
B) 8.123
C) 7.123
D) 6.912
A) 8.357
B) 8.123
C) 7.123
D) 6.912
Question
A researcher wishes to determine whether there is a difference in the average age of middle school, highschool, and college teachers. Teachers are randomly selected. Their ages are recorded below. Use α = 0.01.Which of the following is a correct statement about the means? 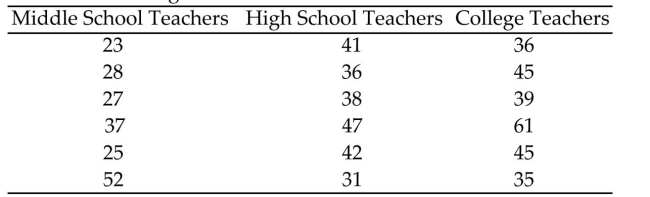
A) There is not enough evidence to suggest that the means are different.
B) The mean age of middle school teachers is different from the mean age of high school teachers.
C) The mean age of middle school teachers is different from the mean age of college teachers.
D) The mean age of high school teachers is different from the mean age of college teachers.
Question
A certain HMO is attempting to show the benefits of managed care to an insurance company. The HMObelieves that certain types of doctors are more cost-effective than others. One theory is that Certification Levelis an important factor in measuring the cost-effectiveness of physicians. To investigate this, the HMO obtainedindependent random samples of 20 physicians from each of the three certification levels-- Board certified (C);Uncertified, board eligible (E); and Uncertified, board ineligible (I)-- and recorded the total per member permonth charges for each (a total of 60 physicians). In order to compare the mean charges for the three groups,the data will be subjected to an analysis of variance. The results of the ANOVA are summarized in thefollowing table. Take α = 0.01. Interpret the P-value of the ANOVA F test. 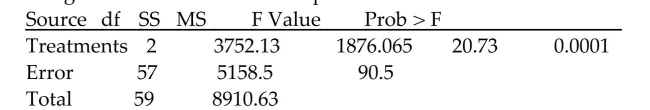
A) The means of the total per member per month charges for the three groups of physicians differ at α = 0.01.
B) The model is not statistically useful (at α = 0.01) for prediction purposes.
C) The variances of the total per number per month charges for the three groups of physicians differ at α = 0.01.
D) The means of the total per member per month charges for the three groups of physicians are equal at α = 0.01.
Question
A realtor wishes to compare the square footage of houses in 4 different towns, all of which are pricedapproximately the same. The data are listed below. Use α = 0.01. Which of the following is correct? 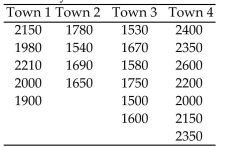
A) The mean square footage of houses in Town 2 is equal to the mean square footage in Town 3.
B) The mean square footage of houses in Town 1 is equal to the mean square footage in Town 2.
C) The mean square footage of houses in Town 3 is equal to the mean square footage in Town 4.
D) The mean square footage of houses in Town 4 is equal to the mean square footage in Town 1.
Question
Question
The times (in minutes) to assemble a component for three different cell phones are listed below. Use α= 0.01.Which of the following is correct? 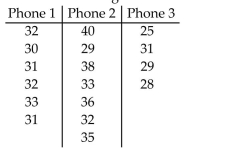
A) The mean time to assemble Phone 1 is the same as the mean time to assemble Phone 2.
B) The mean time to assemble Phone 1 is different from the mean time to assemble Phone 3.
C) The mean time to assemble Phone 2 is the same as the mean time to assemble Phone 3.
D) There is not enough evidence to suggest that the means are different.
Question
A medical researcher wishes to try three different techniques to lower cholesterol levels of patients with highcholesterol levels. The subjects are randomly selected and assigned to one of three groups. Group 1 is givenmedication, Group 2 is given an exercise program, and Group 3 is assigned a diet program. At the end of sixweeks, each subjectʹs cholesterol level is recorded. Use α = 0.05. Which of the following is a correct statementabout the means? 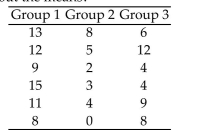
A) The mean of Group 1 is not equal to the mean of Group 2.
B) The mean of Group 1 is not equal to the mean of Group 3.
C) The mean of Group 2 is not equal to the mean of Group 3.
D) All of the means are not equal.
A) The mean of Group 1 is not equal to the mean of Group 2.
B) The mean of Group 1 is not equal to the mean of Group 3.
C) The mean of Group 2 is not equal to the mean of Group 3.
D) All of the means are not equal.
Question
A certain HMO is attempting to show the benefits of managed care to an insurance company. The HMObelieves that certain types of doctors are more cost-effective than others. One theory is that Certification Levelis an important factor in measuring the cost-effectiveness of physicians. To investigate this, the HMO obtainedindependent random samples of 19 physicians from each of the three certification levels-- Board certified (C);Uncertified, board eligible (E); and Uncertified, board ineligible (I)-- and recorded the total per-member,per-month charges for each (a total of 19 physicians). In order to compare the mean charges for the threegroups, the data will be subjected to an analysis of variance.Write the null hypothesis tested by the ANOVA. 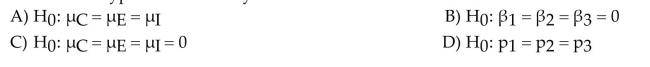
Question
A researcher is testing the percent weight gain on mice of varying ages based upon the diet they eat. He has 4mice in each age category: 6 months, 9 months, 12 months and 15 months. They mice are weighed, fed onlyone of four diets and weighed after 1 month. The weight gain percent is then recorded. The data is givenbelow. Test at α = 0.05 if there is a difference in weights. 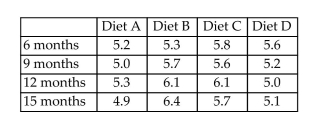
A) Diet does result in significantly different weight gains.
B) Diet does not result in significantly different weight gains.
A) Diet does result in significantly different weight gains.
B) Diet does not result in significantly different weight gains.
Question
Question
Question
Which of the following is not an example of a mean square? 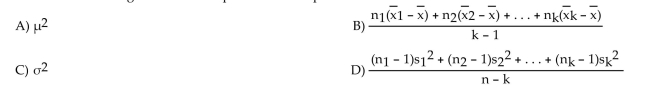
Question
Question
Four different types of insecticides are used on strawberry plants. The number of strawberries on eachrandomly selected plant is given below. Use α = 0.01. Which of the following is a correct statement about themeans? 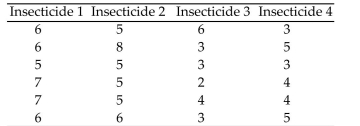
A) The mean of Insecticide 1 is equal to the mean of Insecticide 2.
B) The mean of Insecticide 2 is equal to the mean of Insecticide 3.
C) The mean of Insecticide 3 is equal to the mean of Insecticide 1.
D) The mean of Insecticide 1 is equal to the mean of Insecticide 4.
A) The mean of Insecticide 1 is equal to the mean of Insecticide 2.
B) The mean of Insecticide 2 is equal to the mean of Insecticide 3.
C) The mean of Insecticide 3 is equal to the mean of Insecticide 1.
D) The mean of Insecticide 1 is equal to the mean of Insecticide 4.
Question
Question
Question
Question
Question
A farmer has a 160 acre tract of land that he is planting in corn. He has heard about advances in fertilizertechnology that impacts yield. He divides his field into four sections and each section into four parts. He hasthree type of fertilizer to test and no fertilizer. He randomly selects a part of a section and then randomlyselects a type of fertilizer for that part of a section so that each section has all four applications applied to it.The yields in bushel per acres are given below. Test at α = 0.05 if there is a difference in yields. 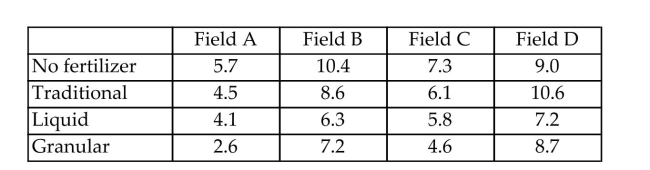
A) Fertilizer does result in significantly different yields.
B) Fertilizer does not result in significantly different yields.
A) Fertilizer does result in significantly different yields.
B) Fertilizer does not result in significantly different yields.
Question
The grade point averages of students participating in sports at a local community college are to be compared.The data are listed below. Which of the following is a correct statement about the means? Use α = 0.05. 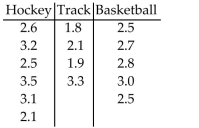
A) The mean grade point average of hockey players is the same as the mean grade point average of basketball players.
B) The mean grade point average of hockey players is the same as the mean grade point average of track participants.
C) The mean grade point average of basketball players is the same as the mean grade point average of track participants.
D) The mean grade point average of each sport is the same.
Question
Question
Question
A) no interaction
B) significant interaction
C) some interaction
Question
Question
Question
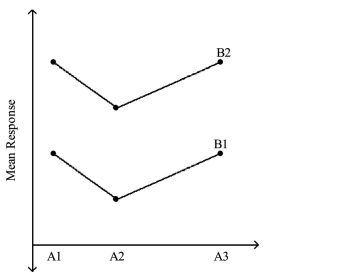
A builder has two crews that construct homes. He is interested in determining if there is a difference in thetime it takes the crews to build three different styles of homes. The time in days for each crew is given below.What type of interaction is revealed by the interaction plot? Test at α = 0.05. 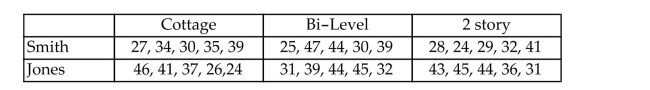
A) No interaction
B) Significant interaction
C) Some interaction
D) Complete interaction
A) No interaction
B) Significant interaction
C) Some interaction
D) Complete interaction
Question
A training program is supposed to develop self confidence in managers. The two-week program isadministered to six males and six females. All participants are tested after the end of the first week and afterthe end of the second week. The scores of those tests are given below. What type of interaction is revealed bythe interaction plot? Test at α = 0.05. 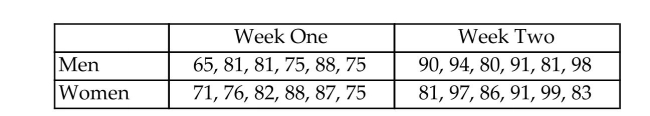
A) No interaction
B) Significant interaction
C) Some interaction
D) Complete interaction
A) No interaction
B) Significant interaction
C) Some interaction
D) Complete interaction
Question
Question
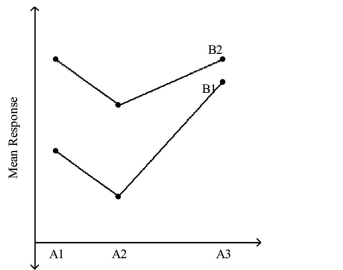
A) some interaction
B) significant interaction
C) no interaction
Question
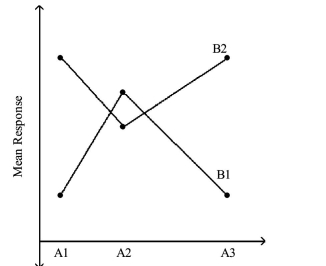
A) significant interaction
B) no interaction
C) some interaction
Question
Question
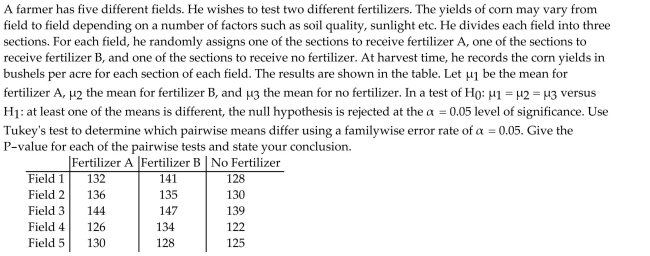
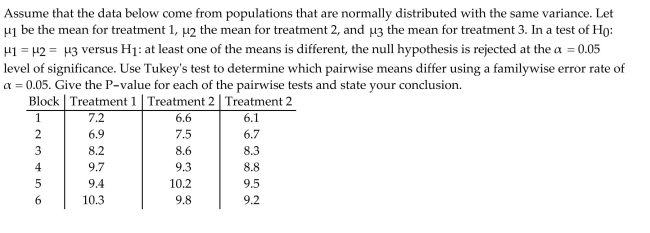
A two-way analysis of variance is to be performed using the data below. Assume that the data come frompopulations that are normally distributed with the same variance. If there is a significant difference in themeans for the three levels of factor A, use Tukeyʹs test to determine which pairwise means differ using afamilywise error rate of α = 0.05. If there is a significant difference in the means for the three levels of factor B,use Tukeyʹs test to determine which pairwise means differ using a familywise error rate of α = 0.05. 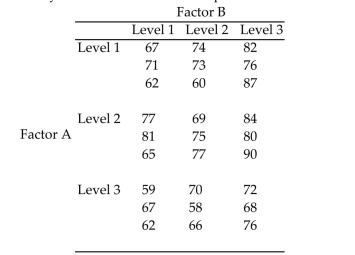

Unlock Deck
Sign up to unlock the cards in this deck!
Unlock Deck
Unlock Deck
1/51
Play
Full screen (f)
Deck 13: Comparing Three or More Means
1
Find the test statistic F to test the hypothesis that the populations have the same mean. Use α = 0.05.
A) 1.403
B) 1.021
C) 1.182
D) 0.832
A) 1.403
B) 1.021
C) 1.182
D) 0.832
A
2
Test the hypothesis that the populations have the same mean. Use α= 0.05.

3
The analysis of variance is an inferential method that is used to test the equality of
A) three or more population means.
B) three or more population variances.
C) two population means.
D) two population variances.
A) three or more population means.
B) three or more population variances.
C) two population means.
D) two population variances.
A
4
A realtor wishes to compare the square footage of houses in 4 different towns, all of which are pricedapproximately the same. The data are listed below. Can the realtor conclude that the mean square footage inthe four towns are equal? Use α = 0.01.
Unlock Deck
Unlock for access to all 51 flashcards in this deck.
Unlock Deck
k this deck
5
Four different types of insecticides are used on strawberry plants. The number of strawberries on eachrandomly selected plant is given below. Test the hypothesis that the type of insecticide makes no difference inthe mean number of strawberries per plant. Use α = 0.01.
Unlock Deck
Unlock for access to all 51 flashcards in this deck.
Unlock Deck
k this deck
6
A researcher wishes to determine whether there is a difference in the average age of middle school, highschool, and college teachers. Teachers are randomly selected. Their ages are recorded. State the requirementsthat must be satisfied in order to use the one-way ANOVA procedure.
Unlock Deck
Unlock for access to all 51 flashcards in this deck.
Unlock Deck
k this deck
7
Four different types of insecticides are used on strawberry plants. The number of strawberries on eachrandomly selected plant is given below. Find the critical value F-value to test the hypothesis that the type ofinsecticide makes no difference in the mean number of strawberries per plant. Use α = 0.01.
A) 4.94
B) 4.43
C) 26.69
D) 4.18
A) 4.94
B) 4.43
C) 26.69
D) 4.18
Unlock Deck
Unlock for access to all 51 flashcards in this deck.
Unlock Deck
k this deck
8
Four different types of insecticides are used on strawberry plants. The number of strawberries on eachrandomly selected plant is recorded. State the requirements that must be satisfied in order to use the one-wayANOVA procedure.
Unlock Deck
Unlock for access to all 51 flashcards in this deck.
Unlock Deck
k this deck
9
The grade point averages of students participating in sports at a local college are to be compared. The data arelisted below. Test the hypothesis that there is no difference in the mean grade point averages of the 3 groups.Use α = 0.05.
Unlock Deck
Unlock for access to all 51 flashcards in this deck.
Unlock Deck
k this deck
10
How, in general, is the requirement of equal population variances to allow the use of analysis of variancemethod verified?
A) The largest sample standard deviation must be less than or equal to twice the smallest sample standard deviation.
B) All three sample standard deviations must be equal.
C) The largest sample standard deviation is equal to the sum of the other standard deviations.
D) The largest sample standard deviation is less than or equal to the variance of the smallest sample.
Unlock Deck
Unlock for access to all 51 flashcards in this deck.
Unlock Deck
k this deck
11
The times (in minutes) to assemble a component for 3 different cell phones are listed below. Workers arerandomly selected. Test the hypothesis that there is no difference in the mean time for each cell phone. Use α =0.01.
Unlock Deck
Unlock for access to all 51 flashcards in this deck.
Unlock Deck
k this deck
12
A researcher wishes to determine whether there is a difference in the average age of middle school, highschool, and college teachers. Teachers are randomly selected. Their ages are recorded below. Find the teststatistic F to test the hypothesis that there is no difference in the average age of each group. Use α = 0.01.
A) 2.517
B) 2.913
C) 3.189
D) 4.312
A) 2.517
B) 2.913
C) 3.189
D) 4.312
Unlock Deck
Unlock for access to all 51 flashcards in this deck.
Unlock Deck
k this deck
13
A researcher wishes to determine whether there is a difference in the average age of middle school, highschool, and college teachers. Teachers are randomly selected. Their ages are recorded below. Test thehypothesis that there is no difference in the average age of each group. Use α = 0.01.
Unlock Deck
Unlock for access to all 51 flashcards in this deck.
Unlock Deck
k this deck
14
A medical researcher wishes to try three different techniques to lower cholesterol levels of patients with highcholesterol levels. The subjects are randomly selected and assigned to one of three groups. Group 1 is givenmedication, Group 2 is given an exercise program, and Group 3 is assigned a diet program. At the end of sixweeks, each subject?s cholesterol level is recorded. Find the critical value F-value to test the hypothesis thatthere is no difference among the means. Use ? = 0.05.
A) 3.68
B) 19.43
C) 4.77
D) 39.43
A) 3.68
B) 19.43
C) 4.77
D) 39.43
Unlock Deck
Unlock for access to all 51 flashcards in this deck.
Unlock Deck
k this deck
15
A medical researcher wishes to try three different techniques to lower cholesterol levels of patients with highcholesterol levels. The subjects are randomly selected and assigned to one of three groups. Group 1 is givenmedication, Group 2 is given an exercise program, and Group 3 is assigned a diet program. At the end of sixweeks, each subjectʹs cholesterol level is recorded. State the requirements that must be satisfied in order to usethe one-way ANOVA procedure.
Unlock Deck
Unlock for access to all 51 flashcards in this deck.
Unlock Deck
k this deck
16
A medical researcher wishes to try three different techniques to lower cholesterol levels of patients with highcholesterol levels. The subjects are randomly selected and assigned to one of three groups. Group 1 is givenmedication, Group 2 is given an exercise program, and Group 3 is assigned a diet program. At the end of sixweeks, each subjectʹs cholesterol level is recorded. Test the hypothesis that there is no difference among themeans. Use α = 0.05.
Unlock Deck
Unlock for access to all 51 flashcards in this deck.
Unlock Deck
k this deck
17
A researcher wishes to determine whether there is a difference in the average age of middle school, highschool, and college teachers. Teachers are randomly selected. Their ages are recorded below. Find the criticalvalue F-value to test the hypothesis that there is no difference in the average age of each group. Useα = 0.01.
A) 6.36
B) 5.09
C) 9.43
D) 5.42
A) 6.36
B) 5.09
C) 9.43
D) 5.42
Unlock Deck
Unlock for access to all 51 flashcards in this deck.
Unlock Deck
k this deck
18
Find the critical F0-value to test the hypothesis that the populations have the same mean. Use α= 0.05.
A) 3.49
B) 3.210
C) 2.819
D) 1.892
A) 3.49
B) 3.210
C) 2.819
D) 1.892
Unlock Deck
Unlock for access to all 51 flashcards in this deck.
Unlock Deck
k this deck
19
A medical researcher wishes to try three different techniques to lower cholesterol levels of patients with highcholesterol levels. The subjects are randomly selected and assigned to one of three groups. Group 1 is givenmedication, Group 2 is given an exercise program, and Group 3 is assigned a diet program. At the end of sixweeks, each subject?s cholesterol level is recorded. Find the test statistic F to test the hypothesis that there is nodifference among the means. Use ? = 0.05.
A) 11.095
B) 9.812
C) 8.369
D) 12.162
A) 11.095
B) 9.812
C) 8.369
D) 12.162
Unlock Deck
Unlock for access to all 51 flashcards in this deck.
Unlock Deck
k this deck
20
Four different types of insecticides are used on strawberry plants. The number of strawberries on eachrandomly selected plant is given below. Find the test statistic F to test the hypothesis that the type of insecticidemakes no difference in the mean number of strawberries per plant. Use α = 0.01.
A) 8.357
B) 8.123
C) 7.123
D) 6.912
A) 8.357
B) 8.123
C) 7.123
D) 6.912
Unlock Deck
Unlock for access to all 51 flashcards in this deck.
Unlock Deck
k this deck
21
A researcher wishes to determine whether there is a difference in the average age of middle school, highschool, and college teachers. Teachers are randomly selected. Their ages are recorded below. Use α = 0.01.Which of the following is a correct statement about the means?
A) There is not enough evidence to suggest that the means are different.
B) The mean age of middle school teachers is different from the mean age of high school teachers.
C) The mean age of middle school teachers is different from the mean age of college teachers.
D) The mean age of high school teachers is different from the mean age of college teachers.
Unlock Deck
Unlock for access to all 51 flashcards in this deck.
Unlock Deck
k this deck
22
A certain HMO is attempting to show the benefits of managed care to an insurance company. The HMObelieves that certain types of doctors are more cost-effective than others. One theory is that Certification Levelis an important factor in measuring the cost-effectiveness of physicians. To investigate this, the HMO obtainedindependent random samples of 20 physicians from each of the three certification levels-- Board certified (C);Uncertified, board eligible (E); and Uncertified, board ineligible (I)-- and recorded the total per member permonth charges for each (a total of 60 physicians). In order to compare the mean charges for the three groups,the data will be subjected to an analysis of variance. The results of the ANOVA are summarized in thefollowing table. Take α = 0.01. Interpret the P-value of the ANOVA F test.
A) The means of the total per member per month charges for the three groups of physicians differ at α = 0.01.
B) The model is not statistically useful (at α = 0.01) for prediction purposes.
C) The variances of the total per number per month charges for the three groups of physicians differ at α = 0.01.
D) The means of the total per member per month charges for the three groups of physicians are equal at α = 0.01.
Unlock Deck
Unlock for access to all 51 flashcards in this deck.
Unlock Deck
k this deck
23
A realtor wishes to compare the square footage of houses in 4 different towns, all of which are pricedapproximately the same. The data are listed below. Use α = 0.01. Which of the following is correct?
A) The mean square footage of houses in Town 2 is equal to the mean square footage in Town 3.
B) The mean square footage of houses in Town 1 is equal to the mean square footage in Town 2.
C) The mean square footage of houses in Town 3 is equal to the mean square footage in Town 4.
D) The mean square footage of houses in Town 4 is equal to the mean square footage in Town 1.
Unlock Deck
Unlock for access to all 51 flashcards in this deck.
Unlock Deck
k this deck
24
Unlock Deck
Unlock for access to all 51 flashcards in this deck.
Unlock Deck
k this deck
25
The times (in minutes) to assemble a component for three different cell phones are listed below. Use α= 0.01.Which of the following is correct?
A) The mean time to assemble Phone 1 is the same as the mean time to assemble Phone 2.
B) The mean time to assemble Phone 1 is different from the mean time to assemble Phone 3.
C) The mean time to assemble Phone 2 is the same as the mean time to assemble Phone 3.
D) There is not enough evidence to suggest that the means are different.
Unlock Deck
Unlock for access to all 51 flashcards in this deck.
Unlock Deck
k this deck
26
A medical researcher wishes to try three different techniques to lower cholesterol levels of patients with highcholesterol levels. The subjects are randomly selected and assigned to one of three groups. Group 1 is givenmedication, Group 2 is given an exercise program, and Group 3 is assigned a diet program. At the end of sixweeks, each subjectʹs cholesterol level is recorded. Use α = 0.05. Which of the following is a correct statementabout the means?
A) The mean of Group 1 is not equal to the mean of Group 2.
B) The mean of Group 1 is not equal to the mean of Group 3.
C) The mean of Group 2 is not equal to the mean of Group 3.
D) All of the means are not equal.
A) The mean of Group 1 is not equal to the mean of Group 2.
B) The mean of Group 1 is not equal to the mean of Group 3.
C) The mean of Group 2 is not equal to the mean of Group 3.
D) All of the means are not equal.
Unlock Deck
Unlock for access to all 51 flashcards in this deck.
Unlock Deck
k this deck
27
A certain HMO is attempting to show the benefits of managed care to an insurance company. The HMObelieves that certain types of doctors are more cost-effective than others. One theory is that Certification Levelis an important factor in measuring the cost-effectiveness of physicians. To investigate this, the HMO obtainedindependent random samples of 19 physicians from each of the three certification levels-- Board certified (C);Uncertified, board eligible (E); and Uncertified, board ineligible (I)-- and recorded the total per-member,per-month charges for each (a total of 19 physicians). In order to compare the mean charges for the threegroups, the data will be subjected to an analysis of variance.Write the null hypothesis tested by the ANOVA.
Unlock Deck
Unlock for access to all 51 flashcards in this deck.
Unlock Deck
k this deck
28
A researcher is testing the percent weight gain on mice of varying ages based upon the diet they eat. He has 4mice in each age category: 6 months, 9 months, 12 months and 15 months. They mice are weighed, fed onlyone of four diets and weighed after 1 month. The weight gain percent is then recorded. The data is givenbelow. Test at α = 0.05 if there is a difference in weights.
A) Diet does result in significantly different weight gains.
B) Diet does not result in significantly different weight gains.
A) Diet does result in significantly different weight gains.
B) Diet does not result in significantly different weight gains.
Unlock Deck
Unlock for access to all 51 flashcards in this deck.
Unlock Deck
k this deck
29
Find the critical value from the Studentized range distribution for H0: μ1 = μ2 = μ3 = μ4 = μ5, with n = 18 atα = 0.01.
A) 5.727
B) 5.404
C) 5.379
D) 5.094
A) 5.727
B) 5.404
C) 5.379
D) 5.094
Unlock Deck
Unlock for access to all 51 flashcards in this deck.
Unlock Deck
k this deck
30
Unlock Deck
Unlock for access to all 51 flashcards in this deck.
Unlock Deck
k this deck
31
Which of the following is not an example of a mean square?
Unlock Deck
Unlock for access to all 51 flashcards in this deck.
Unlock Deck
k this deck
32
A researcher wishes to test against :at least one of the means is different. Based on the ANOVA table below, what is the mean square due to error?
A) 3.28
B) 13.11
C) 0.444
D) 0.136
A) 3.28
B) 13.11
C) 0.444
D) 0.136
Unlock Deck
Unlock for access to all 51 flashcards in this deck.
Unlock Deck
k this deck
33
Four different types of insecticides are used on strawberry plants. The number of strawberries on eachrandomly selected plant is given below. Use α = 0.01. Which of the following is a correct statement about themeans?
A) The mean of Insecticide 1 is equal to the mean of Insecticide 2.
B) The mean of Insecticide 2 is equal to the mean of Insecticide 3.
C) The mean of Insecticide 3 is equal to the mean of Insecticide 1.
D) The mean of Insecticide 1 is equal to the mean of Insecticide 4.
A) The mean of Insecticide 1 is equal to the mean of Insecticide 2.
B) The mean of Insecticide 2 is equal to the mean of Insecticide 3.
C) The mean of Insecticide 3 is equal to the mean of Insecticide 1.
D) The mean of Insecticide 1 is equal to the mean of Insecticide 4.
Unlock Deck
Unlock for access to all 51 flashcards in this deck.
Unlock Deck
k this deck
34
Unlock Deck
Unlock for access to all 51 flashcards in this deck.
Unlock Deck
k this deck
35
An industrial psychologist is investigating the effects of work environment on employee attitudes. A group of20 recently hired sales trainees were randomly assigned to one of four different ?home rooms? - five traineesper room. Each room is identical except for wall color. The four colors used were light green, light blue, grayand red. The psychologist wants to know whether room color has an effect on attitude, and, if so, wants tocompare the mean attitudes of the trainees assigned to the four room colors. At the end of the trainingprogram, the attitude of each trainee was measured on a 60-pt. scale (the lower the score, the poorer theattitude). The data was subjected to a one-way analysis of variance. At ? = 0.05, what would be the bestinterpretation? ONE-WAY ANOVA FOR ATTITUDE BY COLOR
A) At , it can be said that color doesn't matter
B) At , light green has a higher mean than gray
C) At , it can be said that at least one color has a different mean
D) At , red is the best color
A) At , it can be said that color doesn't matter
B) At , light green has a higher mean than gray
C) At , it can be said that at least one color has a different mean
D) At , red is the best color
Unlock Deck
Unlock for access to all 51 flashcards in this deck.
Unlock Deck
k this deck
36
Four different leadership styles (A, B, C, and D) used by Big-Six accountants were investigated. As part of adesigned study, 15 accountants were randomly selected from each of the four leadership style groups (a total of60 accountants). Each accountant was asked to rate the degree to which their subordinates performedsubstandard field work on a 10-point scale -- called the ?substandard work scale?. The objective is to comparethe mean substandard work scales of the four leadership styles. The data on substandard work scales for all 60observations were subjected to an analysis of variance. Interpret the results of the ANOVA test shown on theprintout for ? = 0.05. ONE-WAY ANOVA FOR SUBSTAND BY STYLE
A) At , there is sufficient evidence of differences among the substandard work scale means for the four leadership styles.
B) At , there is no evidence of interaction.
C) At , nothing can be said.
D) At , there is insufficient evidence of differences among the substandard work scale means for the four leadership styles.
Unlock Deck
Unlock for access to all 51 flashcards in this deck.
Unlock Deck
k this deck
37
Find the critical value from the Studentized range distribution for α = 0.01, ν = 10, k = 4.
A) 5.769
B) 12.27
C) 6.136
D) 6.686
A) 5.769
B) 12.27
C) 6.136
D) 6.686
Unlock Deck
Unlock for access to all 51 flashcards in this deck.
Unlock Deck
k this deck
38
A farmer has a 160 acre tract of land that he is planting in corn. He has heard about advances in fertilizertechnology that impacts yield. He divides his field into four sections and each section into four parts. He hasthree type of fertilizer to test and no fertilizer. He randomly selects a part of a section and then randomlyselects a type of fertilizer for that part of a section so that each section has all four applications applied to it.The yields in bushel per acres are given below. Test at α = 0.05 if there is a difference in yields.
A) Fertilizer does result in significantly different yields.
B) Fertilizer does not result in significantly different yields.
A) Fertilizer does result in significantly different yields.
B) Fertilizer does not result in significantly different yields.
Unlock Deck
Unlock for access to all 51 flashcards in this deck.
Unlock Deck
k this deck
39
The grade point averages of students participating in sports at a local community college are to be compared.The data are listed below. Which of the following is a correct statement about the means? Use α = 0.05.
A) The mean grade point average of hockey players is the same as the mean grade point average of basketball players.
B) The mean grade point average of hockey players is the same as the mean grade point average of track participants.
C) The mean grade point average of basketball players is the same as the mean grade point average of track participants.
D) The mean grade point average of each sport is the same.
Unlock Deck
Unlock for access to all 51 flashcards in this deck.
Unlock Deck
k this deck
40
An industrial psychologist is investigating the effects of work environment on employee attitudes. A group of20 recently hired sales trainees were randomly assigned to one of four different ?home rooms? - five traineesper room. Each room is identical except for wall color. The four colors used were light green, light blue, grayand red. The psychologist wants to know whether room color has an effect on attitude, and, if so, wants tocompare the mean attitudes of the trainees assigned to the four room colors. At the end of the trainingprogram, the attitude of each trainee was measured on a 60-pt. scale (the lower the score, the poorer theattitude). The data was subjected to a one-way analysis of variance. Give the null hypothesis for the ANOVA Ftest shown on the printout. ONE-WAY ANOVA FOR ATTITUDE BY COLOR
A) reen , where the
B) , where the represent attitude means for the ith person in each room
C) , where the s represent the room colors
D) Pgreen Pblue Pgray pred, where the p's represent the proportion with the corresponding attitude
A) reen , where the
B) , where the represent attitude means for the ith person in each room
C) , where the s represent the room colors
D) Pgreen Pblue Pgray pred, where the p's represent the proportion with the corresponding attitude
Unlock Deck
Unlock for access to all 51 flashcards in this deck.
Unlock Deck
k this deck
41
True or False: It is required for the Two-Way ANOVA that the samples be dependent.
Unlock Deck
Unlock for access to all 51 flashcards in this deck.
Unlock Deck
k this deck
42
A) no interaction
B) significant interaction
C) some interaction
Unlock Deck
Unlock for access to all 51 flashcards in this deck.
Unlock Deck
k this deck
43
True or False: It is required for the Two-Way ANOVA that the populations all have the same variance.
Unlock Deck
Unlock for access to all 51 flashcards in this deck.
Unlock Deck
k this deck
44
Why is the completely randomized block design not always sufficient?13.4 Two-Way Analysis of Variance1 Analyze a two-way ANOVA design, and perform the Tukey test as needed.
Unlock Deck
Unlock for access to all 51 flashcards in this deck.
Unlock Deck
k this deck
45
A builder has two crews that construct homes. He is interested in determining if there is a difference in thetime it takes the crews to build three different styles of homes. The time in days for each crew is given below.What type of interaction is revealed by the interaction plot? Test at α = 0.05.
A) No interaction
B) Significant interaction
C) Some interaction
D) Complete interaction
A) No interaction
B) Significant interaction
C) Some interaction
D) Complete interaction
Unlock Deck
Unlock for access to all 51 flashcards in this deck.
Unlock Deck
k this deck
46
A training program is supposed to develop self confidence in managers. The two-week program isadministered to six males and six females. All participants are tested after the end of the first week and afterthe end of the second week. The scores of those tests are given below. What type of interaction is revealed bythe interaction plot? Test at α = 0.05.
A) No interaction
B) Significant interaction
C) Some interaction
D) Complete interaction
A) No interaction
B) Significant interaction
C) Some interaction
D) Complete interaction
Unlock Deck
Unlock for access to all 51 flashcards in this deck.
Unlock Deck
k this deck
47
True or False: It is required for the Two-Way ANOVA that the populations from which the samples are drawnare normal.
Unlock Deck
Unlock for access to all 51 flashcards in this deck.
Unlock Deck
k this deck
48
A) some interaction
B) significant interaction
C) no interaction
Unlock Deck
Unlock for access to all 51 flashcards in this deck.
Unlock Deck
k this deck
49
A) significant interaction
B) no interaction
C) some interaction
Unlock Deck
Unlock for access to all 51 flashcards in this deck.
Unlock Deck
k this deck
50
To conduct an analysis of variance on a randomized complete block design a researcher would use
A) a two-way ANOVA.
B) a one-way ANOVA.
C) a Tukey Test.
D) a Scheffeʹ Test.
A) a two-way ANOVA.
B) a one-way ANOVA.
C) a Tukey Test.
D) a Scheffeʹ Test.
Unlock Deck
Unlock for access to all 51 flashcards in this deck.
Unlock Deck
k this deck
51
A two-way analysis of variance is to be performed using the data below. Assume that the data come frompopulations that are normally distributed with the same variance. If there is a significant difference in themeans for the three levels of factor A, use Tukeyʹs test to determine which pairwise means differ using afamilywise error rate of α = 0.05. If there is a significant difference in the means for the three levels of factor B,use Tukeyʹs test to determine which pairwise means differ using a familywise error rate of α = 0.05.
Unlock Deck
Unlock for access to all 51 flashcards in this deck.
Unlock Deck
k this deck
Unlock Deck
Unlock for access to all 51 flashcards in this deck.


