Deck 9: Estimating the Value of a Parameter
Full screen (f)
Question
Question
Question
 interest.
 Question
Question
Question
A university dean is interested in determining the proportion of students who receive some sort of financial aid. Rather than examine the records for all students, the dean randomly selects 200 students and finds that 118 of them are receiving financial aid. Use a 95 % confidence interval to estimate the true proportion of students on financial aid. Express the answer in the form  and round to the nearest thousandth.
A)
B)
C)
D)
and round to the nearest thousandth.A)
B)
C)
D)
Question
Question
Question
Question
Question
 3 Find the sample size needed for estimating a population proportion within a given margin of error.
 Question
Question
Question
Question
Question
Question
Question
Question
Question
Question
Question
Question
Question
True or False? When choosing the sample size for estimating a population proportion p to within E units withconfidence 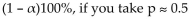 as the approximation to p, you will always obtain a sample size thatis at least as large as required.
as the approximation to p, you will always obtain a sample size thatis at least as large as required. Question
Question
Let t0 be a specific value of t. Find t0 such that the statement is true: 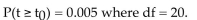
A) 2.845
B) -2.845
C) 2.861
D) -2.861
A) 2.845
B) -2.845
C) 2.861
D) -2.861
Question
Question
Question
Question
Question
Question
Question
To select the correct Studentʹs t-distribution requires knowing the degrees of freedom. How many degrees offreedom are there for a sample of size n? 
Question
Question
True or False: Every Studentʹs t-distribution with n  n the number in the sample and N the number in thepopulation, will be less peaked and have thinner tails.
n the number in the sample and N the number in thepopulation, will be less peaked and have thinner tails. Question
Question
Question
Question
Question
Question
Question
Question
The area under the graph of every Studentʹs t-distribution is 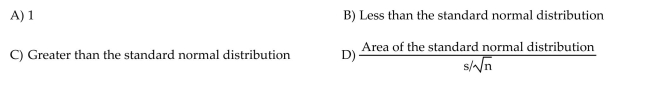 3 Construct and interpret a confidence interval for a population mean.
3 Construct and interpret a confidence interval for a population mean. Question
Question
Question
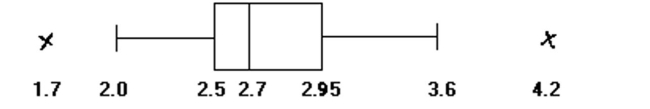
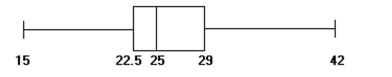
A) No; the data appear roughly normally distributed but there are outliers
B) Yes; the data appear normally distributed and there are no outliers
C) No, there are outliers and the data are not normally distributed
D) No, there are no outliers but the data are not normally distributed
Question
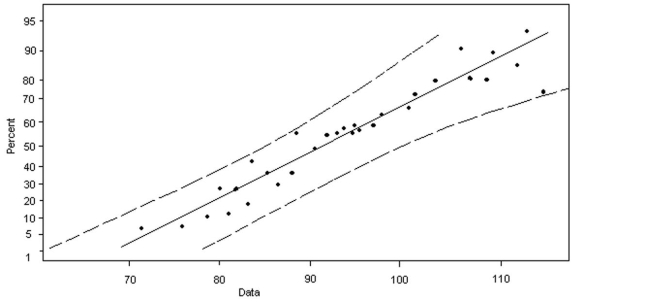
A) Yes; the data are roughly normally distributed and there are no outliers
B) No; the data are roughly normally distributed but there are outliers
C) No; the data are not normally distributed and there are outliers
D) No; there are no outliers, but the data are not normally distributed
Question
Question
Determine the point estimate of the population mean and margin of error for the confidence interval withlower bound 7 and upper bound: 25. 
Question
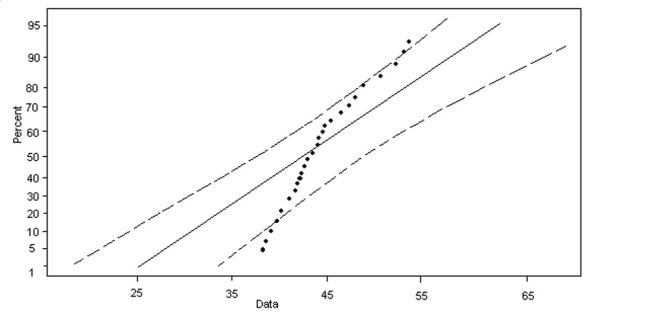
A) No; there are no outliers but the data are not normally distributed
B) Yes; the data are roughly normally distributed and there are no outliers
C) No; the data are roughly normally distributed, but there are outliers
D) No; the data are not normally distributed and there are outliers
Question
Question
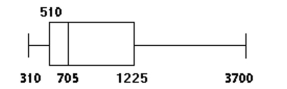
A) No, though there are no outliers, the data are not normally distributed but right skewed
B) No, there are outliers and the data are not normally distributed but right skewed
C) Yes; the data are normally distributed and there are no outliers
D) No; the data are normally distributed, but there are outliers
Question
Question
Question
Question
How much money does the average professional hockey fan spend on food at a single hockey game? Thatquestion was posed to 10 randomly selected hockey fans. The sampled results show that sample mean andstandard deviation were $19.00 and $2.6, respectively. Use this information to create a 95% confidence interval 
Question
Question
A) Yes; the data appear roughly normally distributed and there are no outliers
B) No; the data appear roughly normally distributed, but there are outliers
C) No; the data are not normally distributed and there are outliers
D) No; there are no outliers, but the data are not normally distributed
Question
Question
Question
Question
Question

A) 7.633 and 36.191
B) 6.844 and 27.204
C) 8.907 and 38.582
D) 10.117 and 32.852
Question

A) 6.571 and 23.685
B) 4.075 and 31.319
C) 4.660 and 29.131
D) 5.629 and 26.119
Question
True or False? When constructing a (1 - α) 100% confidence interval for a population variance  thepopulation from which the random sample is selected can have any distribution.
thepopulation from which the random sample is selected can have any distribution. Question
Question
Question
The best point estimate for the standard deviation of a population is
A) The standard deviation of the sample.
B) The variance of the population.
C) The variance of the sample.
A) The standard deviation of the sample.
B) The variance of the population.
C) The variance of the sample.
Question
Question
Question
Question
Assume that the heights of female executives are normally distributed. A random sample of 20 femaleexecutives have a mean height of 62.5 inches and a standard deviation of 1.8 inches. Construct a 98%confidence interval for the population variance, 
A) (1.7, 8.1)
B) (1.3, 2.8)
C) (0.9, 4.5)
D) (1.8, 8.5)
A) (1.7, 8.1)
B) (1.3, 2.8)
C) (0.9, 4.5)
D) (1.8, 8.5)
Question
The mean replacement time for a random sample of 12 cd players is 8.6 years with a standard deviation of 3.5years. Construct the 98% confidence interval for the population variance,  . Assume the data are normallydistributed
A) (5.4, 44.1)
B) (2.3, 6.6)
C) (1.6, 12.6)
D) (5.1, 37.7)
. Assume the data are normallydistributedA) (5.4, 44.1)
B) (2.3, 6.6)
C) (1.6, 12.6)
D) (5.1, 37.7)
Question

A) 3.816 and 21.920
B) 3.053 and 24.725
C) 4.575 and 26.757
D) 2.603 and 19.675
Question
Question
Assume that the heights of bookcases are normally distributed. A random sample of 16 bookcases in onecompany have a mean height of 67.5 inches and a standard deviation of 2.1 inches. Construct a 99% confidenceinterval for the population standard deviation, 
A) (1.4, 3.8)
B) (1.5, 3.9)
C) (1.0, 2.6)
D) (1.5, 3.6)
A) (1.4, 3.8)
B) (1.5, 3.9)
C) (1.0, 2.6)
D) (1.5, 3.6)
Question

A) 1.735 and 23.587
B) 2.156 and 25.188
C) 2.088 and 21.666
D) 2.558 and 23.209
Question
Question
Question

Unlock Deck
Sign up to unlock the cards in this deck!
Unlock Deck
Unlock Deck
1/88
Play
Full screen (f)
Deck 9: Estimating the Value of a Parameter
1
Many people think that a national lobbyʹs successful fight against gun control legislation is reflecting the will ofa minority of Americans. A random sample of 4000 citizens yielded 2250 who are in favor of gun controllegislation. Estimate the true proportion of all Americans who are in favor of gun control legislation using a^99% confidence interval. Express the answer in the form p ± E and round to the nearest ten-thousandth.
A) 0.5625 ± 0.0202
B) 0.5625 ± 0.6337
C) 0.4375 ± 0.0202
D) 0.4375 ± 0.6337
A) 0.5625 ± 0.0202
B) 0.5625 ± 0.6337
C) 0.4375 ± 0.0202
D) 0.4375 ± 0.6337
A
2
When 385 junior college students were surveyed,170 said that they have previously owned a motorcycle. Finda point estimate for p, the population proportion of students who have previously owned a motorcycle.
A) 0.442
B) 0.558
C) 0.791
D) 0.306
A) 0.442
B) 0.558
C) 0.791
D) 0.306
A
3
interest.True
4
An article a Florida newspaper reported on the topics that teenagers most want to discuss with their parents.The findings, the results of a poll, showed that 46% would like more discussion about the familyʹs financialsituation, 37% would like to talk about school, and 30% would like to talk about religion. These and otherpercentages were based on a national sampling of 546 teenagers. Estimate the proportion of all teenagers who^want more family discussions about school. Use a 95% confidence level. Express the answer in the form p ± Eand round to the nearest thousandth.
A) 0.37 ± 0.040
B) 0.37 ± 0.002
C) 0.63 ± 0.040
D) 0.63 ± 0.002
A) 0.37 ± 0.040
B) 0.37 ± 0.002
C) 0.63 ± 0.040
D) 0.63 ± 0.002
Unlock Deck
Unlock for access to all 88 flashcards in this deck.
Unlock Deck
k this deck
5
A private opinion poll is conducted for a politician to determine what proportion of the population favorsadding more national parks. How large a sample is needed in order to be 90% confident that the sampleproportion will not differ from the true proportion by more than 5%?
A) 271
B) 164
C) 542
D) 9
A) 271
B) 164
C) 542
D) 9
Unlock Deck
Unlock for access to all 88 flashcards in this deck.
Unlock Deck
k this deck
6
A university dean is interested in determining the proportion of students who receive some sort of financial aid. Rather than examine the records for all students, the dean randomly selects 200 students and finds that 118 of them are receiving financial aid. Use a 95 % confidence interval to estimate the true proportion of students on financial aid. Express the answer in the form and round to the nearest thousandth.
A)
B)
C)
D)
and round to the nearest thousandth.A)
B)
C)
D)
Unlock Deck
Unlock for access to all 88 flashcards in this deck.
Unlock Deck
k this deck
7
A survey of 2690 musicians showed that 368 of them are left-handed. Find a point estimate for p, thepopulation proportion of musicians that are left-handed.
A) 0.137
B) 0.863
C) 0.158
D) 0.120
A) 0.137
B) 0.863
C) 0.158
D) 0.120
Unlock Deck
Unlock for access to all 88 flashcards in this deck.
Unlock Deck
k this deck
8
A pollster wishes to estimate the number of left-handed scientists. How large a sample is needed in order to be95% confident that the sample proportion will not differ from the true proportion by more than 6%? A previousstudy indicates that the proportion of left-handed scientists is 9%.
A) 88
B) 62
C) 97
D) 27
A) 88
B) 62
C) 97
D) 27
Unlock Deck
Unlock for access to all 88 flashcards in this deck.
Unlock Deck
k this deck
9
A survey of 100 fatal accidents showed that in 43 cases the driver at fault was inadequately insured. Find apoint estimate for p, the population proportion of accidents where the driver at fault was inadequately insured
A) 0.43
B) 0.57
C) 0.754
D) 0.301
A) 0.43
B) 0.57
C) 0.754
D) 0.301
Unlock Deck
Unlock for access to all 88 flashcards in this deck.
Unlock Deck
k this deck
10
95%
A) 1.96
B) 1.645
C) 0.83
D) 1.68
A) 1.96
B) 1.645
C) 0.83
D) 1.68
Unlock Deck
Unlock for access to all 88 flashcards in this deck.
Unlock Deck
k this deck
11
3 Find the sample size needed for estimating a population proportion within a given margin of error. Unlock Deck
Unlock for access to all 88 flashcards in this deck.
Unlock Deck
k this deck
12
Many people think that a national lobbyʹs successful fight against gun control legislation is reflecting the will ofa minority of Americans. A random sample of 4000 citizens yielded 2130 who are in favor of gun controllegislation. Find the point estimate for estimating the proportion of all Americans who are in favor of guncontrol legislation.
A) 0.5325
B) 2130
C) 4000
D) 0.4675
A) 0.5325
B) 2130
C) 4000
D) 0.4675
Unlock Deck
Unlock for access to all 88 flashcards in this deck.
Unlock Deck
k this deck
13
88%
A) 1.555
B) 1.175
C) 0.81
D) 1.21
A) 1.555
B) 1.175
C) 0.81
D) 1.21
Unlock Deck
Unlock for access to all 88 flashcards in this deck.
Unlock Deck
k this deck
14
A survey of 700 non-fatal accidents showed that 143 involved faulty equipment. Find a point estimate for p,the population proportion of accidents that involved faulty equipment.
A) 0.204
B) 0.796
C) 0.257
D) 0.170
A) 0.204
B) 0.796
C) 0.257
D) 0.170
Unlock Deck
Unlock for access to all 88 flashcards in this deck.
Unlock Deck
k this deck
15
A researcher at a major clinic wishes to estimate the proportion of the adult population of the United States thathas sleep deprivation. How large a sample is needed in order to be 95% confident that the sample proportionwill not differ from the true proportion by more than 4%?
A) 601
B) 13
C) 1201
D) 423
A) 601
B) 13
C) 1201
D) 423
Unlock Deck
Unlock for access to all 88 flashcards in this deck.
Unlock Deck
k this deck
16
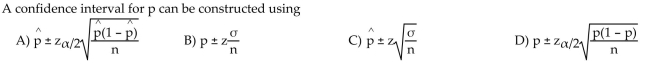
What is the best point estimate for p in order to construct a confidence interval for p ?
A)
B)
C)
D)
A)
B)
C)
D)
Unlock Deck
Unlock for access to all 88 flashcards in this deck.
Unlock Deck
k this deck
17
A marketing research company needs to estimate which of two medical plans its employees prefer. A randomsample of n employees produced the following 98% confidence interval for the proportion of employees whoprefer plan A: (0.241, 0.561). Identify the point estimate for estimating the true proportion of employees whoprefer that plan.
A) 0.401
B) 0.16
C) 0.241
D) 0.561
A) 0.401
B) 0.16
C) 0.241
D) 0.561
Unlock Deck
Unlock for access to all 88 flashcards in this deck.
Unlock Deck
k this deck
18
A senator wishes to estimate the proportion of United States voters who favor abolishing the Electoral College.How large a sample is needed in order to be 99% confident that the sample proportion will not differ from thetrue proportion by more than 3%?
A) 1842
B) 1509
C) 22
D) 3684
A) 1842
B) 1509
C) 22
D) 3684
Unlock Deck
Unlock for access to all 88 flashcards in this deck.
Unlock Deck
k this deck
19
A survey of 250 households showed 91 owned at least one snow blower. Find a point estimate for p, thepopulation proportion of households that own at least one snow blower.
A) 0.364
B) 0.636
C) 0.572
D) 0.267
A) 0.364
B) 0.636
C) 0.572
D) 0.267
Unlock Deck
Unlock for access to all 88 flashcards in this deck.
Unlock Deck
k this deck
20
In a survey of 10 musicians, 2 were found to be left-handed. Is it practical to construct the 90% confidenceinterval for the population proportion, p? Explain.
Unlock Deck
Unlock for access to all 88 flashcards in this deck.
Unlock Deck
k this deck
21
A computer package was used to generate the following printout for estimating the sale price of condominiumsin a particular neighborhood.
What assumptions are necessary for any inferences derived from this printout to be valid?
A) The sample was randomly selected from an approximately normal population.
B) The sample variance equals the population variance.
C) The population mean has an approximate normal distribution.
D) All of these are necessary.
Unlock Deck
Unlock for access to all 88 flashcards in this deck.
Unlock Deck
k this deck
22
A computer package was used to generate the following printout for estimating the sale price of condominiumsin a particular neighborhood.
A friend suggests that the mean sale price of homes in this neighborhood is $43,000. Comment on your friend?ssuggestion.
A) Based on this printout, all you can say is that the mean sale price might be $43,000.
B) Your friend is wrong, and you are 90% certain.
C) Your friend is correct, and you are 90% certain.
D) Your friend is correct, and you are 100% certain.
Unlock Deck
Unlock for access to all 88 flashcards in this deck.
Unlock Deck
k this deck
23
A local outdoor equipment store is being sold. The buyers are trying to estimate the percentage of items thatare outdated. They will randomly sample among its 100,000 items in order to determine the proportion ofmerchandise that is outdated. The current owners have never determined their outdated percentage and cannot help the buyers. Approximately how large a sample do the buyers need in order to insure that they are 95%confident that the margin of error is within 3%?
A) 1068
B) 2135
C) 4269
D) 545
A) 1068
B) 2135
C) 4269
D) 545
Unlock Deck
Unlock for access to all 88 flashcards in this deck.
Unlock Deck
k this deck
24
True or False? When choosing the sample size for estimating a population proportion p to within E units withconfidence as the approximation to p, you will always obtain a sample size thatis at least as large as required.
as the approximation to p, you will always obtain a sample size thatis at least as large as required. Unlock Deck
Unlock for access to all 88 flashcards in this deck.
Unlock Deck
k this deck
25
True or False? If no estimate of p exists when determining the sample size, we can use 0.5 in the formula to geta value for n.
Unlock Deck
Unlock for access to all 88 flashcards in this deck.
Unlock Deck
k this deck
26
Let t0 be a specific value of t. Find t0 such that the statement is true:
A) 2.845
B) -2.845
C) 2.861
D) -2.861
A) 2.845
B) -2.845
C) 2.861
D) -2.861
Unlock Deck
Unlock for access to all 88 flashcards in this deck.
Unlock Deck
k this deck
27
A confidence interval was used to estimate the proportion of math majors that are female. A random sample of72 math majors generated the following confidence interval: (0.438, 0.642). Using the information above, whatsize sample would be necessary if we wanted to estimate the true proportion to within 3% using 98%reliability?
A) 1499
B) 1509
C) 1569
D) 1448
A) 1499
B) 1509
C) 1569
D) 1448
Unlock Deck
Unlock for access to all 88 flashcards in this deck.
Unlock Deck
k this deck
28
A researcher wishes to estimate the number of households with two computers. How large a sample is neededin order to be 98% confident that the sample proportion will not differ from the true proportion by more than2%? A previous study indicates that the proportion of households with two computers is 20%.
A) 2172
B) 1537
C) 2715
D) 3
A) 2172
B) 1537
C) 2715
D) 3
Unlock Deck
Unlock for access to all 88 flashcards in this deck.
Unlock Deck
k this deck
29
Find the t-value such that the area in the right tail is 0.2 with 5 degrees of freedom.
A) 0.920
B) 0.200
C) -0.92
D) 0.941
A) 0.920
B) 0.200
C) -0.92
D) 0.941
Unlock Deck
Unlock for access to all 88 flashcards in this deck.
Unlock Deck
k this deck
30
In a college student poll, it is of interest to estimate the proportion p of students in favor of changing from aquarter-system to a semester-system. How many students should be polled so that we can estimate p towithin 0.09 using a 99% confidence interval?
A) 205
B) 182
C) 261
D) 114
A) 205
B) 182
C) 261
D) 114
Unlock Deck
Unlock for access to all 88 flashcards in this deck.
Unlock Deck
k this deck
31
Suppose a 90% confidence interval for μ turns out to be (1000, 2100). If this interval was based on a sample ofsize n = 25, explain what assumptions are necessary for this interval to be valid.
A) The population must have an approximately normal distribution.
B) The sampling distribution of the sample mean must have a normal distribution.
C) The population of salaries must have an approximate t distribution.
D) The sampling distribution must be biased with 24 degrees of freedom.
A) The population must have an approximately normal distribution.
B) The sampling distribution of the sample mean must have a normal distribution.
C) The population of salaries must have an approximate t distribution.
D) The sampling distribution must be biased with 24 degrees of freedom.
Unlock Deck
Unlock for access to all 88 flashcards in this deck.
Unlock Deck
k this deck
32
Find the critical t-value that corresponds to 90% confidence and n = 15.
A) 1.345
B) 1.761
C) 2.145
D) 2.624
A) 1.345
B) 1.761
C) 2.145
D) 2.624
Unlock Deck
Unlock for access to all 88 flashcards in this deck.
Unlock Deck
k this deck
33
To select the correct Studentʹs t-distribution requires knowing the degrees of freedom. How many degrees offreedom are there for a sample of size n?
Unlock Deck
Unlock for access to all 88 flashcards in this deck.
Unlock Deck
k this deck
34
A university dean is interested in determining the proportion of students who receive some sort of financialaid. Rather than examine the records for all students, the dean randomly selects 200 students and finds that 118of them are receiving financial aid. If the dean wanted to estimate the proportion of all students receivingfinancial aid to within 1% with 90% reliability, how many students would need to be sampled?
A) 6546
B) 1584
C) 3980
D) 66
A) 6546
B) 1584
C) 3980
D) 66
Unlock Deck
Unlock for access to all 88 flashcards in this deck.
Unlock Deck
k this deck
35
True or False: Every Studentʹs t-distribution with n n the number in the sample and N the number in thepopulation, will be less peaked and have thinner tails.
n the number in the sample and N the number in thepopulation, will be less peaked and have thinner tails. Unlock Deck
Unlock for access to all 88 flashcards in this deck.
Unlock Deck
k this deck
36
Which of the following is not a characteristic of Studentsʹ t-distribution?
A) mean of 1
B) symmetric distribution
C) depends on degrees of freedom.
D) For large samples, the t and z distributions are nearly equivalent.
A) mean of 1
B) symmetric distribution
C) depends on degrees of freedom.
D) For large samples, the t and z distributions are nearly equivalent.
Unlock Deck
Unlock for access to all 88 flashcards in this deck.
Unlock Deck
k this deck
37
Many people think that a national lobbyʹs successful fight against gun control legislation is reflecting the will ofa minority of Americans. A previous random sample of 4000 citizens yielded 2250 who are in favor of guncontrol legislation. How many citizens would need to be sampled if a 99% confidence interval was desired toestimate the true proportion to within 1%?
A) 16,318
B) 17,240
C) 16,577
D) 15,251
A) 16,318
B) 17,240
C) 16,577
D) 15,251
Unlock Deck
Unlock for access to all 88 flashcards in this deck.
Unlock Deck
k this deck
38
Find the t-value such that the area left of the t-value is 0.025 with 17 degrees of freedom.
A) -2.11
B) -3.222
C) 2.110
D) 2.120
A) -2.11
B) -3.222
C) 2.110
D) 2.120
Unlock Deck
Unlock for access to all 88 flashcards in this deck.
Unlock Deck
k this deck
39
Find the critical t-value that corresponds to 95% confidence and n = 16.
A) 1.753
B) 2.131
C) 2.602
D) 2.947
A) 1.753
B) 2.131
C) 2.602
D) 2.947
Unlock Deck
Unlock for access to all 88 flashcards in this deck.
Unlock Deck
k this deck
40
Find the critical t-value that corresponds to 99% confidence and n = 10.
A) 2.821
B) 3.250
C) 2.262
D) 1.833
A) 2.821
B) 3.250
C) 2.262
D) 1.833
Unlock Deck
Unlock for access to all 88 flashcards in this deck.
Unlock Deck
k this deck
41
Construct a 98% confidence interval for the population mean, μ. Assume the population has a normaldistribution. A study of 14 car owners showed that their average repair bill was $192 with a standard deviationof $8. Round to the nearest cent.
A) ($186.33, $197.67)
B) ($222.33, $256.10)
C) ($328.33, $386.99)
D) ($115.40, $158.80)
A) ($186.33, $197.67)
B) ($222.33, $256.10)
C) ($328.33, $386.99)
D) ($115.40, $158.80)
Unlock Deck
Unlock for access to all 88 flashcards in this deck.
Unlock Deck
k this deck
42
A local bank needs information concerning the savings account balances of its customers. A random sample of15 accounts was checked. The mean balance was $686.75 with a standard deviation of $256.20. Find a 98%confidence interval for the true mean. Assume that the account balances are normally distributed. Round to thenearest cent.
A) ($513.17, $860.33)
B) ($238.23, $326.41)
C) ($326.21, $437.90)
D) ($487.31, $563.80)
A) ($513.17, $860.33)
B) ($238.23, $326.41)
C) ($326.21, $437.90)
D) ($487.31, $563.80)
Unlock Deck
Unlock for access to all 88 flashcards in this deck.
Unlock Deck
k this deck
43
The area under the graph of every Studentʹs t-distribution is 3 Construct and interpret a confidence interval for a population mean.
3 Construct and interpret a confidence interval for a population mean. Unlock Deck
Unlock for access to all 88 flashcards in this deck.
Unlock Deck
k this deck
44
Construct a 90% confidence interval for the population mean, μ. Assume the population has a normaldistribution. A sample of 15 randomly selected math majors has a grade point average of 2.86 with a standarddeviation of 0.78. Round to the nearest hundredth.
A) (2.51, 3.21)
B) (2.41, 3.42)
C) (2.37, 3.56)
D) (2.28, 3.66)
A) (2.51, 3.21)
B) (2.41, 3.42)
C) (2.37, 3.56)
D) (2.28, 3.66)
Unlock Deck
Unlock for access to all 88 flashcards in this deck.
Unlock Deck
k this deck
45
The grade point averages for 10 randomly selected junior college students are listed below. Assume the gradepoint averages are normally distributed. Find a 98% confidence interval for the true mean. Round to the nearesthundredth.2.0 3.2 1.8 2.9 0.9 4.0 3.3 2.9 3.6 0.8
A) (1.55, 3.53)
B) (0.67, 1.81)
C) (2.12, 3.14)
D) (3.11, 4.35)
A) (1.55, 3.53)
B) (0.67, 1.81)
C) (2.12, 3.14)
D) (3.11, 4.35)
Unlock Deck
Unlock for access to all 88 flashcards in this deck.
Unlock Deck
k this deck
46
A) No; the data appear roughly normally distributed but there are outliers
B) Yes; the data appear normally distributed and there are no outliers
C) No, there are outliers and the data are not normally distributed
D) No, there are no outliers but the data are not normally distributed
Unlock Deck
Unlock for access to all 88 flashcards in this deck.
Unlock Deck
k this deck
47
A) Yes; the data are roughly normally distributed and there are no outliers
B) No; the data are roughly normally distributed but there are outliers
C) No; the data are not normally distributed and there are outliers
D) No; there are no outliers, but the data are not normally distributed
Unlock Deck
Unlock for access to all 88 flashcards in this deck.
Unlock Deck
k this deck
48
Construct a 90% confidence interval for the population mean, μ. Assume the population has a normaldistribution. In a recent study of 22 eighth graders, the mean number of hours per week that they played videogames was 19.6 with a standard deviation of 5.8 hours. Round to the nearest hundredth.
A) (17.47, 21.73)
B) (18.63, 20.89)
C) (5.87, 7.98)
D) (19.62, 23.12)
A) (17.47, 21.73)
B) (18.63, 20.89)
C) (5.87, 7.98)
D) (19.62, 23.12)
Unlock Deck
Unlock for access to all 88 flashcards in this deck.
Unlock Deck
k this deck
49
Determine the point estimate of the population mean and margin of error for the confidence interval withlower bound 7 and upper bound: 25.
Unlock Deck
Unlock for access to all 88 flashcards in this deck.
Unlock Deck
k this deck
50
A) No; there are no outliers but the data are not normally distributed
B) Yes; the data are roughly normally distributed and there are no outliers
C) No; the data are roughly normally distributed, but there are outliers
D) No; the data are not normally distributed and there are outliers
Unlock Deck
Unlock for access to all 88 flashcards in this deck.
Unlock Deck
k this deck
51
What effect will an outlier have on a confidence interval that is based on a small sample size?
A) The confidence interval will be wider than an interval without the outlier.
B) The interval will be smaller than an interval without the outlier.
C) The interval will be the same with or without the outlier.
D) The interval will reveal exclusionary data.
A) The confidence interval will be wider than an interval without the outlier.
B) The interval will be smaller than an interval without the outlier.
C) The interval will be the same with or without the outlier.
D) The interval will reveal exclusionary data.
Unlock Deck
Unlock for access to all 88 flashcards in this deck.
Unlock Deck
k this deck
52
A) No, though there are no outliers, the data are not normally distributed but right skewed
B) No, there are outliers and the data are not normally distributed but right skewed
C) Yes; the data are normally distributed and there are no outliers
D) No; the data are normally distributed, but there are outliers
Unlock Deck
Unlock for access to all 88 flashcards in this deck.
Unlock Deck
k this deck
53
A random sample of 10 parking meters in a resort community showed the following incomes for a day.Assume the incomes are normally distributed. Find the 95% confidence interval for the true mean. Round tothe nearest cent.$3.60 $4.50 $2.80 $6.30 $2.60 $5.20 $6.75 $4.25 $8.00 $3.00
A) ($3.39, $6.01)
B) ($2.11, $5.34)
C) ($4.81, $6.31)
D) ($1.35, $2.85)
A) ($3.39, $6.01)
B) ($2.11, $5.34)
C) ($4.81, $6.31)
D) ($1.35, $2.85)
Unlock Deck
Unlock for access to all 88 flashcards in this deck.
Unlock Deck
k this deck
54
Construct a 95% confidence interval for the population mean, μ. Assume the population has a normaldistribution. A sample of 25 randomly English majors has a mean test score of 81.5 with a standard deviation of10.2. Round to the nearest hundredth.
A) (77.29, 85.71)
B) (56.12, 78.34)
C) (66.35, 69.89)
D) (87.12, 98.32)
A) (77.29, 85.71)
B) (56.12, 78.34)
C) (66.35, 69.89)
D) (87.12, 98.32)
Unlock Deck
Unlock for access to all 88 flashcards in this deck.
Unlock Deck
k this deck
55
Construct a 95% confidence interval for the population mean, μ. Assume the population has a normaldistribution. A random sample of 16 lithium batteries has a mean life of 645 hours with a standard deviation of31 hours. Round to the nearest tenth.
A) (628.5, 661.5)
B) (876.2, 981.5)
C) (531.2, 612.9)
D) (321.7, 365.8)
A) (628.5, 661.5)
B) (876.2, 981.5)
C) (531.2, 612.9)
D) (321.7, 365.8)
Unlock Deck
Unlock for access to all 88 flashcards in this deck.
Unlock Deck
k this deck
56
How much money does the average professional hockey fan spend on food at a single hockey game? Thatquestion was posed to 10 randomly selected hockey fans. The sampled results show that sample mean andstandard deviation were $19.00 and $2.6, respectively. Use this information to create a 95% confidence interval
Unlock Deck
Unlock for access to all 88 flashcards in this deck.
Unlock Deck
k this deck
57
Construct a 99% confidence interval for the population mean, μ. Assume the population has a normaldistribution. A group of 19 randomly selected employees has a mean age of 22.4 years with a standarddeviation of 3.8 years. Round to the nearest tenth.
A) (19.9, 24.9)
B) (16.3, 26.9)
C) (17.2, 23.6)
D) (18.7, 24.1)
A) (19.9, 24.9)
B) (16.3, 26.9)
C) (17.2, 23.6)
D) (18.7, 24.1)
Unlock Deck
Unlock for access to all 88 flashcards in this deck.
Unlock Deck
k this deck
58
A) Yes; the data appear roughly normally distributed and there are no outliers
B) No; the data appear roughly normally distributed, but there are outliers
C) No; the data are not normally distributed and there are outliers
D) No; there are no outliers, but the data are not normally distributed
Unlock Deck
Unlock for access to all 88 flashcards in this deck.
Unlock Deck
k this deck
59
Construct a 95% confidence interval for the population mean, μ. Assume the population has a normaldistribution. A sample of 20 part-time workers had mean annual earnings of $3120 with a standard deviationof $677. Round to the nearest dollar.
A) ($2803, $3437)
B) ($1324, $1567)
C) ($2135, $2567)
D) ($2657, $2891)
A) ($2803, $3437)
B) ($1324, $1567)
C) ($2135, $2567)
D) ($2657, $2891)
Unlock Deck
Unlock for access to all 88 flashcards in this deck.
Unlock Deck
k this deck
60
To help consumers assess the risks they are taking, the Food and Drug Administration (FDA) publishes theamount of nicotine found in all commercial brands of cigarettes. A new cigarette has recently been marketed.The FDA tests on this cigarette gave a mean nicotine content of 28.4 milligrams and standard deviation of 2.6milligrams for a sample of n = 9 cigarettes. The FDA claims that the mean nicotine content exceeds 31.0milligrams for this brand of cigarette, and their stated reliability is 90%. Do you agree?
A) No, since the value 31.0 does not fall in the 90% confidence interval.
B) Yes, since the value 31.0 does fall in the 90% confidence interval.
C) Yes, since the value 31.0 does not fall in the 90% confidence interval.
D) No, since the value 31.0 does fall in the 90% confidence interval.
A) No, since the value 31.0 does not fall in the 90% confidence interval.
B) Yes, since the value 31.0 does fall in the 90% confidence interval.
C) Yes, since the value 31.0 does not fall in the 90% confidence interval.
D) No, since the value 31.0 does fall in the 90% confidence interval.
Unlock Deck
Unlock for access to all 88 flashcards in this deck.
Unlock Deck
k this deck
61
True or False: As the number of degrees of freedom increases, the chi-square distribution becomes morenearly symmetric.
Unlock Deck
Unlock for access to all 88 flashcards in this deck.
Unlock Deck
k this deck
62
The June precipitation (in inches) for 10 randomly selected cities are listed below. Construct a 90% confidenceinterval for the population standard deviation, σ. Assume the data are normally distributed.2.0 3.2 1.8 2.9 0.9 4.0 3.3 2.9 3.6 0.8
A) (0.81, 1.83)
B) (0.32, 0.85)
C) (0.53, 1.01)
D) (1.10, 2.01)
A) (0.81, 1.83)
B) (0.32, 0.85)
C) (0.53, 1.01)
D) (1.10, 2.01)
Unlock Deck
Unlock for access to all 88 flashcards in this deck.
Unlock Deck
k this deck
63
A) 7.633 and 36.191
B) 6.844 and 27.204
C) 8.907 and 38.582
D) 10.117 and 32.852
Unlock Deck
Unlock for access to all 88 flashcards in this deck.
Unlock Deck
k this deck
64
A) 6.571 and 23.685
B) 4.075 and 31.319
C) 4.660 and 29.131
D) 5.629 and 26.119
Unlock Deck
Unlock for access to all 88 flashcards in this deck.
Unlock Deck
k this deck
65
True or False? When constructing a (1 - α) 100% confidence interval for a population variance thepopulation from which the random sample is selected can have any distribution.
thepopulation from which the random sample is selected can have any distribution. Unlock Deck
Unlock for access to all 88 flashcards in this deck.
Unlock Deck
k this deck
66
The grade point averages for 10 randomly selected students in an algebra class with 125 students are listedbelow. What is the effect on the width of the confidence interval if the sample size is increased to 20?2.0 3.2 1.8 2.9 0.9 4.0 3.3 2.9 3.6 0.8
A) The width decreases.
B) The width increases.
C) The width remains the same.
D) It is impossible to tell without more information.
A) The width decreases.
B) The width increases.
C) The width remains the same.
D) It is impossible to tell without more information.
Unlock Deck
Unlock for access to all 88 flashcards in this deck.
Unlock Deck
k this deck
67
The principal at Riverside High School would like to estimate the mean length of time each day that it takes allthe buses to arrive and unload the students. How large a sample is needed if the principal would like to assertwith 90% confidence that the sample mean is off by, at most, 7 minutes. Assume that s = 14 minutes based onprevious studies.
A) 11
B) 10
C) 12
D) 13
A) 11
B) 10
C) 12
D) 13
Unlock Deck
Unlock for access to all 88 flashcards in this deck.
Unlock Deck
k this deck
68
The best point estimate for the standard deviation of a population is
A) The standard deviation of the sample.
B) The variance of the population.
C) The variance of the sample.
A) The standard deviation of the sample.
B) The variance of the population.
C) The variance of the sample.
Unlock Deck
Unlock for access to all 88 flashcards in this deck.
Unlock Deck
k this deck
69
A student randomly selects 10 paperbacks at a store. The mean price is $8.75 with a standard deviation of $1.50.Construct a 95% confidence interval for the population standard deviation, σ. Assume the data are normallydistributed.
A) ($1.03, $2.74)
B) ($0.43, $1.32)
C) ($1.43, $2.70)
D) ($1.76, $3.10)
A) ($1.03, $2.74)
B) ($0.43, $1.32)
C) ($1.43, $2.70)
D) ($1.76, $3.10)
Unlock Deck
Unlock for access to all 88 flashcards in this deck.
Unlock Deck
k this deck
70
Construct a 95% confidence interval for the population standard deviation σof a random sample of 15 crateswhich have a mean weight of 165.2 pounds and a standard deviation of 14.5 pounds. Assume the population isnormally distributed.
A) (10.6, 22.9)
B) (112.7, 522.9)
C) (2.8, 6.0)
D) (11.1, 21.2)
A) (10.6, 22.9)
B) (112.7, 522.9)
C) (2.8, 6.0)
D) (11.1, 21.2)
Unlock Deck
Unlock for access to all 88 flashcards in this deck.
Unlock Deck
k this deck
71
Determine the sample size required to estimate the mean score on a standardized test within 4 points of thetrue mean with 98% confidence. Assume that s = 14 based on earlier studies.
A) 67
B) 9
C) 172
D) 1
A) 67
B) 9
C) 172
D) 1
Unlock Deck
Unlock for access to all 88 flashcards in this deck.
Unlock Deck
k this deck
72
Assume that the heights of female executives are normally distributed. A random sample of 20 femaleexecutives have a mean height of 62.5 inches and a standard deviation of 1.8 inches. Construct a 98%confidence interval for the population variance,
A) (1.7, 8.1)
B) (1.3, 2.8)
C) (0.9, 4.5)
D) (1.8, 8.5)
A) (1.7, 8.1)
B) (1.3, 2.8)
C) (0.9, 4.5)
D) (1.8, 8.5)
Unlock Deck
Unlock for access to all 88 flashcards in this deck.
Unlock Deck
k this deck
73
The mean replacement time for a random sample of 12 cd players is 8.6 years with a standard deviation of 3.5years. Construct the 98% confidence interval for the population variance, . Assume the data are normallydistributed
A) (5.4, 44.1)
B) (2.3, 6.6)
C) (1.6, 12.6)
D) (5.1, 37.7)
. Assume the data are normallydistributedA) (5.4, 44.1)
B) (2.3, 6.6)
C) (1.6, 12.6)
D) (5.1, 37.7)
Unlock Deck
Unlock for access to all 88 flashcards in this deck.
Unlock Deck
k this deck
74
A) 3.816 and 21.920
B) 3.053 and 24.725
C) 4.575 and 26.757
D) 2.603 and 19.675
Unlock Deck
Unlock for access to all 88 flashcards in this deck.
Unlock Deck
k this deck
75
True or False: The chi-square distribution is a symmetric distribution is negative when the degrees of freedombecome large.
Unlock Deck
Unlock for access to all 88 flashcards in this deck.
Unlock Deck
k this deck
76
Assume that the heights of bookcases are normally distributed. A random sample of 16 bookcases in onecompany have a mean height of 67.5 inches and a standard deviation of 2.1 inches. Construct a 99% confidenceinterval for the population standard deviation,
A) (1.4, 3.8)
B) (1.5, 3.9)
C) (1.0, 2.6)
D) (1.5, 3.6)
A) (1.4, 3.8)
B) (1.5, 3.9)
C) (1.0, 2.6)
D) (1.5, 3.6)
Unlock Deck
Unlock for access to all 88 flashcards in this deck.
Unlock Deck
k this deck
77
A) 1.735 and 23.587
B) 2.156 and 25.188
C) 2.088 and 21.666
D) 2.558 and 23.209
Unlock Deck
Unlock for access to all 88 flashcards in this deck.
Unlock Deck
k this deck
78
A doctor at a local hospital is interested in estimating the birth weight of infants. How large a sample must sheselect if she desires to be 90% confident that her estimate is within 2 ounces of the true mean? Assume that s =5 ounces based on earlier studies.
A) 17
B) 16
C) 5
D) 4
A) 17
B) 16
C) 5
D) 4
Unlock Deck
Unlock for access to all 88 flashcards in this deck.
Unlock Deck
k this deck
79
True or False: As the level of confidence increases the number of item to be included in a sample will decreasewhen the error and the standard deviation are held constant.
Unlock Deck
Unlock for access to all 88 flashcards in this deck.
Unlock Deck
k this deck
80
True or False: The chi-square distribution is a symmetric distribution for all degrees of freedom.
Unlock Deck
Unlock for access to all 88 flashcards in this deck.
Unlock Deck
k this deck
Unlock Deck
Unlock for access to all 88 flashcards in this deck.


