Deck 11: Inferences on Two Samples
Full screen (f)
Question

A) 0.374
B) 0.982
C) 1.328
D) 2.361
Question

A) -2.513
B) -2.132
C) -0.985
D) 1.116
Question
Question

A) 0.362
B) 2.116
C) 1.324
D) 0.638
Question
Question
Question
Question
Question
Test the hypothesis that 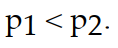 Use α=0.10 . The sample statistics listed below are from independent samples.
Sample statistics: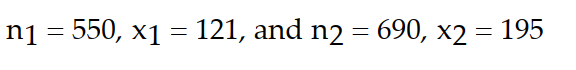
Use α=0.10 . The sample statistics listed below are from independent samples.Sample statistics:
Question
Question
Question
Question
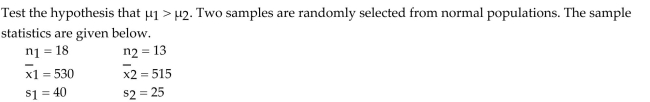
Test the hypothesis that 
The sample statistics listed below are from independent samples.
Sample statistics:
The sample statistics listed below are from independent samples.
Sample statistics:
Question

A) 5.087
B) 2.798
C) 4.761
D) 3.212
Question
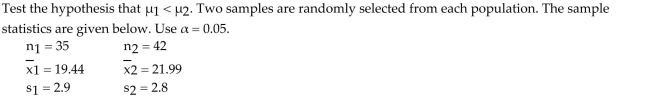
Test the hypothesis that 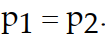 Use α = 0.05
The sample statistics listed below are from independent samples.
Sample statistics: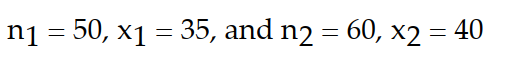
Use α = 0.05The sample statistics listed below are from independent samples.
Sample statistics:
Question
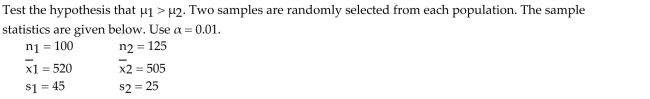
Test the hypothesis that  Use α=0.01 . The sample statistics listed below are from independent samples.
Sample statistics: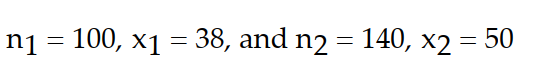
Use α=0.01 . The sample statistics listed below are from independent samples.Sample statistics:
Question
Question
Question
Question
Question
 3 Construct and interpret confidence intervals for the difference between two population proportions.
 Question
In a survey, students were selected at random from a certain college and were asked two questions. The firstquestion was ʺDo you believe it is wrong to hunt ?ʺ The second question was ʺDo you believe it is wrong to eatmeat?ʺ The results are shown in the table. Success for the first question is identifying someone who feels that itis wrong to hunt and for the second question is identifying someone who feels that it is wrong to eat meat. 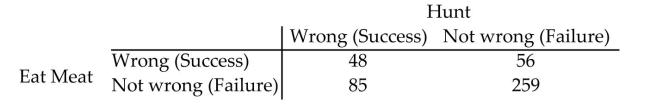 Is there a significant difference in the proportion of students at this college who feel it is wrong to hunt and theproportion who feel that it is wrong to eat meat? Use the P-value method and the α = 0.05 level of significance.5 Determine the sample size needed for estimating the difference between two population proportions.
Is there a significant difference in the proportion of students at this college who feel it is wrong to hunt and theproportion who feel that it is wrong to eat meat? Use the P-value method and the α = 0.05 level of significance.5 Determine the sample size needed for estimating the difference between two population proportions. Question
Test whether the population proportions differ at the α = 0.05 level of significance by determining the null andalternative hypotheses, the test statistic, and the critical value. Assume that the samples are dependent and thatthey were obtained randomly. 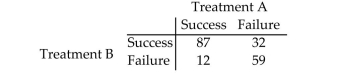
Question
A controversial bill is being debated in the state legislature. Representative Williams wants to estimate within 2percentage points and with 95% confidence the difference in the proportion of her male and femaleconstituents who favor the bill. What sample size should she obtain?  11.2 Inference about Two Means: Dependent Samples1 Test hypotheses regarding matched-pairs data.
11.2 Inference about Two Means: Dependent Samples1 Test hypotheses regarding matched-pairs data. Question
Question
 Assume that the paired data came from a population that is normally distributed.
A) 9.0
B) -5.1
C) 33.1
D) 25.2
Question
Question
Question
Question
Construct a 98 % confidence interval for  The sample statistics listed below are from independent samples.
Sample statistics:
A) (0.047,0.128)
B) (-0.621,0.781)
C) (0.581,1.819)
D) (1.516,3.021)
The sample statistics listed below are from independent samples.Sample statistics:
A) (0.047,0.128)
B) (-0.621,0.781)
C) (0.581,1.819)
D) (1.516,3.021)
Question
A researcher wants to determine whether there is a difference between two sunscreen lotions. Participants in amarathon race on a hot, sunny day applied lotion A to one arm and lotion B to the other arm. The results areshown in the table. 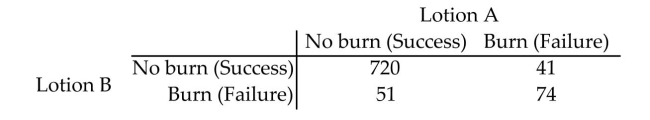 Is there a difference in the effectiveness of the two lotions in preventing sunburn? Use the critical-valuemethod and the α = 0.05 level of significance.
Is there a difference in the effectiveness of the two lotions in preventing sunburn? Use the critical-valuemethod and the α = 0.05 level of significance. Question
In a recent survey of drinking laws, a random sample of 1000 women showed that 65 % were in favor of increasing the legal drinking age. In a random sample of 1000 men, 60 % favored increasing the legal drinking age. Construct a 95% confidence interval for 
A) (0.008,0.092)
B) (0.587,0.912)
C) (-1.423,1.432)
D) (-2.153,1.679)
A) (0.008,0.092)
B) (0.587,0.912)
C) (-1.423,1.432)
D) (-2.153,1.679)
Question
Question
Construct a 95% confidence interval for  The sample statistics listed below are from independent samples.
Sample statistics:
A) (-0.141,0.208)
B) (-0.871,0.872)
C) (-1.341,1.781)
D) (-2.391,3.112)
The sample statistics listed below are from independent samples.Sample statistics:
A) (-0.141,0.208)
B) (-0.871,0.872)
C) (-1.341,1.781)
D) (-2.391,3.112)
Question
Construct a 95 % confidence interval for  for a survey that finds 30 % of 240 males and 41 % of 200 females are opposed to the death penalty.
A) (-0.200,-0.021)
B) (-1.532,1.342)
C) (-0.561,0.651)
D) (-1.324,1.512)
for a survey that finds 30 % of 240 males and 41 % of 200 females are opposed to the death penalty.A) (-0.200,-0.021)
B) (-1.532,1.342)
C) (-0.561,0.651)
D) (-1.324,1.512)
Question
 4 Test hypotheses regarding two proportions from dependent samples.
 Question
Question
Test whether the population proportions differ at the α = 0.05 level of significance by determining the null andalternative hypotheses, the test statistic, and the P- value. Assume that the samples are dependent and thatthey were obtained randomly. 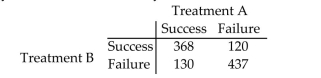
Question
A random sample of 100 students at a high school was asked whether they would ask their father or mother for help with a financial problem. A second sample of 100 different students was asked the same question regarding a dating problem. Forty-three students in the first sample and 47 students in the second sample replied that they turned to their mother rather than their father for help. Construct a 98 % confidence interval for 
A) (-0.204,0.124)
B) (-1.324,1.521)
C) (-0.591,0.762)
D) (-1.113,1.311)
A) (-0.204,0.124)
B) (-1.324,1.521)
C) (-0.591,0.762)
D) (-1.113,1.311)
Question
Two surgical procedures are widely used to treat a certain type of cancer. To compare the success rates of thetwo procedures, random samples of the two types of surgical patients were obtained and the numbers ofpatients who showed no recurrence of the disease after a 1-year period were recorded. The data are shown inthe table. How large a sample would be necessary in order to estimate the difference in the true success ratesto within 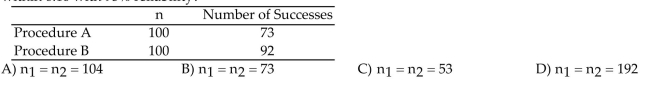 0.10 with 95% reliability?
0.10 with 95% reliability? Question
 Assume that the paired data came from a population that is normally distributed.
A) -0.94
B) -0.76
C) 0.58
D) 0.89
Question
A football coach claims that players can increase their strength by taking a certain supplement. To test thetheory, the coach randomly selects 9 athletes and gives them a strength test using a bench press. The results arelisted below. Thirty days later, after regular training using the supplement, they are tested again. The newresults are listed below. Test the claim that the supplement is effective in increasing the athletesʹ strength. Use α= 0.05. Assume that the distribution is normally distributed. 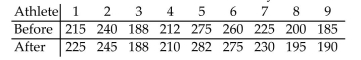
Question
Nine students took the SAT. Their scores are listed below. Later on, they read a book on test preparation andretook the SAT. Their new scores are listed below. Construct a 95% confidence interval for μd. Assume that thedistribution is normally distributed. 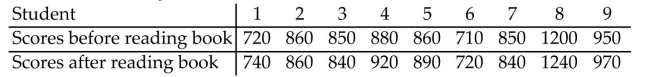
A) (-30.503, -0.617)
B) (-20.341, 4.852)
C) (-10.321, 15.436)
D) (1.651, 30.590)
A) (-30.503, -0.617)
B) (-20.341, 4.852)
C) (-10.321, 15.436)
D) (1.651, 30.590)
Question
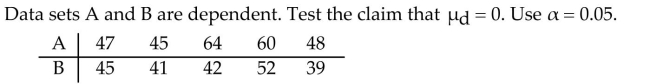
Nine students took the SAT. Their scores are listed below. Later on, they read a book on test preparation and retook the SAT. Their new scores are listed below. Test the claim that the book had no effect on their scores. Use α =0.05 . Assume that the distribution is normally distributed.
Question
Question
 Assume that the paired data came from a population that is normally distributed.
A) 1.73
B) 1.21
C) 1.32
D) 1.89
Question
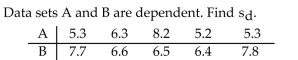
In a study of the effectiveness of diet on weight loss, 20 people were randomly selected to participate in a dietprogram for 30 days. Test the claim that diet had no bearing on weight loss. Use α = 0.02.. Assume that thedistribution is normally distributed. 
Question
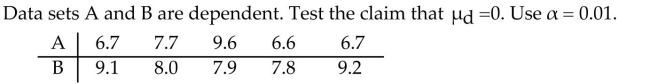
A pharmaceutical company wishes to test a new drug with the expectation of lowering cholesterol levels. Tensubjects are randomly selected and pretested. The results are listed below. The subjects were placed on thedrug for a period of 6 months, after which their cholesterol levels were tested again. The results are listedbelow. (All units are milligrams per deciliter.) Test the companyʹs claim that the drug lowers cholesterol levels.Use α = 0.01. Assume that the distribution is normally distributed. 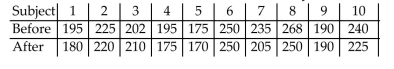
Question
We are interested in comparing the average supermarket prices of two leading colas in the Tampa area. Oursample was taken by randomly going to each of eight supermarkets and recording the price of a six -pack ofcola of each brand. The data are shown in the following table. Find a 98% confidence interval for the differencein mean price of brand 1 and brand 2. Assume that the paired data came from a population that is normallydistributed. 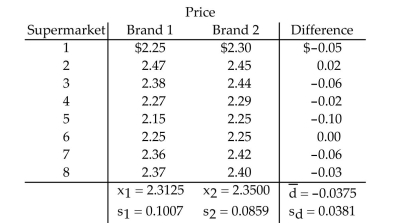
A) (-0.0779, 0.0029)
B) (-0.1768, 0.1018)
C) (-0.0846, 0.0096)
D) (-0.0722, -0.0028)
A) (-0.0779, 0.0029)
B) (-0.1768, 0.1018)
C) (-0.0846, 0.0096)
D) (-0.0722, -0.0028)
Question
A local company is concerned about the number of days missed by its employees due to illness. A randomsample of 10 employees is selected. The number of days absent in one year is listed below. An incentiveprogram is offered in an attempt to decrease the number of days absent. The number of days absent in one yearafter the incentive program is listed below. Test the claim that the incentive program cuts down on the numberof days missed by employees. Use α = 0.05. Assume that the distribution is normally distributed. 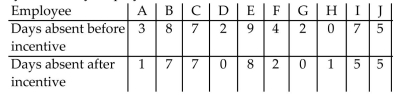
Question
Question
 Assume that the paired data came from a population that is normally distributed.
A) 7.8
B) 5.6
C) 6.8
D) 8.9
Question
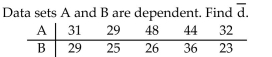
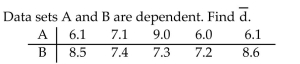
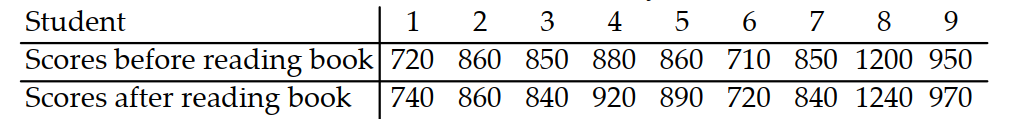
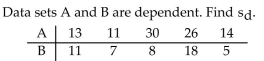
Construct a 95% confidence interval for data sets A and B. Data sets A and B are dependent. 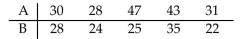 Assume that the paired data came from a population that is normally distributed.
A) (-0.696, 18.700)
B) (-1.324, 8.981)
C) (-0.113, 12.761)
D) (-15.341, 15.431)
Assume that the paired data came from a population that is normally distributed.A) (-0.696, 18.700)
B) (-1.324, 8.981)
C) (-0.113, 12.761)
D) (-15.341, 15.431)
Question
Construct a 99% confidence interval for data sets A and B. Data sets A and B are dependent. 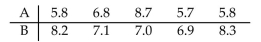 Assume that the paired data came from a population that is normally distributed.
A) (-4.502, 2.622)
B) (-25.123, 5.761)
C) (-21.342, 18.982)
D) (-15.123, 15.123)
Assume that the paired data came from a population that is normally distributed.A) (-4.502, 2.622)
B) (-25.123, 5.761)
C) (-21.342, 18.982)
D) (-15.123, 15.123)
Question
Question
A physician claims that a personʹs diastolic blood pressure can be lowered if, instead of taking a drug, theperson meditates each evening. Ten subjects are randomly selected and pretested. Their blood pressures,measured in millimeters of mercury, are listed below. The 10 patients are instructed in basic meditation andtold to practice it each evening for one month. At the end of the month, their blood pressures are taken again.The data are listed below. Test the physicianʹs claim. Use α = 0.01. 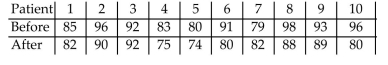
Question
A new weight-reducing technique, consisting of a liquid protein diet, is currently undergoing tests before itsintroduction into the market. A typical test performed is the following: The weights of a random sample of fivepeople are recorded before they are introduced to the liquid protein diet. The five individuals are theninstructed to follow the liquid protein diet for 3 weeks. At the end of this period, their weights (in pounds) areagain recorded. The results are listed in the table. Let μ1 be the true mean weight of individuals before startingthe diet and let μ2 be the true mean weight of individuals after 3 weeks on the diet. Calculate a 90% confidenceinterval for the difference between the mean weights before and after the diet is used. Assume that the paireddata came from a population that is normally distributed. 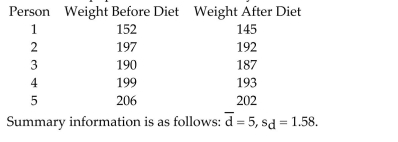
Question
 Assume that the paired data came from a population that is normally distributed.
 Question
 Assume that the paired data came from a population that is normally distributed.
 Question
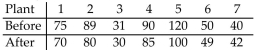
Seven randomly selected plants that bottle the same beverage implemented a time management program in hopes of improving productivity. The average time, in minutes, that it took the companies to produce the same quantity of bottles before and after the program are listed below. Assume the two population distributions are normal. Construct a 90 % confidence interval for  Assume that the paired data came from a population that is normally distributed.
A) (0.21,10.93)
B) (1.60,9.54)
C) (-0.22,11.36)
D) (-22,33.3)
Assume that the paired data came from a population that is normally distributed.A) (0.21,10.93)
B) (1.60,9.54)
C) (-0.22,11.36)
D) (-22,33.3)
Question
Question
Find the standardized test statistic, t, to test the hypothesis that μ1 = μ2. Two samples are randomly selectedand 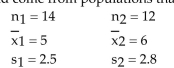 come from populations that are normal. The sample statistics are given below.
A) -0.954
B) -0.915
C) -1.558
D) -0.909
come from populations that are normal. The sample statistics are given below.A) -0.954
B) -0.915
C) -1.558
D) -0.909
Question
Question
Question
A) 1.282
B) 3.271
C) 2.819
D) 1.865
Question
Question
Question
Find the standardized test statistic, t, to test the hypothesis that μ1 ≠ μ2. Two samples are randomly selectedand come from populations that are normal. The sample statistics are given below. 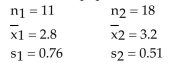
A) -1.546
B) -1.821
C) -2.123
D) -1.326
A) -1.546
B) -1.821
C) -2.123
D) -1.326
Question
A) -3.90
B) -3.16
C) -2.63
D) -1.66
Question
Question
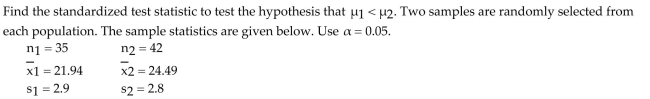
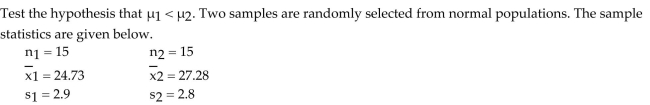
Find the standardized test statistic, t, to test the hypothesis that μ1 < μ2. Two samples are randomly selectedand come from populations that are normal. The sample statistics are given below. 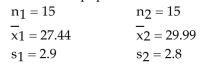
A) -2.450
B) -3.165
C) -1.667
D) -0.669
A) -2.450
B) -3.165
C) -1.667
D) -0.669
Question
A) 2.98
B) 2.81
C) 1.86
D) 0.91
Question
Question
Question
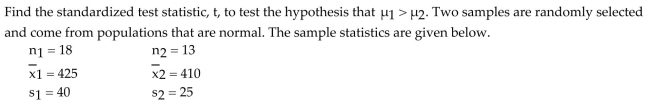
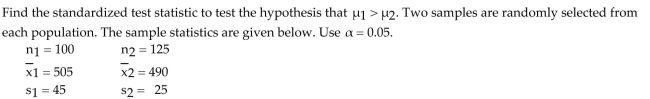
Find the standardized test statistic, t , to test the hypothesis that  Two samples are randomly selected and come from populations that are normal. The sample statistics are given below.
A) 4.361
B) 3.287
C) 2.892
D) 1.986
Two samples are randomly selected and come from populations that are normal. The sample statistics are given below. A) 4.361
B) 3.287
C) 2.892
D) 1.986
Question
A) -1.6
B) -0.8
C) -2.6
D) -1.0
Question
A) -2.97
B) -1.82
C) -2.12
D) -2.32
Question
Question
A) 6.2
B) 8.1
C) 4.2
D) 3.8
Question
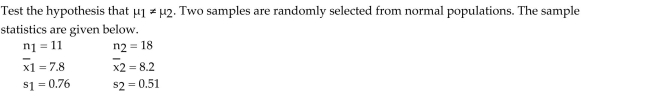
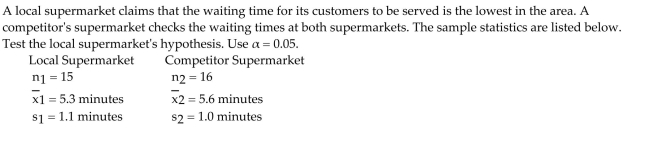
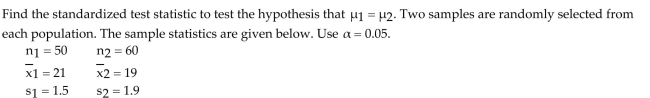
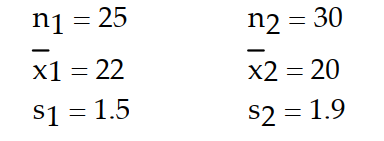
Test the hypothesis that https://storage.examlex.com/TB6004/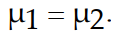 . Two samples are randomly selected from normal populations. The sample statistics are given below.
. Two samples are randomly selected from normal populations. The sample statistics are given below.
Unlock Deck
Sign up to unlock the cards in this deck!
Unlock Deck
Unlock Deck
1/129
Play
Full screen (f)
Deck 11: Inferences on Two Samples
1
A) 0.374
B) 0.982
C) 1.328
D) 2.361
A
2
A) -2.513
B) -2.132
C) -0.985
D) 1.116
A
3
In a recent survey of drinking laws, a random sample of 1000 women showed that 65% were in favor ofincreasing the legal drinking age. In a random sample of 1000 men, 60% favored increasing the legal drinkingage. Test the hypothesis that the percentage of men and women favoring a higher legal drinking age is thesame. Use α = 0.05.

4
A) 0.362
B) 2.116
C) 1.324
D) 0.638
Unlock Deck
Unlock for access to all 129 flashcards in this deck.
Unlock Deck
k this deck
5
A university compared the mean salary of its science graduates ten years after graduation with the meansalary of its social science graduates ten years after graduation.
A) quantitative, independent
B) qualitative, dependent
C) quantitative, dependent
D) qualitative, independent
A) quantitative, independent
B) qualitative, dependent
C) quantitative, dependent
D) qualitative, independent
Unlock Deck
Unlock for access to all 129 flashcards in this deck.
Unlock Deck
k this deck
6
Two samples are said to be dependent if
A) the individuals in one sample are used to determine the individuals in a second sample.
B) the individuals in one sample have no influence over the selection of the individuals in a second sample.
C) some individuals, but not all, in one sample exert influence over who is selected for inclusion in a second ample.
D) sampling for inclusion in the two samples is done with replacement.
Unlock Deck
Unlock for access to all 129 flashcards in this deck.
Unlock Deck
k this deck
7
A city council randomly selects 1000 married couples from a certain city and records the number of womenwho are in favor of a new football stadium and the number of men who are in favor.
A) qualitative, dependent
B) quantitative, dependent
C) qualitative, independent
D) quantitative, independent
A) qualitative, dependent
B) quantitative, dependent
C) qualitative, independent
D) quantitative, independent
Unlock Deck
Unlock for access to all 129 flashcards in this deck.
Unlock Deck
k this deck
8
If the individuals selected for a sample have no influence upon which individuals are selected for a secondsample, then the samples are said to be
A) independent
B) dependent
C) inconsistent
D) consistent
A) independent
B) dependent
C) inconsistent
D) consistent
Unlock Deck
Unlock for access to all 129 flashcards in this deck.
Unlock Deck
k this deck
9
Test the hypothesis that Use α=0.10 . The sample statistics listed below are from independent samples.
Sample statistics:
Use α=0.10 . The sample statistics listed below are from independent samples.Sample statistics:
Unlock Deck
Unlock for access to all 129 flashcards in this deck.
Unlock Deck
k this deck
10
A group of wine tasters rated Chardonnay wines from two different wineries as poor, acceptable, good orexcellent.
A) qualitative, dependent
B) quantitative, independent
C) quantitative, dependent
D) qualitative, independent
A) qualitative, dependent
B) quantitative, independent
C) quantitative, dependent
D) qualitative, independent
Unlock Deck
Unlock for access to all 129 flashcards in this deck.
Unlock Deck
k this deck
11
Classify the two given samples as independent or dependent.
Sample 1: The scores of 16 students who took a statistics final
Sample 2: The scores of 16 different students who took a physics final
A) independent
B) dependent
Sample 1: The scores of 16 students who took a statistics final
Sample 2: The scores of 16 different students who took a physics final
A) independent
B) dependent
Unlock Deck
Unlock for access to all 129 flashcards in this deck.
Unlock Deck
k this deck
12
One hundred men suffering from high cholesterol were randomly assigned to receive placebo or acholesterol-lowering medication. After three months, the mean cholesterol level of those receiving placebo wascompared with the mean cholesterol level of those receiving the medication.
A) quantitative, independent
B) quantitative, dependent
C) qualitative, dependent
D) qualitative, independent
A) quantitative, independent
B) quantitative, dependent
C) qualitative, dependent
D) qualitative, independent
Unlock Deck
Unlock for access to all 129 flashcards in this deck.
Unlock Deck
k this deck
13
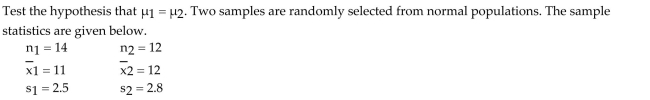
Test the hypothesis that
The sample statistics listed below are from independent samples.
Sample statistics:
The sample statistics listed below are from independent samples.
Sample statistics:
Unlock Deck
Unlock for access to all 129 flashcards in this deck.
Unlock Deck
k this deck
14
A) 5.087
B) 2.798
C) 4.761
D) 3.212
Unlock Deck
Unlock for access to all 129 flashcards in this deck.
Unlock Deck
k this deck
15
Test the hypothesis that Use α = 0.05
The sample statistics listed below are from independent samples.
Sample statistics:
Use α = 0.05The sample statistics listed below are from independent samples.
Sample statistics:
Unlock Deck
Unlock for access to all 129 flashcards in this deck.
Unlock Deck
k this deck
16
Test the hypothesis that Use α=0.01 . The sample statistics listed below are from independent samples.
Sample statistics:
Use α=0.01 . The sample statistics listed below are from independent samples.Sample statistics:
Unlock Deck
Unlock for access to all 129 flashcards in this deck.
Unlock Deck
k this deck
17
Classify the two given samples as independent or dependent.
Sample 1: The heights in inches of 27 newborn females
Sample 2: The heights in inches of 27 newborn males
A) independent
B) dependent
Sample 1: The heights in inches of 27 newborn females
Sample 2: The heights in inches of 27 newborn males
A) independent
B) dependent
Unlock Deck
Unlock for access to all 129 flashcards in this deck.
Unlock Deck
k this deck
18
A researcher randomly selected 100 adults aged 18-25 and 100 adults aged 50-60. Within each age group, sherecorded the number of smokers.
A) qualitative, independent
B) quantitative, independent
C) qualitative, dependent
D) quantitative, dependent
A) qualitative, independent
B) quantitative, independent
C) qualitative, dependent
D) quantitative, dependent
Unlock Deck
Unlock for access to all 129 flashcards in this deck.
Unlock Deck
k this deck
19
Classify the two given samples as independent or dependent.
Sample 1: Pre-training blood pressure of 15 people
Sample 2: Post-training blood pressure of 15 people
A) dependent
B) independent
Sample 1: Pre-training blood pressure of 15 people
Sample 2: Post-training blood pressure of 15 people
A) dependent
B) independent
Unlock Deck
Unlock for access to all 129 flashcards in this deck.
Unlock Deck
k this deck
20
A psychologist wants to measure the effect of music on memory. He randomly selects 80 students andmeasures their scores on a memory test conducted in silence. The next day he measures their scores on asimilar test conducted while classical music is playing. The mean score without music is compared to themean score with music.
A) quantitative, dependent
B) qualitative, dependent
C) quantitative, independent
D) qualitative, independent
A) quantitative, dependent
B) qualitative, dependent
C) quantitative, independent
D) qualitative, independent
Unlock Deck
Unlock for access to all 129 flashcards in this deck.
Unlock Deck
k this deck
21
3 Construct and interpret confidence intervals for the difference between two population proportions. Unlock Deck
Unlock for access to all 129 flashcards in this deck.
Unlock Deck
k this deck
22
In a survey, students were selected at random from a certain college and were asked two questions. The firstquestion was ʺDo you believe it is wrong to hunt ?ʺ The second question was ʺDo you believe it is wrong to eatmeat?ʺ The results are shown in the table. Success for the first question is identifying someone who feels that itis wrong to hunt and for the second question is identifying someone who feels that it is wrong to eat meat. Is there a significant difference in the proportion of students at this college who feel it is wrong to hunt and theproportion who feel that it is wrong to eat meat? Use the P-value method and the α = 0.05 level of significance.5 Determine the sample size needed for estimating the difference between two population proportions.
Is there a significant difference in the proportion of students at this college who feel it is wrong to hunt and theproportion who feel that it is wrong to eat meat? Use the P-value method and the α = 0.05 level of significance.5 Determine the sample size needed for estimating the difference between two population proportions. Unlock Deck
Unlock for access to all 129 flashcards in this deck.
Unlock Deck
k this deck
23
Test whether the population proportions differ at the α = 0.05 level of significance by determining the null andalternative hypotheses, the test statistic, and the critical value. Assume that the samples are dependent and thatthey were obtained randomly.
Unlock Deck
Unlock for access to all 129 flashcards in this deck.
Unlock Deck
k this deck
24
A controversial bill is being debated in the state legislature. Representative Williams wants to estimate within 2percentage points and with 95% confidence the difference in the proportion of her male and femaleconstituents who favor the bill. What sample size should she obtain? 11.2 Inference about Two Means: Dependent Samples1 Test hypotheses regarding matched-pairs data.
11.2 Inference about Two Means: Dependent Samples1 Test hypotheses regarding matched-pairs data. Unlock Deck
Unlock for access to all 129 flashcards in this deck.
Unlock Deck
k this deck
25
To test the effectiveness of a new drug designed to relieve flu symptoms, 200 patients were randomly selectedand divided into two equal groups. One group of 100 patients was given a pill containing the drug while theother group of 100 was given a placebo. What can we conclude about the effectiveness of the drug if 62 of thoseactually taking the drug felt a beneficial effect while 41 of the patients taking the placebo felt a beneficial effect?Use α = 0.05.
Unlock Deck
Unlock for access to all 129 flashcards in this deck.
Unlock Deck
k this deck
26
Assume that the paired data came from a population that is normally distributed.A) 9.0
B) -5.1
C) 33.1
D) 25.2
Unlock Deck
Unlock for access to all 129 flashcards in this deck.
Unlock Deck
k this deck
27
In the initial test of the Salk vaccine for polio, 400,000 children were selected and divided into two groups of200,000. One group was vaccinated with the Salk vaccine while the second group was vaccinated with aplacebo. Of those vaccinated with the Salk vaccine, 33 later developed polio. Of those receiving the placebo, 115later developed polio. Test the hypothesis that the Salk vaccine is effective in lowering the polio rate. Useα = 0.01.
Unlock Deck
Unlock for access to all 129 flashcards in this deck.
Unlock Deck
k this deck
28
A recent survey showed that in a sample of 100 elementary school teachers, 15 were single. In a sample of 180high school teachers, 36 were single. Is the proportion of high school teachers who were single greater than theproportion of elementary teachers who were single? Use α = 0.01.
Unlock Deck
Unlock for access to all 129 flashcards in this deck.
Unlock Deck
k this deck
29
A well-known study of 22,000 male physicians was conducted to determine if taking aspirin daily reduces thechances of a heart attack. Half of the physicians were given a regular dose of aspirin while the other half wasgiven placebos. Six years later, among those who took aspirin, 104 suffered heart attacks while among thosewho took placebos, 189 suffered heart attacks. Does it appear that the aspirin can reduce the number of heartattacks among the sample group that took aspirin? Use α = 0.01.
Unlock Deck
Unlock for access to all 129 flashcards in this deck.
Unlock Deck
k this deck
30
Construct a 98 % confidence interval for The sample statistics listed below are from independent samples.
Sample statistics:
A) (0.047,0.128)
B) (-0.621,0.781)
C) (0.581,1.819)
D) (1.516,3.021)
The sample statistics listed below are from independent samples.Sample statistics:
A) (0.047,0.128)
B) (-0.621,0.781)
C) (0.581,1.819)
D) (1.516,3.021)
Unlock Deck
Unlock for access to all 129 flashcards in this deck.
Unlock Deck
k this deck
31
A researcher wants to determine whether there is a difference between two sunscreen lotions. Participants in amarathon race on a hot, sunny day applied lotion A to one arm and lotion B to the other arm. The results areshown in the table. Is there a difference in the effectiveness of the two lotions in preventing sunburn? Use the critical-valuemethod and the α = 0.05 level of significance.
Is there a difference in the effectiveness of the two lotions in preventing sunburn? Use the critical-valuemethod and the α = 0.05 level of significance. Unlock Deck
Unlock for access to all 129 flashcards in this deck.
Unlock Deck
k this deck
32
In a recent survey of drinking laws, a random sample of 1000 women showed that 65 % were in favor of increasing the legal drinking age. In a random sample of 1000 men, 60 % favored increasing the legal drinking age. Construct a 95% confidence interval for
A) (0.008,0.092)
B) (0.587,0.912)
C) (-1.423,1.432)
D) (-2.153,1.679)
A) (0.008,0.092)
B) (0.587,0.912)
C) (-1.423,1.432)
D) (-2.153,1.679)
Unlock Deck
Unlock for access to all 129 flashcards in this deck.
Unlock Deck
k this deck
33
True or False: When constructing a confidence interval for the difference of two population proportions, apooled estimate of p is not required.
Unlock Deck
Unlock for access to all 129 flashcards in this deck.
Unlock Deck
k this deck
34
Construct a 95% confidence interval for The sample statistics listed below are from independent samples.
Sample statistics:
A) (-0.141,0.208)
B) (-0.871,0.872)
C) (-1.341,1.781)
D) (-2.391,3.112)
The sample statistics listed below are from independent samples.Sample statistics:
A) (-0.141,0.208)
B) (-0.871,0.872)
C) (-1.341,1.781)
D) (-2.391,3.112)
Unlock Deck
Unlock for access to all 129 flashcards in this deck.
Unlock Deck
k this deck
35
Construct a 95 % confidence interval for for a survey that finds 30 % of 240 males and 41 % of 200 females are opposed to the death penalty.
A) (-0.200,-0.021)
B) (-1.532,1.342)
C) (-0.561,0.651)
D) (-1.324,1.512)
for a survey that finds 30 % of 240 males and 41 % of 200 females are opposed to the death penalty.A) (-0.200,-0.021)
B) (-1.532,1.342)
C) (-0.561,0.651)
D) (-1.324,1.512)
Unlock Deck
Unlock for access to all 129 flashcards in this deck.
Unlock Deck
k this deck
36
4 Test hypotheses regarding two proportions from dependent samples. Unlock Deck
Unlock for access to all 129 flashcards in this deck.
Unlock Deck
k this deck
37
A random sample of 100 students at a high school was asked whether they would ask their father or mother forhelp with a financial problem. A second sample of 100 different students was asked the same questionregarding a dating problem. If 43 students in the first sample and 47 students in the second sample replied thatthey turned to their mother rather than their father for help, test the hypothesis of no difference in theproportions. Use α = 0.02.
Unlock Deck
Unlock for access to all 129 flashcards in this deck.
Unlock Deck
k this deck
38
Test whether the population proportions differ at the α = 0.05 level of significance by determining the null andalternative hypotheses, the test statistic, and the P- value. Assume that the samples are dependent and thatthey were obtained randomly.
Unlock Deck
Unlock for access to all 129 flashcards in this deck.
Unlock Deck
k this deck
39
A random sample of 100 students at a high school was asked whether they would ask their father or mother for help with a financial problem. A second sample of 100 different students was asked the same question regarding a dating problem. Forty-three students in the first sample and 47 students in the second sample replied that they turned to their mother rather than their father for help. Construct a 98 % confidence interval for
A) (-0.204,0.124)
B) (-1.324,1.521)
C) (-0.591,0.762)
D) (-1.113,1.311)
A) (-0.204,0.124)
B) (-1.324,1.521)
C) (-0.591,0.762)
D) (-1.113,1.311)
Unlock Deck
Unlock for access to all 129 flashcards in this deck.
Unlock Deck
k this deck
40
Two surgical procedures are widely used to treat a certain type of cancer. To compare the success rates of thetwo procedures, random samples of the two types of surgical patients were obtained and the numbers ofpatients who showed no recurrence of the disease after a 1-year period were recorded. The data are shown inthe table. How large a sample would be necessary in order to estimate the difference in the true success ratesto within 0.10 with 95% reliability?
0.10 with 95% reliability? Unlock Deck
Unlock for access to all 129 flashcards in this deck.
Unlock Deck
k this deck
41
Assume that the paired data came from a population that is normally distributed.A) -0.94
B) -0.76
C) 0.58
D) 0.89
Unlock Deck
Unlock for access to all 129 flashcards in this deck.
Unlock Deck
k this deck
42
A football coach claims that players can increase their strength by taking a certain supplement. To test thetheory, the coach randomly selects 9 athletes and gives them a strength test using a bench press. The results arelisted below. Thirty days later, after regular training using the supplement, they are tested again. The newresults are listed below. Test the claim that the supplement is effective in increasing the athletesʹ strength. Use α= 0.05. Assume that the distribution is normally distributed.
Unlock Deck
Unlock for access to all 129 flashcards in this deck.
Unlock Deck
k this deck
43
Nine students took the SAT. Their scores are listed below. Later on, they read a book on test preparation andretook the SAT. Their new scores are listed below. Construct a 95% confidence interval for μd. Assume that thedistribution is normally distributed.
A) (-30.503, -0.617)
B) (-20.341, 4.852)
C) (-10.321, 15.436)
D) (1.651, 30.590)
A) (-30.503, -0.617)
B) (-20.341, 4.852)
C) (-10.321, 15.436)
D) (1.651, 30.590)
Unlock Deck
Unlock for access to all 129 flashcards in this deck.
Unlock Deck
k this deck
44
Nine students took the SAT. Their scores are listed below. Later on, they read a book on test preparation and retook the SAT. Their new scores are listed below. Test the claim that the book had no effect on their scores. Use α =0.05 . Assume that the distribution is normally distributed.
Unlock Deck
Unlock for access to all 129 flashcards in this deck.
Unlock Deck
k this deck
45
When forming a confidence interval for matched-pair data the point estimate is the
A) mean of the differences.
B) difference of the means.
C) standard deviation of the differences.
D) differences of the standard deviations.
A) mean of the differences.
B) difference of the means.
C) standard deviation of the differences.
D) differences of the standard deviations.
Unlock Deck
Unlock for access to all 129 flashcards in this deck.
Unlock Deck
k this deck
46
Assume that the paired data came from a population that is normally distributed.A) 1.73
B) 1.21
C) 1.32
D) 1.89
Unlock Deck
Unlock for access to all 129 flashcards in this deck.
Unlock Deck
k this deck
47
In a study of the effectiveness of diet on weight loss, 20 people were randomly selected to participate in a dietprogram for 30 days. Test the claim that diet had no bearing on weight loss. Use α = 0.02.. Assume that thedistribution is normally distributed.
Unlock Deck
Unlock for access to all 129 flashcards in this deck.
Unlock Deck
k this deck
48
A pharmaceutical company wishes to test a new drug with the expectation of lowering cholesterol levels. Tensubjects are randomly selected and pretested. The results are listed below. The subjects were placed on thedrug for a period of 6 months, after which their cholesterol levels were tested again. The results are listedbelow. (All units are milligrams per deciliter.) Test the companyʹs claim that the drug lowers cholesterol levels.Use α = 0.01. Assume that the distribution is normally distributed.
Unlock Deck
Unlock for access to all 129 flashcards in this deck.
Unlock Deck
k this deck
49
We are interested in comparing the average supermarket prices of two leading colas in the Tampa area. Oursample was taken by randomly going to each of eight supermarkets and recording the price of a six -pack ofcola of each brand. The data are shown in the following table. Find a 98% confidence interval for the differencein mean price of brand 1 and brand 2. Assume that the paired data came from a population that is normallydistributed.
A) (-0.0779, 0.0029)
B) (-0.1768, 0.1018)
C) (-0.0846, 0.0096)
D) (-0.0722, -0.0028)
A) (-0.0779, 0.0029)
B) (-0.1768, 0.1018)
C) (-0.0846, 0.0096)
D) (-0.0722, -0.0028)
Unlock Deck
Unlock for access to all 129 flashcards in this deck.
Unlock Deck
k this deck
50
A local company is concerned about the number of days missed by its employees due to illness. A randomsample of 10 employees is selected. The number of days absent in one year is listed below. An incentiveprogram is offered in an attempt to decrease the number of days absent. The number of days absent in one yearafter the incentive program is listed below. Test the claim that the incentive program cuts down on the numberof days missed by employees. Use α = 0.05. Assume that the distribution is normally distributed.
Unlock Deck
Unlock for access to all 129 flashcards in this deck.
Unlock Deck
k this deck
51
When performing a hypothesis test upon two dependent samples, the variable of interest is
A) the differences that exist between the matched-pair data.
B) all of the combined data.
C) the absolute value of the differences that exist between the matched-pair data.
D) the data that is the same in both samples.
A) the differences that exist between the matched-pair data.
B) all of the combined data.
C) the absolute value of the differences that exist between the matched-pair data.
D) the data that is the same in both samples.
Unlock Deck
Unlock for access to all 129 flashcards in this deck.
Unlock Deck
k this deck
52
Assume that the paired data came from a population that is normally distributed.A) 7.8
B) 5.6
C) 6.8
D) 8.9
Unlock Deck
Unlock for access to all 129 flashcards in this deck.
Unlock Deck
k this deck
53
Construct a 95% confidence interval for data sets A and B. Data sets A and B are dependent. Assume that the paired data came from a population that is normally distributed.
A) (-0.696, 18.700)
B) (-1.324, 8.981)
C) (-0.113, 12.761)
D) (-15.341, 15.431)
Assume that the paired data came from a population that is normally distributed.A) (-0.696, 18.700)
B) (-1.324, 8.981)
C) (-0.113, 12.761)
D) (-15.341, 15.431)
Unlock Deck
Unlock for access to all 129 flashcards in this deck.
Unlock Deck
k this deck
54
Construct a 99% confidence interval for data sets A and B. Data sets A and B are dependent. Assume that the paired data came from a population that is normally distributed.
A) (-4.502, 2.622)
B) (-25.123, 5.761)
C) (-21.342, 18.982)
D) (-15.123, 15.123)
Assume that the paired data came from a population that is normally distributed.A) (-4.502, 2.622)
B) (-25.123, 5.761)
C) (-21.342, 18.982)
D) (-15.123, 15.123)
Unlock Deck
Unlock for access to all 129 flashcards in this deck.
Unlock Deck
k this deck
55
Robustness in hypothesis testing means
A) departures from normality do not adversely affect the results.
B) there are no departures from normality.
C) the data is effected by outliers.
D) all processes can be exactly duplicated by selecting another pair of samples.
A) departures from normality do not adversely affect the results.
B) there are no departures from normality.
C) the data is effected by outliers.
D) all processes can be exactly duplicated by selecting another pair of samples.
Unlock Deck
Unlock for access to all 129 flashcards in this deck.
Unlock Deck
k this deck
56
A physician claims that a personʹs diastolic blood pressure can be lowered if, instead of taking a drug, theperson meditates each evening. Ten subjects are randomly selected and pretested. Their blood pressures,measured in millimeters of mercury, are listed below. The 10 patients are instructed in basic meditation andtold to practice it each evening for one month. At the end of the month, their blood pressures are taken again.The data are listed below. Test the physicianʹs claim. Use α = 0.01.
Unlock Deck
Unlock for access to all 129 flashcards in this deck.
Unlock Deck
k this deck
57
A new weight-reducing technique, consisting of a liquid protein diet, is currently undergoing tests before itsintroduction into the market. A typical test performed is the following: The weights of a random sample of fivepeople are recorded before they are introduced to the liquid protein diet. The five individuals are theninstructed to follow the liquid protein diet for 3 weeks. At the end of this period, their weights (in pounds) areagain recorded. The results are listed in the table. Let μ1 be the true mean weight of individuals before startingthe diet and let μ2 be the true mean weight of individuals after 3 weeks on the diet. Calculate a 90% confidenceinterval for the difference between the mean weights before and after the diet is used. Assume that the paireddata came from a population that is normally distributed.
Unlock Deck
Unlock for access to all 129 flashcards in this deck.
Unlock Deck
k this deck
58
Assume that the paired data came from a population that is normally distributed. Unlock Deck
Unlock for access to all 129 flashcards in this deck.
Unlock Deck
k this deck
59
Assume that the paired data came from a population that is normally distributed. Unlock Deck
Unlock for access to all 129 flashcards in this deck.
Unlock Deck
k this deck
60
Seven randomly selected plants that bottle the same beverage implemented a time management program in hopes of improving productivity. The average time, in minutes, that it took the companies to produce the same quantity of bottles before and after the program are listed below. Assume the two population distributions are normal. Construct a 90 % confidence interval for Assume that the paired data came from a population that is normally distributed.
A) (0.21,10.93)
B) (1.60,9.54)
C) (-0.22,11.36)
D) (-22,33.3)
Assume that the paired data came from a population that is normally distributed.A) (0.21,10.93)
B) (1.60,9.54)
C) (-0.22,11.36)
D) (-22,33.3)
Unlock Deck
Unlock for access to all 129 flashcards in this deck.
Unlock Deck
k this deck
61
A study was conducted to determine if the salaries of librarians from two neighboring cities were equal. Asample of 15 librarians from each city was randomly selected. The mean from the first city was $28,900 with astandard deviation of $2300. The mean from the second city was $30,300 with a standard deviation of $2100.Test the hypothesis that the salaries from both cities are equal.
Unlock Deck
Unlock for access to all 129 flashcards in this deck.
Unlock Deck
k this deck
62
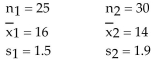
Find the standardized test statistic, t, to test the hypothesis that μ1 = μ2. Two samples are randomly selectedand come from populations that are normal. The sample statistics are given below.
A) -0.954
B) -0.915
C) -1.558
D) -0.909
come from populations that are normal. The sample statistics are given below.A) -0.954
B) -0.915
C) -1.558
D) -0.909
Unlock Deck
Unlock for access to all 129 flashcards in this deck.
Unlock Deck
k this deck
63
Unlock Deck
Unlock for access to all 129 flashcards in this deck.
Unlock Deck
k this deck
64
Unlock Deck
Unlock for access to all 129 flashcards in this deck.
Unlock Deck
k this deck
65
A) 1.282
B) 3.271
C) 2.819
D) 1.865
Unlock Deck
Unlock for access to all 129 flashcards in this deck.
Unlock Deck
k this deck
66
Unlock Deck
Unlock for access to all 129 flashcards in this deck.
Unlock Deck
k this deck
67
Unlock Deck
Unlock for access to all 129 flashcards in this deck.
Unlock Deck
k this deck
68
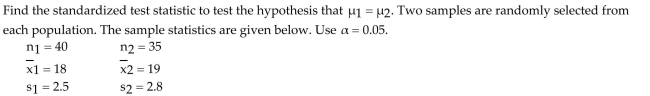
Find the standardized test statistic, t, to test the hypothesis that μ1 ≠ μ2. Two samples are randomly selectedand come from populations that are normal. The sample statistics are given below.
A) -1.546
B) -1.821
C) -2.123
D) -1.326
A) -1.546
B) -1.821
C) -2.123
D) -1.326
Unlock Deck
Unlock for access to all 129 flashcards in this deck.
Unlock Deck
k this deck
69
A) -3.90
B) -3.16
C) -2.63
D) -1.66
Unlock Deck
Unlock for access to all 129 flashcards in this deck.
Unlock Deck
k this deck
70
Unlock Deck
Unlock for access to all 129 flashcards in this deck.
Unlock Deck
k this deck
71
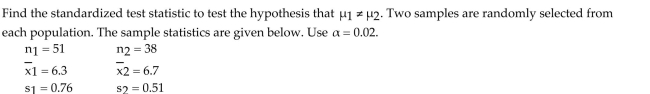
Find the standardized test statistic, t, to test the hypothesis that μ1 < μ2. Two samples are randomly selectedand come from populations that are normal. The sample statistics are given below.
A) -2.450
B) -3.165
C) -1.667
D) -0.669
A) -2.450
B) -3.165
C) -1.667
D) -0.669
Unlock Deck
Unlock for access to all 129 flashcards in this deck.
Unlock Deck
k this deck
72
A) 2.98
B) 2.81
C) 1.86
D) 0.91
Unlock Deck
Unlock for access to all 129 flashcards in this deck.
Unlock Deck
k this deck
73
Unlock Deck
Unlock for access to all 129 flashcards in this deck.
Unlock Deck
k this deck
74
Unlock Deck
Unlock for access to all 129 flashcards in this deck.
Unlock Deck
k this deck
75
Find the standardized test statistic, t , to test the hypothesis that Two samples are randomly selected and come from populations that are normal. The sample statistics are given below.
A) 4.361
B) 3.287
C) 2.892
D) 1.986
Two samples are randomly selected and come from populations that are normal. The sample statistics are given below. A) 4.361
B) 3.287
C) 2.892
D) 1.986
Unlock Deck
Unlock for access to all 129 flashcards in this deck.
Unlock Deck
k this deck
76
A) -1.6
B) -0.8
C) -2.6
D) -1.0
Unlock Deck
Unlock for access to all 129 flashcards in this deck.
Unlock Deck
k this deck
77
A) -2.97
B) -1.82
C) -2.12
D) -2.32
Unlock Deck
Unlock for access to all 129 flashcards in this deck.
Unlock Deck
k this deck
78
Unlock Deck
Unlock for access to all 129 flashcards in this deck.
Unlock Deck
k this deck
79
A) 6.2
B) 8.1
C) 4.2
D) 3.8
Unlock Deck
Unlock for access to all 129 flashcards in this deck.
Unlock Deck
k this deck
80
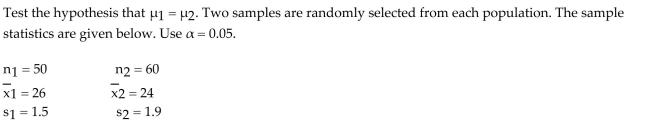
Test the hypothesis that https://storage.examlex.com/TB6004/. Two samples are randomly selected from normal populations. The sample statistics are given below.
. Two samples are randomly selected from normal populations. The sample statistics are given below. Unlock Deck
Unlock for access to all 129 flashcards in this deck.
Unlock Deck
k this deck
Unlock Deck
Unlock for access to all 129 flashcards in this deck.


