Deck 2: Graphical Methods for
Full screen (f)
Question
Knowledge of where animals forage for food is essential for effective wildlifemanagement and conservation. The data below are foraging heights (in m) for asample of Mountain Chickadees. The data are taken from two different species of firtrees: the Douglas fir and the White fir. 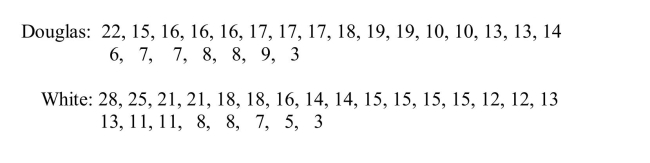 (a) Display these data using a comparative (back-to-back) stem-and-leaf plot. Usethe stems shown below, and be sure to include all information needed to comparethe two distributions.
 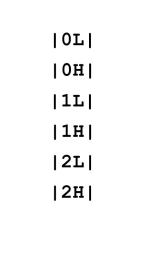 (b) Compare the distributions in part (a). What differences and similarities do youobserve in the two distributions?
(c) When Mountain Chicadees are sampled to assess their health, they are captured inmist-nets, which are set to capture the birds at different heights. The mist nets areabout 2 meters high, and directions must be given to the persons who set up thenests so that the mist-nets are positioned to capture the most birds. Based on thedata from part (a) and your display in part (b), write a short paragraph describingthe appropriate mist-net height in a forest region of Douglas firs and for a forestregion of White firs.
(a) Display these data using a comparative (back-to-back) stem-and-leaf plot. Usethe stems shown below, and be sure to include all information needed to comparethe two distributions. (b) Compare the distributions in part (a). What differences and similarities do youobserve in the two distributions?(c) When Mountain Chicadees are sampled to assess their health, they are captured inmist-nets, which are set to capture the birds at different heights. The mist nets areabout 2 meters high, and directions must be given to the persons who set up thenests so that the mist-nets are positioned to capture the most birds. Based on thedata from part (a) and your display in part (b), write a short paragraph describingthe appropriate mist-net height in a forest region of Douglas firs and for a forestregion of White firs.
Question
Question
Question
Question
The stem-and-leaf plot below displays the weights (in ounces) for a random sample oftomatoes grown on a local farm 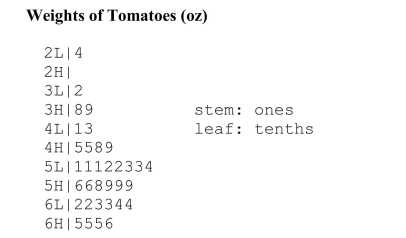
(a) Briefly describe the distribution of tomato weights.(b) What is the weight of the heaviest tomato in the sample?
(a) Briefly describe the distribution of tomato weights.(b) What is the weight of the heaviest tomato in the sample?
Question
Question
Question
Question
Question
Question
The article "New Rules Would Protect Students" (USA Today, June 16, 2010)reported the percentage of students who received loans to attend college that haddefaulted on the loan within 3 years of when the student was scheduled to beginrepayment of the loan. Information was given for public colleges, private non-profitcolleges, and for-profit colleges. 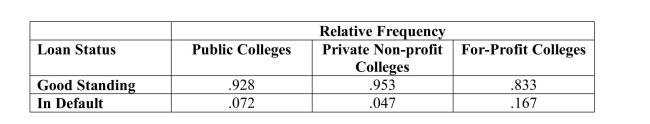 a) Construct a comparative bar chart that would allow you to compare loan status forthe three types of colleges.b) The article states "those who attended for-profit schools were more likely todefault than those who attended public or private non-profit schools." What aspectof the comparative bar chart supports this statement?
a) Construct a comparative bar chart that would allow you to compare loan status forthe three types of colleges.b) The article states "those who attended for-profit schools were more likely todefault than those who attended public or private non-profit schools." What aspectof the comparative bar chart supports this statement? Question
A report in the Des Moines Register presented the average number of years ofteaching experience for the teachers in elementary schools in Des Moines, Iowa.These data appear in the table below. 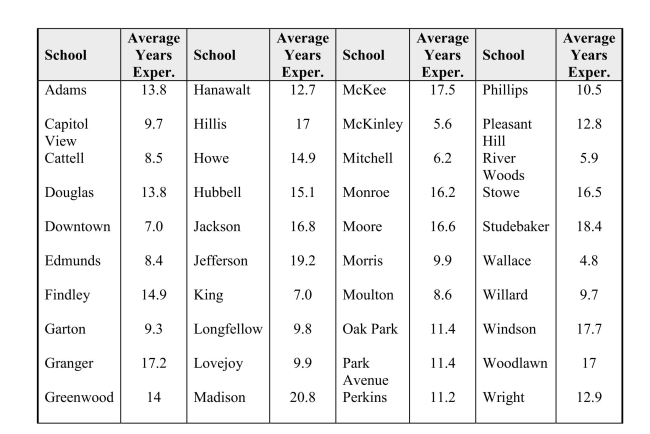 (a) Sketch a histogram for these data, using the following class intervals:0 to < 44 to < 8, etc.(b) Describe the distribution of the average number of years of teaching experience,and note any unusual features.problem #2 also reported thepercent of children eligible forFree and Reduced lunch to teacherexperience. The percent ofchildren eligible for Free/Reducedlunch is an indicator of the socio
(a) Sketch a histogram for these data, using the following class intervals:0 to < 44 to < 8, etc.(b) Describe the distribution of the average number of years of teaching experience,and note any unusual features.problem #2 also reported thepercent of children eligible forFree and Reduced lunch to teacherexperience. The percent ofchildren eligible for Free/Reducedlunch is an indicator of the socio Question
Artificial bird nests have been used extensively when studying predator behavior.Biologists have assumed predators will find and respond to artificial and natural nestsin the same way. In a study to test this assumption the predation of 27 AmericanRobin (Turdus migratorius) nests and 27 artificial wicker-basket nests werecompared. Artificial nests were placed 30m from existing robin's nests in a randomlychosen direction. The natural nests and artificial nests were checked at 5-dayintervals, and the number of nests (out of 27) that had been disturbed by predators inthe interval was noted. The results are as follows: 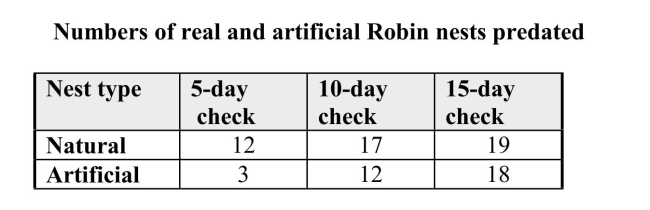 (a) Using a single set of axes, construct time series plots for (a) the number of naturalnests disturbed by predators and (b) the number of artificial nests disturbed bypredators.(b) Does it appear that the artificial and natural nests have the same pattern ofpredation through time?
Justify your answer by appealing to specific aspects ofyour plot in part (a).
(a) Using a single set of axes, construct time series plots for (a) the number of naturalnests disturbed by predators and (b) the number of artificial nests disturbed bypredators.(b) Does it appear that the artificial and natural nests have the same pattern ofpredation through time?Justify your answer by appealing to specific aspects ofyour plot in part (a).
Question
Hoofed animals such as cattle and sheep are classified as browsers (leaf eaters) andgrazers (grass eaters). Some biologists believe that the incisor arcade of the teeth,diagrammed below, is shaped differently for browsers and grazers, affecting theirfood selection. The "curvature" of an incisor arcade is a measure of its shape; largevalues indicate a longer, thinner mouth and small values a shorter, wider mouth. Theback-to-back stem-and-leaf plot below compares the curvatures of incisor arcades fordifferent species of browsers and grazers. 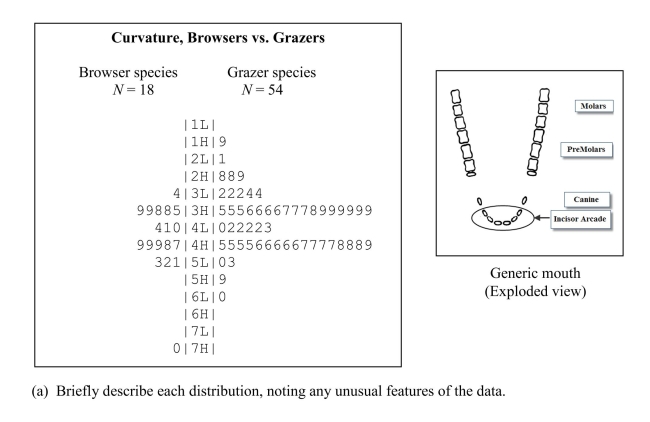 (b) Some biologists believe browsers have thinner mouths because leafed plantsfrequently have thorns and spines. They think that browsers have evolved thinnermouths to get beyond the thorns and spines to the food part of the plant. Are thedata in the back-to-back stem-and-leaf plot consistent with this theory?
Justifyyour answer by appealing to specific aspect(s) of the plot.
(b) Some biologists believe browsers have thinner mouths because leafed plantsfrequently have thorns and spines. They think that browsers have evolved thinnermouths to get beyond the thorns and spines to the food part of the plant. Are thedata in the back-to-back stem-and-leaf plot consistent with this theory?Justifyyour answer by appealing to specific aspect(s) of the plot.
Question
Question
The Des Moines Register article in 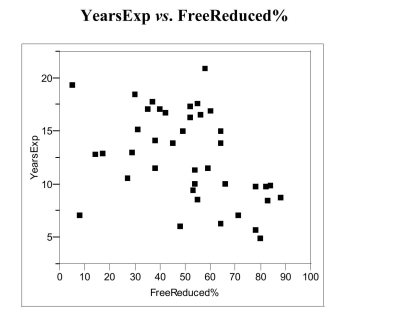 economic status of aneighborhood. The Register wasconcerned that less experiencedteachers typically teach studentsfrom lower-income families. Theaccompanying scatter plot displaysthe data from the article.(a) If lesser experienced teachers typical ly teach students from low-income families,what sort of trend or pattern should appear in the scatter plot?
(b) Does this trend or pattern emerge in these data?
Explain, referring to specificaspects of the scatterplot.
economic status of aneighborhood. The Register wasconcerned that less experiencedteachers typically teach studentsfrom lower-income families. Theaccompanying scatter plot displaysthe data from the article.(a) If lesser experienced teachers typical ly teach students from low-income families,what sort of trend or pattern should appear in the scatter plot?(b) Does this trend or pattern emerge in these data?
Explain, referring to specificaspects of the scatterplot.
Question
Question
Question
One of the "media messages" sent by television is that appearance is very important.These messages are thought to spur young women to have unrealistic expectationsabout beauty, thus encouraging women to spend more money on cosmetics andtoiletries. During a recent prime-time television season investigators kept track of"appearance" comments. Data on comments by TV males, classified by gender of thecomment recipient and type of appearance comment, are given in the table below. 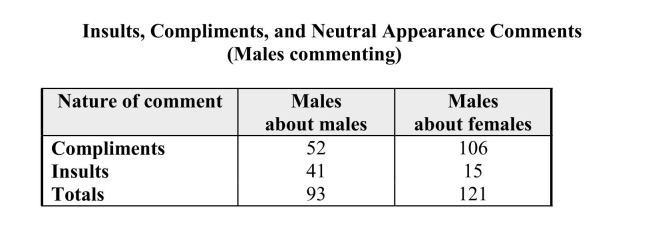 (a) Graphically present these data by constructing a comparative bar chart that wouldallow you to compare the comments about males and females.(b) Using the information in the table, write a few sentences about how thecomments differ for male recipients and female recipients.
(a) Graphically present these data by constructing a comparative bar chart that wouldallow you to compare the comments about males and females.(b) Using the information in the table, write a few sentences about how thecomments differ for male recipients and female recipients. Question
Question
Question
A report in the Des Moines Register presented on the percentages of students whoqualify for Free/Reduced lunch programs in the elementary schools in Des Moines,Iowa. These data appear in the table below. 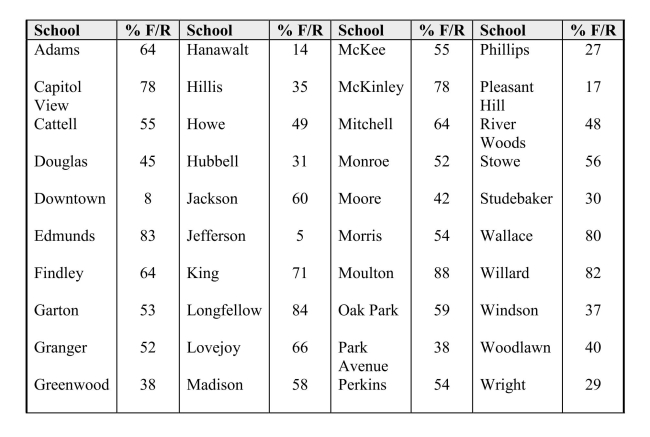 (a) Sketch a histogram for these data, using the following class intervals:0 to < 2020 to < 40, etc.(b) Describe the distribution of Free/Reduced eligibility percents, and note anyunusual features.
(a) Sketch a histogram for these data, using the following class intervals:0 to < 2020 to < 40, etc.(b) Describe the distribution of Free/Reduced eligibility percents, and note anyunusual features. Question
As part of the United States Census, data is collected on the number of persons in eachhousehold. The census data for four decades are summarized below.(a) In a few sentences describe how theproportion of households with 4people has changed from 1970 to 2000. 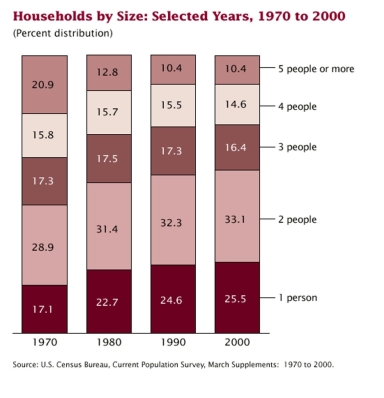 (b) What size of household appears to have decreased the most from 1970 to 2000?
(b) What size of household appears to have decreased the most from 1970 to 2000? Question
The Des Moines Register article in YearsExp vs. FreeReduced%problem #2 also related the percentReduced lunch to teacherexperience. The percent ofchildren eligible for Free/Reducedlunch is an indicator of the socioeconomic status of a neighbor-of children eligible for Free and 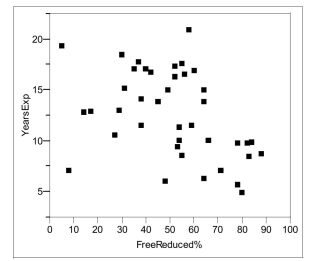 hood. The Register was concernedthat less experienced teacherstypically teach students from lowincome families. Theaccompanying scatter plot displaysthe data from the article.(a) If lesser experienced teachers typical ly teach students from low-income families,what sort of trend or pattern should appear in the scatter plot?
(b) Does this trend or pattern emerge in these data?
Explain, referring to specificaspects of the scatterplot.
hood. The Register was concernedthat less experienced teacherstypically teach students from lowincome families. Theaccompanying scatter plot displaysthe data from the article.(a) If lesser experienced teachers typical ly teach students from low-income families,what sort of trend or pattern should appear in the scatter plot?(b) Does this trend or pattern emerge in these data?
Explain, referring to specificaspects of the scatterplot.
Question
The average circumferences (distances around) in mm of the humerus, femur, and tibiaof different species of mammals are displayed below. These long bones primarilysupport the body mass in mammals. Each data value is the mean circumference forthe available measures for a single species.the distributions of these different bones.(a) Describe the differences and similarities in 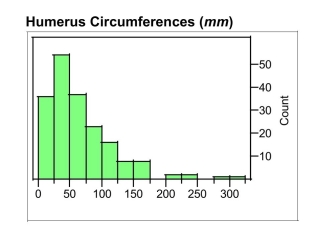 (b) Biologists speculate that greater weights
 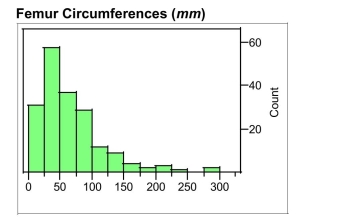 might be supported by larger bones. Based onthe histograms, if the biologists' speculationsare correct, which of these bones (humerus,femur, or tibia) would seem to be the leastable to support a large weight?
Explain,referring to specific aspects of the histograms.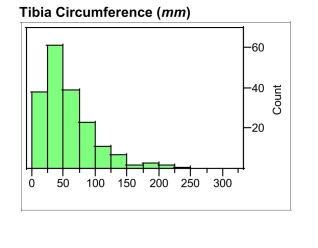
(b) Biologists speculate that greater weights might be supported by larger bones. Based onthe histograms, if the biologists' speculationsare correct, which of these bones (humerus,femur, or tibia) would seem to be the leastable to support a large weight?Explain,referring to specific aspects of the histograms.
Question
A study by the National Bureau of 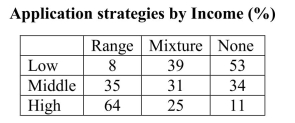 group. The three application strategiesidentified are: apply to a range ofcolleges, some selective some not; applyto no selective colleges; or, finally, use amix of other strategies, such asand one non-selective college.The percentages of students usingthese strategies, broken down byincome, is shown in the table andapplying to one selective college
 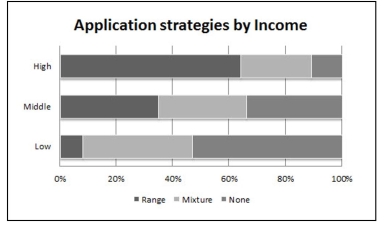 the segmented bar chart.In a few sentences describe howthe college application strategiesdiffer for the low, middle, andhigh income groups.
group. The three application strategiesidentified are: apply to a range ofcolleges, some selective some not; applyto no selective colleges; or, finally, use amix of other strategies, such asand one non-selective college.The percentages of students usingthese strategies, broken down byincome, is shown in the table andapplying to one selective college the segmented bar chart.In a few sentences describe howthe college application strategiesdiffer for the low, middle, andhigh income groups. Question
During the first six months of the American Civil War, armies were amassed as neverbefore in history. Large groups of men, transported far from home, lived inconditions that bred sickness. In a recent study involving Confederate muster rolls, aresearcher constructed a cumulative relative frequency distribution of the percentagesof Confederate soldiers reported sick for each company. A "Company" is a unit ofsoldiers, usually between about 70 and 120 in size. The cumulative relativefrequency distribution for December, 1861, is shown below. 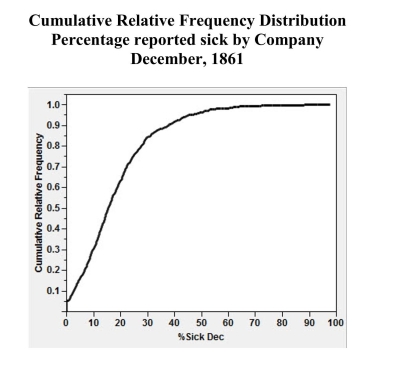 (a) Approximately what proportion of the Confederate companies had less than 10%sick?
(b) Approximately wh at proportion of the Confederate companies had more than 30%sick?
(c) Approximately 50% of the companies had less than what percentage of soldierssick?
(a) Approximately what proportion of the Confederate companies had less than 10%sick?(b) Approximately wh at proportion of the Confederate companies had more than 30%sick?
(c) Approximately 50% of the companies had less than what percentage of soldierssick?
Question
It is well known that the order of the questions in a survey can affect the responses.This is thought to occur because issues raised in one question are remembered whenresponding to later questions. In 1948 many people in the United States wereconcerned about the spread of communism as a political and economic philosophy. Asurvey given that year contained both of the following questions:(i) Do you think the United States should let Communist newspaper reportersfrom other countries come in here and send back to their papers the news asthey see it?
(ii) Do you think a Communist country like Russia should let Americannewspaper reporters come in and send back to America the news as they seeit?
The following table contains the percentages of the Yes/No answers to question (i)given by respondents when asked these questions in different orders.Responses to Communist reporter question in 1948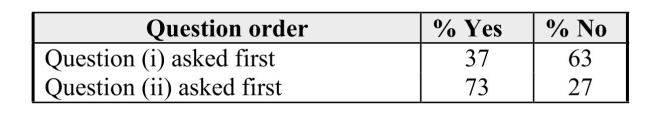
(a) Construct a comparative bar chart using these response percentages.
(b) Do you think the order of the questions made a difference in the responses?
Explain why or why not in a few sentences.
Question
Information about the Spanish missions 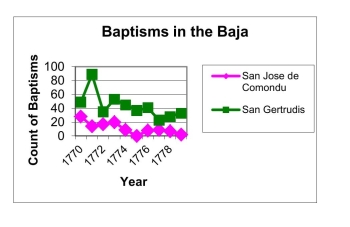 displays two time series of the numbersof baptisms at two Central Bajamissions, San Jose de Comondu and SanGertrudis.In a short paragraph describe and compare the trends in the number of baptisms forthe two missions in this time period, noting any interesting features apparent in theplots.
displays two time series of the numbersof baptisms at two Central Bajamissions, San Jose de Comondu and SanGertrudis.In a short paragraph describe and compare the trends in the number of baptisms forthe two missions in this time period, noting any interesting features apparent in theplots. Question
Marine biologists have reported the discovery of a new species of fish in the WesternNorth Atlantic. Data on the head length (n=41) and pelvic fin length (n=30) areshown below. 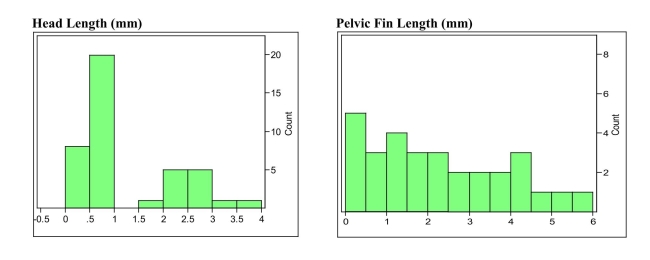
a) Describe the distributions of these two variables using appropriate statisticalterms.
b) The distribution of head lengths appears to be rather strange. What do you thinkmight account for the shape of this distribution?
a) Describe the distributions of these two variables using appropriate statisticalterms.
b) The distribution of head lengths appears to be rather strange. What do you thinkmight account for the shape of this distribution?
Question
During the first six months of the American Civil War, armies were amassed as neverbefore in history. Large groups of men, transported far from home, lived inconditions that bred sickness. In a recent study involving Confederate muster rolls, aresearcher constructed a cumulative relative frequency distribution of the percentagesof Confederate soldiers reported sick for each company. A "Company" is a unit ofsoldiers, usually between about 70 and 120 in size. The cumulative relativefrequency distribution for October, 1861, is shown below. 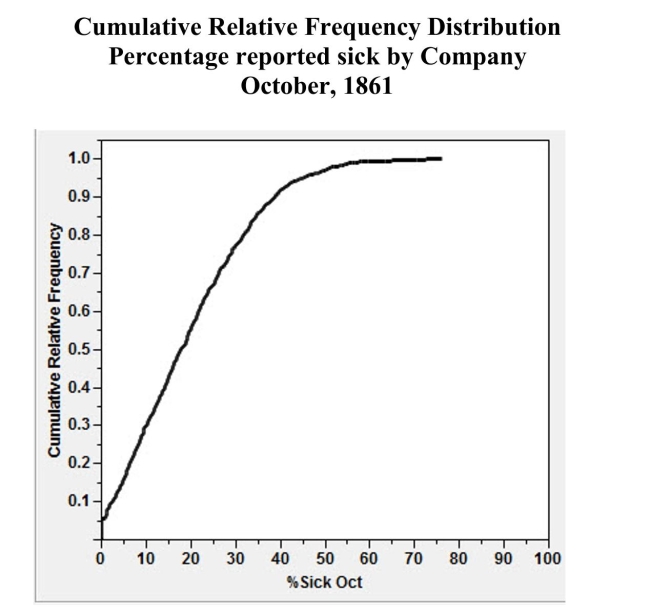 (a) Approximately what proportion of the Confederate companies had less than 10%sick?
(b) Approximately w hat proportion of the Confederate companies had more than 30%sick?
(c) Approximately 50% of the companies had less than what percentage of soldierssick?
(a) Approximately what proportion of the Confederate companies had less than 10%sick?(b) Approximately w hat proportion of the Confederate companies had more than 30%sick?
(c) Approximately 50% of the companies had less than what percentage of soldierssick?

Unlock Deck
Sign up to unlock the cards in this deck!
Unlock Deck
Unlock Deck
1/31
Play
Full screen (f)
Deck 2: Graphical Methods for
1
Knowledge of where animals forage for food is essential for effective wildlifemanagement and conservation. The data below are foraging heights (in m) for asample of Mountain Chickadees. The data are taken from two different species of firtrees: the Douglas fir and the White fir. (a) Display these data using a comparative (back-to-back) stem-and-leaf plot. Usethe stems shown below, and be sure to include all information needed to comparethe two distributions. (b) Compare the distributions in part (a). What differences and similarities do youobserve in the two distributions?
(c) When Mountain Chicadees are sampled to assess their health, they are captured inmist-nets, which are set to capture the birds at different heights. The mist nets areabout 2 meters high, and directions must be given to the persons who set up thenests so that the mist-nets are positioned to capture the most birds. Based on thedata from part (a) and your display in part (b), write a short paragraph describingthe appropriate mist-net height in a forest region of Douglas firs and for a forestregion of White firs.
(a) Display these data using a comparative (back-to-back) stem-and-leaf plot. Usethe stems shown below, and be sure to include all information needed to comparethe two distributions. (b) Compare the distributions in part (a). What differences and similarities do youobserve in the two distributions?(c) When Mountain Chicadees are sampled to assess their health, they are captured inmist-nets, which are set to capture the birds at different heights. The mist nets areabout 2 meters high, and directions must be given to the persons who set up thenests so that the mist-nets are positioned to capture the most birds. Based on thedata from part (a) and your display in part (b), write a short paragraph describingthe appropriate mist-net height in a forest region of Douglas firs and for a forestregion of White firs.
a) Foraging heights of Mountain Chickadees (m) 
b) The two distributions are similar in being reasonably symmetric.The distribution for Douglas firs is less widely spread out, and the values are generally a little lower than for the White firs.
c) To capture the most birds with a 2m high net, the 2m range where the data is most concentrated must be estimated.In a stand of Douglas pine the most dense part of the distribution is from about 0.5 to 1.5 meters off the ground. In a stand of White pine the most dense part of the distribution appears to be about 1.0 to 2.0 meters off the ground.
2
When using histograms to compare groups of different sizes, one mayuse either frequencies or relative frequencies for the vertical axis and stillbe effective.
False
3
If the upper tail of a distribution stretches out farther than the lower tail,the distribution is negatively skewed.
False
4
A numerical variable is continuous if it's possible values correspond toisolated points on the number line.
Unlock Deck
Unlock for access to all 31 flashcards in this deck.
Unlock Deck
k this deck
5
The stem-and-leaf plot below displays the weights (in ounces) for a random sample oftomatoes grown on a local farm
(a) Briefly describe the distribution of tomato weights.(b) What is the weight of the heaviest tomato in the sample?
(a) Briefly describe the distribution of tomato weights.(b) What is the weight of the heaviest tomato in the sample?
Unlock Deck
Unlock for access to all 31 flashcards in this deck.
Unlock Deck
k this deck
6
In a scatter plot, both the horizontal and vertical axes must start at zero.
Unlock Deck
Unlock for access to all 31 flashcards in this deck.
Unlock Deck
k this deck
7
A pie chart is most useful for numeric data.
Unlock Deck
Unlock for access to all 31 flashcards in this deck.
Unlock Deck
k this deck
8
An outlier is a data value that is unusually far from the rest of the valuesin a data set.
Unlock Deck
Unlock for access to all 31 flashcards in this deck.
Unlock Deck
k this deck
9
A univariate data set must contain numerical, not categorical, data.
Unlock Deck
Unlock for access to all 31 flashcards in this deck.
Unlock Deck
k this deck
10
A time series plot is a graph of data that has been gathered at differentpoints in time.
Unlock Deck
Unlock for access to all 31 flashcards in this deck.
Unlock Deck
k this deck
11
The article "New Rules Would Protect Students" (USA Today, June 16, 2010)reported the percentage of students who received loans to attend college that haddefaulted on the loan within 3 years of when the student was scheduled to beginrepayment of the loan. Information was given for public colleges, private non-profitcolleges, and for-profit colleges. a) Construct a comparative bar chart that would allow you to compare loan status forthe three types of colleges.b) The article states "those who attended for-profit schools were more likely todefault than those who attended public or private non-profit schools." What aspectof the comparative bar chart supports this statement?
a) Construct a comparative bar chart that would allow you to compare loan status forthe three types of colleges.b) The article states "those who attended for-profit schools were more likely todefault than those who attended public or private non-profit schools." What aspectof the comparative bar chart supports this statement? Unlock Deck
Unlock for access to all 31 flashcards in this deck.
Unlock Deck
k this deck
12
A report in the Des Moines Register presented the average number of years ofteaching experience for the teachers in elementary schools in Des Moines, Iowa.These data appear in the table below. (a) Sketch a histogram for these data, using the following class intervals:0 to < 44 to < 8, etc.(b) Describe the distribution of the average number of years of teaching experience,and note any unusual features.problem #2 also reported thepercent of children eligible forFree and Reduced lunch to teacherexperience. The percent ofchildren eligible for Free/Reducedlunch is an indicator of the socio
(a) Sketch a histogram for these data, using the following class intervals:0 to < 44 to < 8, etc.(b) Describe the distribution of the average number of years of teaching experience,and note any unusual features.problem #2 also reported thepercent of children eligible forFree and Reduced lunch to teacherexperience. The percent ofchildren eligible for Free/Reducedlunch is an indicator of the socio Unlock Deck
Unlock for access to all 31 flashcards in this deck.
Unlock Deck
k this deck
13
Artificial bird nests have been used extensively when studying predator behavior.Biologists have assumed predators will find and respond to artificial and natural nestsin the same way. In a study to test this assumption the predation of 27 AmericanRobin (Turdus migratorius) nests and 27 artificial wicker-basket nests werecompared. Artificial nests were placed 30m from existing robin's nests in a randomlychosen direction. The natural nests and artificial nests were checked at 5-dayintervals, and the number of nests (out of 27) that had been disturbed by predators inthe interval was noted. The results are as follows: (a) Using a single set of axes, construct time series plots for (a) the number of naturalnests disturbed by predators and (b) the number of artificial nests disturbed bypredators.(b) Does it appear that the artificial and natural nests have the same pattern ofpredation through time?
Justify your answer by appealing to specific aspects ofyour plot in part (a).
(a) Using a single set of axes, construct time series plots for (a) the number of naturalnests disturbed by predators and (b) the number of artificial nests disturbed bypredators.(b) Does it appear that the artificial and natural nests have the same pattern ofpredation through time?Justify your answer by appealing to specific aspects ofyour plot in part (a).
Unlock Deck
Unlock for access to all 31 flashcards in this deck.
Unlock Deck
k this deck
14
Hoofed animals such as cattle and sheep are classified as browsers (leaf eaters) andgrazers (grass eaters). Some biologists believe that the incisor arcade of the teeth,diagrammed below, is shaped differently for browsers and grazers, affecting theirfood selection. The "curvature" of an incisor arcade is a measure of its shape; largevalues indicate a longer, thinner mouth and small values a shorter, wider mouth. Theback-to-back stem-and-leaf plot below compares the curvatures of incisor arcades fordifferent species of browsers and grazers. (b) Some biologists believe browsers have thinner mouths because leafed plantsfrequently have thorns and spines. They think that browsers have evolved thinnermouths to get beyond the thorns and spines to the food part of the plant. Are thedata in the back-to-back stem-and-leaf plot consistent with this theory?
Justifyyour answer by appealing to specific aspect(s) of the plot.
(b) Some biologists believe browsers have thinner mouths because leafed plantsfrequently have thorns and spines. They think that browsers have evolved thinnermouths to get beyond the thorns and spines to the food part of the plant. Are thedata in the back-to-back stem-and-leaf plot consistent with this theory?Justifyyour answer by appealing to specific aspect(s) of the plot.
Unlock Deck
Unlock for access to all 31 flashcards in this deck.
Unlock Deck
k this deck
15
A segmented bar chart uses rectangles rather than circles to displaydifferent categories in a set of data.
Unlock Deck
Unlock for access to all 31 flashcards in this deck.
Unlock Deck
k this deck
16
The Des Moines Register article in economic status of aneighborhood. The Register wasconcerned that less experiencedteachers typically teach studentsfrom lower-income families. Theaccompanying scatter plot displaysthe data from the article.(a) If lesser experienced teachers typical ly teach students from low-income families,what sort of trend or pattern should appear in the scatter plot?
(b) Does this trend or pattern emerge in these data?
Explain, referring to specificaspects of the scatterplot.
economic status of aneighborhood. The Register wasconcerned that less experiencedteachers typically teach studentsfrom lower-income families. Theaccompanying scatter plot displaysthe data from the article.(a) If lesser experienced teachers typical ly teach students from low-income families,what sort of trend or pattern should appear in the scatter plot?(b) Does this trend or pattern emerge in these data?
Explain, referring to specificaspects of the scatterplot.
Unlock Deck
Unlock for access to all 31 flashcards in this deck.
Unlock Deck
k this deck
17
In a histogram, class intervals are required to be the same length.
Unlock Deck
Unlock for access to all 31 flashcards in this deck.
Unlock Deck
k this deck
18
A unimodal set of data is one that contains only one variable.
Unlock Deck
Unlock for access to all 31 flashcards in this deck.
Unlock Deck
k this deck
19
One of the "media messages" sent by television is that appearance is very important.These messages are thought to spur young women to have unrealistic expectationsabout beauty, thus encouraging women to spend more money on cosmetics andtoiletries. During a recent prime-time television season investigators kept track of"appearance" comments. Data on comments by TV males, classified by gender of thecomment recipient and type of appearance comment, are given in the table below. (a) Graphically present these data by constructing a comparative bar chart that wouldallow you to compare the comments about males and females.(b) Using the information in the table, write a few sentences about how thecomments differ for male recipients and female recipients.
(a) Graphically present these data by constructing a comparative bar chart that wouldallow you to compare the comments about males and females.(b) Using the information in the table, write a few sentences about how thecomments differ for male recipients and female recipients. Unlock Deck
Unlock for access to all 31 flashcards in this deck.
Unlock Deck
k this deck
20
A bar chart is a graphical display of categorical data.
Unlock Deck
Unlock for access to all 31 flashcards in this deck.
Unlock Deck
k this deck
21
It is well known that the order of the questions in a survey can affect the responses.This is thought to occur because issues raised in one question are remembered whenresponding to later questions. In 1974 a survey asked the following questions aboutdoctors and lawyers: 1. Would you say that most doctors in this country are really interested in thepublic good, or are most doctors just out to make a lot of money?
Unlock Deck
Unlock for access to all 31 flashcards in this deck.
Unlock Deck
k this deck
22
A report in the Des Moines Register presented on the percentages of students whoqualify for Free/Reduced lunch programs in the elementary schools in Des Moines,Iowa. These data appear in the table below. (a) Sketch a histogram for these data, using the following class intervals:0 to < 2020 to < 40, etc.(b) Describe the distribution of Free/Reduced eligibility percents, and note anyunusual features.
(a) Sketch a histogram for these data, using the following class intervals:0 to < 2020 to < 40, etc.(b) Describe the distribution of Free/Reduced eligibility percents, and note anyunusual features. Unlock Deck
Unlock for access to all 31 flashcards in this deck.
Unlock Deck
k this deck
23
As part of the United States Census, data is collected on the number of persons in eachhousehold. The census data for four decades are summarized below.(a) In a few sentences describe how theproportion of households with 4people has changed from 1970 to 2000. (b) What size of household appears to have decreased the most from 1970 to 2000?
(b) What size of household appears to have decreased the most from 1970 to 2000? Unlock Deck
Unlock for access to all 31 flashcards in this deck.
Unlock Deck
k this deck
24
The Des Moines Register article in YearsExp vs. FreeReduced%problem #2 also related the percentReduced lunch to teacherexperience. The percent ofchildren eligible for Free/Reducedlunch is an indicator of the socioeconomic status of a neighbor-of children eligible for Free and hood. The Register was concernedthat less experienced teacherstypically teach students from lowincome families. Theaccompanying scatter plot displaysthe data from the article.(a) If lesser experienced teachers typical ly teach students from low-income families,what sort of trend or pattern should appear in the scatter plot?
(b) Does this trend or pattern emerge in these data?
Explain, referring to specificaspects of the scatterplot.
hood. The Register was concernedthat less experienced teacherstypically teach students from lowincome families. Theaccompanying scatter plot displaysthe data from the article.(a) If lesser experienced teachers typical ly teach students from low-income families,what sort of trend or pattern should appear in the scatter plot?(b) Does this trend or pattern emerge in these data?
Explain, referring to specificaspects of the scatterplot.
Unlock Deck
Unlock for access to all 31 flashcards in this deck.
Unlock Deck
k this deck
25
The average circumferences (distances around) in mm of the humerus, femur, and tibiaof different species of mammals are displayed below. These long bones primarilysupport the body mass in mammals. Each data value is the mean circumference forthe available measures for a single species.the distributions of these different bones.(a) Describe the differences and similarities in (b) Biologists speculate that greater weights might be supported by larger bones. Based onthe histograms, if the biologists' speculationsare correct, which of these bones (humerus,femur, or tibia) would seem to be the leastable to support a large weight?
Explain,referring to specific aspects of the histograms.
(b) Biologists speculate that greater weights might be supported by larger bones. Based onthe histograms, if the biologists' speculationsare correct, which of these bones (humerus,femur, or tibia) would seem to be the leastable to support a large weight?Explain,referring to specific aspects of the histograms.
Unlock Deck
Unlock for access to all 31 flashcards in this deck.
Unlock Deck
k this deck
26
A study by the National Bureau of group. The three application strategiesidentified are: apply to a range ofcolleges, some selective some not; applyto no selective colleges; or, finally, use amix of other strategies, such asand one non-selective college.The percentages of students usingthese strategies, broken down byincome, is shown in the table andapplying to one selective college the segmented bar chart.In a few sentences describe howthe college application strategiesdiffer for the low, middle, andhigh income groups.
group. The three application strategiesidentified are: apply to a range ofcolleges, some selective some not; applyto no selective colleges; or, finally, use amix of other strategies, such asand one non-selective college.The percentages of students usingthese strategies, broken down byincome, is shown in the table andapplying to one selective college the segmented bar chart.In a few sentences describe howthe college application strategiesdiffer for the low, middle, andhigh income groups. Unlock Deck
Unlock for access to all 31 flashcards in this deck.
Unlock Deck
k this deck
27
During the first six months of the American Civil War, armies were amassed as neverbefore in history. Large groups of men, transported far from home, lived inconditions that bred sickness. In a recent study involving Confederate muster rolls, aresearcher constructed a cumulative relative frequency distribution of the percentagesof Confederate soldiers reported sick for each company. A "Company" is a unit ofsoldiers, usually between about 70 and 120 in size. The cumulative relativefrequency distribution for December, 1861, is shown below. (a) Approximately what proportion of the Confederate companies had less than 10%sick?
(b) Approximately wh at proportion of the Confederate companies had more than 30%sick?
(c) Approximately 50% of the companies had less than what percentage of soldierssick?
(a) Approximately what proportion of the Confederate companies had less than 10%sick?(b) Approximately wh at proportion of the Confederate companies had more than 30%sick?
(c) Approximately 50% of the companies had less than what percentage of soldierssick?
Unlock Deck
Unlock for access to all 31 flashcards in this deck.
Unlock Deck
k this deck
28
It is well known that the order of the questions in a survey can affect the responses.This is thought to occur because issues raised in one question are remembered whenresponding to later questions. In 1948 many people in the United States wereconcerned about the spread of communism as a political and economic philosophy. Asurvey given that year contained both of the following questions:(i) Do you think the United States should let Communist newspaper reportersfrom other countries come in here and send back to their papers the news asthey see it?
(ii) Do you think a Communist country like Russia should let Americannewspaper reporters come in and send back to America the news as they seeit?
The following table contains the percentages of the Yes/No answers to question (i)given by respondents when asked these questions in different orders.Responses to Communist reporter question in 1948
(a) Construct a comparative bar chart using these response percentages.
(b) Do you think the order of the questions made a difference in the responses?
Explain why or why not in a few sentences.
(ii) Do you think a Communist country like Russia should let Americannewspaper reporters come in and send back to America the news as they seeit?
The following table contains the percentages of the Yes/No answers to question (i)given by respondents when asked these questions in different orders.Responses to Communist reporter question in 1948
(a) Construct a comparative bar chart using these response percentages.
(b) Do you think the order of the questions made a difference in the responses?
Explain why or why not in a few sentences.
Unlock Deck
Unlock for access to all 31 flashcards in this deck.
Unlock Deck
k this deck
29
Information about the Spanish missions displays two time series of the numbersof baptisms at two Central Bajamissions, San Jose de Comondu and SanGertrudis.In a short paragraph describe and compare the trends in the number of baptisms forthe two missions in this time period, noting any interesting features apparent in theplots.
displays two time series of the numbersof baptisms at two Central Bajamissions, San Jose de Comondu and SanGertrudis.In a short paragraph describe and compare the trends in the number of baptisms forthe two missions in this time period, noting any interesting features apparent in theplots. Unlock Deck
Unlock for access to all 31 flashcards in this deck.
Unlock Deck
k this deck
30
Marine biologists have reported the discovery of a new species of fish in the WesternNorth Atlantic. Data on the head length (n=41) and pelvic fin length (n=30) areshown below.
a) Describe the distributions of these two variables using appropriate statisticalterms.
b) The distribution of head lengths appears to be rather strange. What do you thinkmight account for the shape of this distribution?
a) Describe the distributions of these two variables using appropriate statisticalterms.
b) The distribution of head lengths appears to be rather strange. What do you thinkmight account for the shape of this distribution?
Unlock Deck
Unlock for access to all 31 flashcards in this deck.
Unlock Deck
k this deck
31
During the first six months of the American Civil War, armies were amassed as neverbefore in history. Large groups of men, transported far from home, lived inconditions that bred sickness. In a recent study involving Confederate muster rolls, aresearcher constructed a cumulative relative frequency distribution of the percentagesof Confederate soldiers reported sick for each company. A "Company" is a unit ofsoldiers, usually between about 70 and 120 in size. The cumulative relativefrequency distribution for October, 1861, is shown below. (a) Approximately what proportion of the Confederate companies had less than 10%sick?
(b) Approximately w hat proportion of the Confederate companies had more than 30%sick?
(c) Approximately 50% of the companies had less than what percentage of soldierssick?
(a) Approximately what proportion of the Confederate companies had less than 10%sick?(b) Approximately w hat proportion of the Confederate companies had more than 30%sick?
(c) Approximately 50% of the companies had less than what percentage of soldierssick?
Unlock Deck
Unlock for access to all 31 flashcards in this deck.
Unlock Deck
k this deck
Unlock Deck
Unlock for access to all 31 flashcards in this deck.


