Deck 19: Data
Full screen (f)
Question
Adjust for different slopes using interaction terms in multiple regression.
A sample of 30 companies was randomly selected for a study investigating what
Factors affect the size of company bonuses. Data were collected on the number of
Employees at the company and whether or not the employees were unionized (1 = yes,
0 = no). The following multiple regression model was fit to the data. Based on this
Model, what is the annual average bonus for a company with 5000 employees that are
Unionized?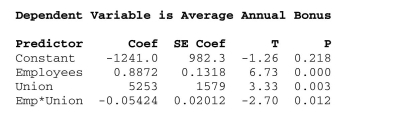
A) $3195
B) $8176.80
C) $5253
D) $7980.25
E) $10,259.20
Question
Use indicator (dummy) variables in multiple regression.
A sample of 30 companies was randomly selected for a study investigating what
Factors affect the size of company bonuses. Data were collected on the number of
Employees at the company and whether or not the employees were unionized (1 = yes,
0 = no). The following multiple regression model was fit to the data. The correct
Interpretation of the regression coefficient of Union is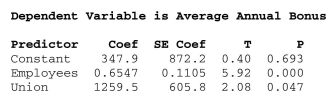
A) that the annual average bonus is $605.80 less, on average, for unionized companies compared to non-unionized companies of the same size (same number of employees).
B) that the annual average bonus is $605.80 more, on average, for unionized companies compared to non-unionized companies of the same size (same number of employees).
C) that the annual average bonus is $1259.50 less, on average, for unionized companies compared to non-unionized companies of the same size (same number of employees).
D) that the annual average bonus is $1259.50 more, on average, for unionized companies compared to non-unionized companies of the same size (same number of employees).
E) that the annual average bonus is $208 more, on average, for unionized companies
Question
Check for collinearity among predictor variables in multiple regression.
A sample of 22 firms was selected from the high tech industry (Industry = 1) and the
Financial services sector (Industry = 0). Data were collected on the following variables:
Turnover rate, job growth, number of employees, and innovative index (higher scores
Indicate a more innovative and creative organizational culture). A multiple regression
Model is developed to predict Turnover Rate. However, to check for the possibility of
Collinearity, a regression among just the predictor variables was run. Based on the results
Shown below, the Variance Inflation Factor (VIF) for the predictor variable Employees is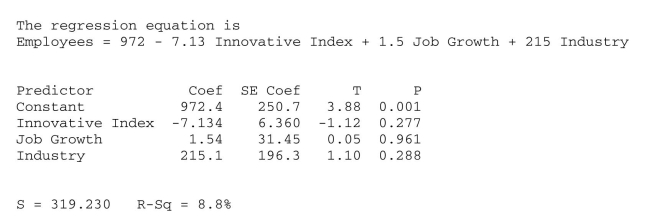
A) 8.33
B) 1.10
C) 319.23
D) 1.00
E) 3.20
Question
Adjust for different slopes using interaction terms in multiple regression.
A sample of 30 companies was randomly selected for a study investigating what
Factors affect the size of company bonuses. Data were collected on the number of
Employees at the company and whether or not the employees were unionized (1 = yes,
0 = no). What does the scatterplot of these data (shown below) suggest?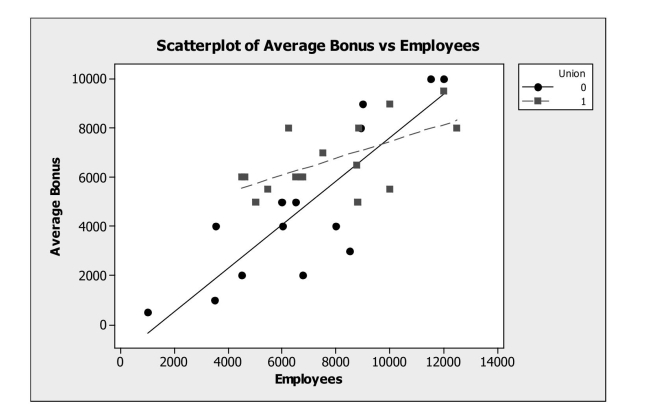
A) Using Union as an indicator variable in this model is appropriate.
B) Using the interaction term Employees*Union in the model is appropriate.
C) Union should not be included in the model as a variable.
D) Employees should not be included in the model as a variable.
E) None of the above.
Question
Interpret output from automatic multiple regression model building procedures.
A sample of 22 firms was selected from the high tech industry (Industry = 1) and the
Financial services sector (Industry = 0). Data were collected on the following variables:
Turnover rate, job growth, number of employees, and innovative index (higher scores
Indicate a more innovative and creative organizational culture). Below are the stepwise
Regression results considering all predictor variables to explain Turnover Rate. The
Resulting multiple regression model is
Stepwise Regression: Turnover Rat versus Innovative I, Job Growth, ...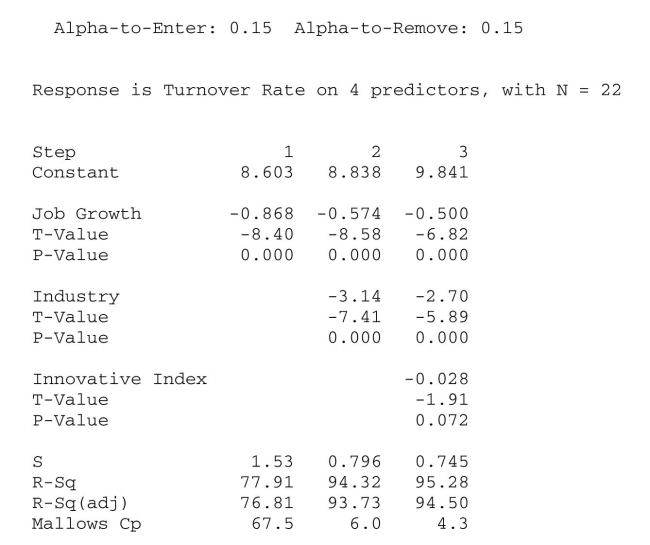
A) Turnover Rate = 9.841 - 6.82 Job Growth - 5.89 Industry - 1.91 Innovative Index
B) Turnover Rate = 8.838 - 0.574 Job Growth - 3.14 Industry
C) Turnover Rate = 9.841 - 0.500 Job Growth - 2.70 Industry - 0.028 Innovative Index
D) Turnover Rate = 8.838 - 8.58 Job Growth - 7.41 Industry
E) None of the above.
Question
Adjust for different slopes using interaction terms in multiple regression.
A sample of 30 companies was randomly selected for a study investigating what
Factors affect the size of company bonuses. Data were collected on the number of
Employees at the company and whether or not the employees were unionized (1 = yes,
0 = no). The following multiple regression model was fit to the data. Based on this
Model, what is the annual average bonus for a company with 7500 employees that are not
Unionized?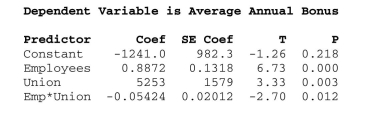
A) $5413
B) $10,259.20
C) $10,666
D) $5253
E) $7980.25
Question
Question
Use indicator (dummy) variables in multiple regression.
A sample of firms was selected from the high tech industry (Industry = 1) and the
Financial services sector (Industry = 0). Data were collected on the following variables:
Turnover rate, job growth, number of employees, and innovative index (higher scores
Indicate a more innovative and creative organizational culture). Below are the multiple
Regression results. The correct interpretation of the coefficient of Industry is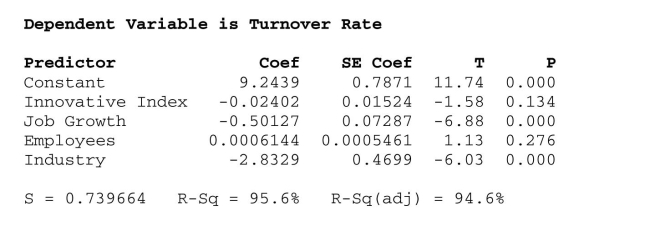
A) The turnover rate will, on average, be 2.83% less for a firm from the high tech industry compared to the financial services sector with the same innovative index score,
Job growth and number of employees.
B) The turnover rate will, on average, be 2.83% less for a firm from the financial services sector compared to the high tech industry with the same innovative index score, job
Growth and number of employees.
C) The turnover rate will, on average, be 2.83% more for a firm from the high tech industry compared to the financial services sector with the same innovative index score,
Job growth and number of employees.
D) The turnover rate will, on average, be 6.03 % less for a firm from the high tech industry compared to the financial services sector with the same innovative index score,
Job growth and number of employees.
E) The turnover rate will, on average, be 0.47% less for a firm from the financial services
Question
Use indicator (dummy) variables in multiple regression.
A sample of firms was selected from the high tech industry (Industry = 1) and the
Financial services sector (Industry = 0). Data were collected on the following variables:
Turnover rate, job growth, number of employees, and innovative index (higher scores
Indicate a more innovative and creative organizational culture). What does the scatterplot
Below suggest about developing a multiple regression model to predict turnover rate?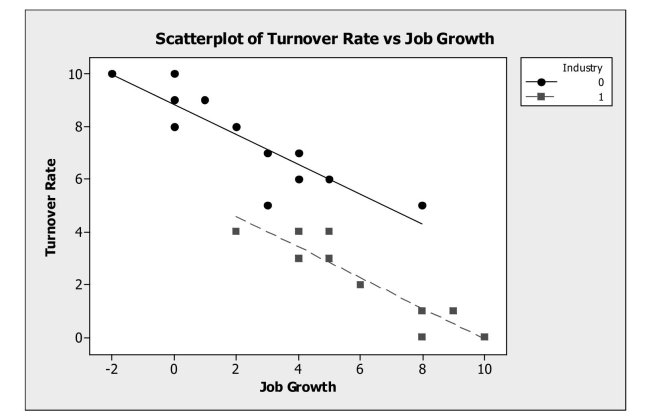
A) Using Job Growth as an indicator variable in this model is appropriate.
B) Using the interaction term Job Growth*Industry in the model is appropriate.
C) Using Industry as an indicator variable in this model is appropriate.
D) Job Growth should not be included in the model as a variable.
E) None of the above.
Question
Use indicator (dummy) variables in multiple regression.
A sample of 22 firms was selected from the high tech industry (Industry = 1) and the
Financial services sector (Industry = 0). Data were collected on a number of variables in
An attempt to develop a model to predict Turnover Rate (%). The final model deemed
Most appropriate includes two predictor variables: Job Growth (%) and Industry. The
Results are shown below. The predicted turnover rate for a firm in the financial services
Sector with a 2% job growth rate is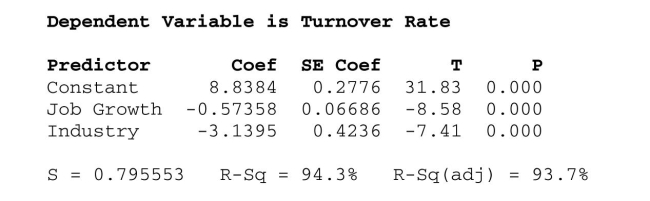
A) 8.25%
B) 7.69%
C) 4.56%
D) 6.19%
E) None of the above.
Question
Check for collinearity among predictor variables in multiple regression.
A sample of 22 firms was selected from the high tech industry (Industry = 1) and the
Financial services sector (Industry = 0). Data were collected on the following variables:
Turnover rate, job growth, number of employees, and innovative index (higher scores
Indicate a more innovative and creative organizational culture). A multiple regression
Model is developed to predict Turnover Rate. However, to check for the possibility of
Collinearity, a regression among just the predictor variables was run. Based on the results
Shown below, the Variance Inflation Factor (VIF) for the predictor variable Innovative
Index is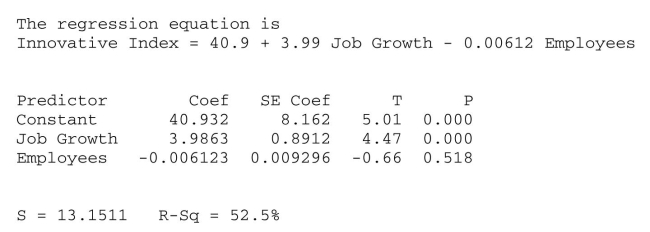
A) 52.5
B) 13.1511
C) 3.63
D) 2.10
E) 1.00
Question
Apply principles of the multiple regression model building process.
A sample of 30 companies was randomly selected for a study investigating what
Factors affect the size of company bonuses. Data were collected on the number of
Employees at the company and whether or not the employees were unionized (1 = yes,
0 = no). Multiple regression output is shown below for two competing models. Which
Of the following statements is true?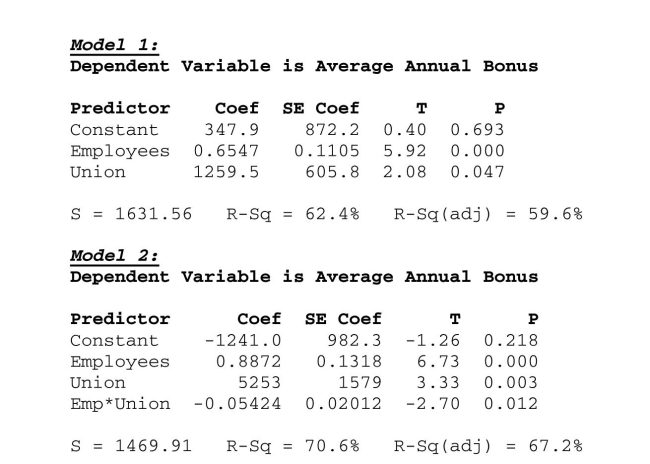
A) Model 2 explains less of the variability in average annual bonus than model 1.
B) The standard deviation of residuals is lower for model 1 compared to model 2.
C) Model 1 includes an interaction term.
D) Model 2 is better than model 1.
E) Model 1 is better than model 2.
Question
Interpret multiple regression output.
A sample of 30 companies was randomly selected for a study investigating what
Factors affect the size of company bonuses. Data were collected on the number of
Employees at the company and whether or not the employees were unionized (1 = yes,
0 = no). The multiple regression output including a plot of residuals versus fitted values
Is shown below. Based on the results shown, which of the following statements is true?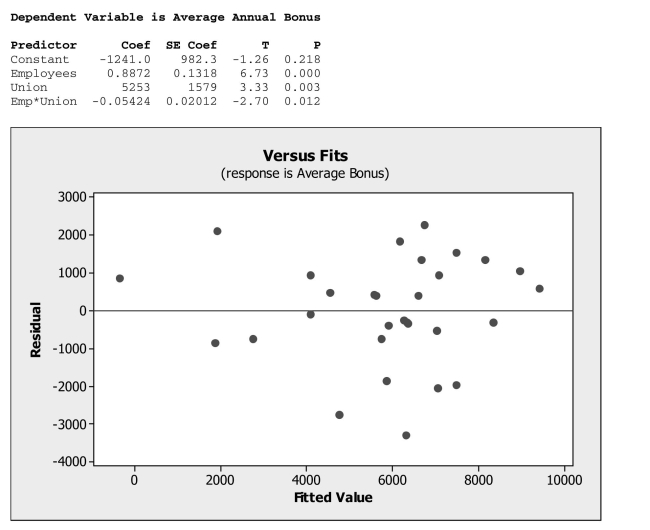
A) The indicator variable in the model is not significant.
B) The interaction term in the model is not significant.
C) The indicator variable in the model is significant.
D) The interaction term should be dropped from the model.
E) None of the above.

Unlock Deck
Sign up to unlock the cards in this deck!
Unlock Deck
Unlock Deck
1/13
Play
Full screen (f)
Deck 19: Data
1
Adjust for different slopes using interaction terms in multiple regression.
A sample of 30 companies was randomly selected for a study investigating what
Factors affect the size of company bonuses. Data were collected on the number of
Employees at the company and whether or not the employees were unionized (1 = yes,
0 = no). The following multiple regression model was fit to the data. Based on this
Model, what is the annual average bonus for a company with 5000 employees that are
Unionized?
A) $3195
B) $8176.80
C) $5253
D) $7980.25
E) $10,259.20
C
2
Use indicator (dummy) variables in multiple regression.
A sample of 30 companies was randomly selected for a study investigating what
Factors affect the size of company bonuses. Data were collected on the number of
Employees at the company and whether or not the employees were unionized (1 = yes,
0 = no). The following multiple regression model was fit to the data. The correct
Interpretation of the regression coefficient of Union is
A) that the annual average bonus is $605.80 less, on average, for unionized companies compared to non-unionized companies of the same size (same number of employees).
B) that the annual average bonus is $605.80 more, on average, for unionized companies compared to non-unionized companies of the same size (same number of employees).
C) that the annual average bonus is $1259.50 less, on average, for unionized companies compared to non-unionized companies of the same size (same number of employees).
D) that the annual average bonus is $1259.50 more, on average, for unionized companies compared to non-unionized companies of the same size (same number of employees).
E) that the annual average bonus is $208 more, on average, for unionized companies
D
3
Check for collinearity among predictor variables in multiple regression.
A sample of 22 firms was selected from the high tech industry (Industry = 1) and the
Financial services sector (Industry = 0). Data were collected on the following variables:
Turnover rate, job growth, number of employees, and innovative index (higher scores
Indicate a more innovative and creative organizational culture). A multiple regression
Model is developed to predict Turnover Rate. However, to check for the possibility of
Collinearity, a regression among just the predictor variables was run. Based on the results
Shown below, the Variance Inflation Factor (VIF) for the predictor variable Employees is
A) 8.33
B) 1.10
C) 319.23
D) 1.00
E) 3.20
B
4
Adjust for different slopes using interaction terms in multiple regression.
A sample of 30 companies was randomly selected for a study investigating what
Factors affect the size of company bonuses. Data were collected on the number of
Employees at the company and whether or not the employees were unionized (1 = yes,
0 = no). What does the scatterplot of these data (shown below) suggest?
A) Using Union as an indicator variable in this model is appropriate.
B) Using the interaction term Employees*Union in the model is appropriate.
C) Union should not be included in the model as a variable.
D) Employees should not be included in the model as a variable.
E) None of the above.
Unlock Deck
Unlock for access to all 13 flashcards in this deck.
Unlock Deck
k this deck
5
Interpret output from automatic multiple regression model building procedures.
A sample of 22 firms was selected from the high tech industry (Industry = 1) and the
Financial services sector (Industry = 0). Data were collected on the following variables:
Turnover rate, job growth, number of employees, and innovative index (higher scores
Indicate a more innovative and creative organizational culture). Below are the stepwise
Regression results considering all predictor variables to explain Turnover Rate. The
Resulting multiple regression model is
Stepwise Regression: Turnover Rat versus Innovative I, Job Growth, ...
A) Turnover Rate = 9.841 - 6.82 Job Growth - 5.89 Industry - 1.91 Innovative Index
B) Turnover Rate = 8.838 - 0.574 Job Growth - 3.14 Industry
C) Turnover Rate = 9.841 - 0.500 Job Growth - 2.70 Industry - 0.028 Innovative Index
D) Turnover Rate = 8.838 - 8.58 Job Growth - 7.41 Industry
E) None of the above.
A sample of 22 firms was selected from the high tech industry (Industry = 1) and the
Financial services sector (Industry = 0). Data were collected on the following variables:
Turnover rate, job growth, number of employees, and innovative index (higher scores
Indicate a more innovative and creative organizational culture). Below are the stepwise
Regression results considering all predictor variables to explain Turnover Rate. The
Resulting multiple regression model is
Stepwise Regression: Turnover Rat versus Innovative I, Job Growth, ...
A) Turnover Rate = 9.841 - 6.82 Job Growth - 5.89 Industry - 1.91 Innovative Index
B) Turnover Rate = 8.838 - 0.574 Job Growth - 3.14 Industry
C) Turnover Rate = 9.841 - 0.500 Job Growth - 2.70 Industry - 0.028 Innovative Index
D) Turnover Rate = 8.838 - 8.58 Job Growth - 7.41 Industry
E) None of the above.
Unlock Deck
Unlock for access to all 13 flashcards in this deck.
Unlock Deck
k this deck
6
Adjust for different slopes using interaction terms in multiple regression.
A sample of 30 companies was randomly selected for a study investigating what
Factors affect the size of company bonuses. Data were collected on the number of
Employees at the company and whether or not the employees were unionized (1 = yes,
0 = no). The following multiple regression model was fit to the data. Based on this
Model, what is the annual average bonus for a company with 7500 employees that are not
Unionized?
A) $5413
B) $10,259.20
C) $10,666
D) $5253
E) $7980.25
Unlock Deck
Unlock for access to all 13 flashcards in this deck.
Unlock Deck
k this deck
7
Apply principles of the multiple regression model building process.
Which of the following statements about building multiple regression models is true?
A) Automatic model building procedures such as "best subsets" and "stepwise" always select the best multiple regression model.
B) When comparing among competing multiple regression models, it is best to use R2 rather than the adjusted R2 for comparison.
C) It is always preferable to include more rather than fewer predictor variables in a multiple regression model in order to ensure the highest possible value of R.2
D) When comparing among competing multiple regression models, the best models will have the highest values for se.
E) None of the above.
Unlock Deck
Unlock for access to all 13 flashcards in this deck.
Unlock Deck
k this deck
8
Use indicator (dummy) variables in multiple regression.
A sample of firms was selected from the high tech industry (Industry = 1) and the
Financial services sector (Industry = 0). Data were collected on the following variables:
Turnover rate, job growth, number of employees, and innovative index (higher scores
Indicate a more innovative and creative organizational culture). Below are the multiple
Regression results. The correct interpretation of the coefficient of Industry is
A) The turnover rate will, on average, be 2.83% less for a firm from the high tech industry compared to the financial services sector with the same innovative index score,
Job growth and number of employees.
B) The turnover rate will, on average, be 2.83% less for a firm from the financial services sector compared to the high tech industry with the same innovative index score, job
Growth and number of employees.
C) The turnover rate will, on average, be 2.83% more for a firm from the high tech industry compared to the financial services sector with the same innovative index score,
Job growth and number of employees.
D) The turnover rate will, on average, be 6.03 % less for a firm from the high tech industry compared to the financial services sector with the same innovative index score,
Job growth and number of employees.
E) The turnover rate will, on average, be 0.47% less for a firm from the financial services
Unlock Deck
Unlock for access to all 13 flashcards in this deck.
Unlock Deck
k this deck
9
Use indicator (dummy) variables in multiple regression.
A sample of firms was selected from the high tech industry (Industry = 1) and the
Financial services sector (Industry = 0). Data were collected on the following variables:
Turnover rate, job growth, number of employees, and innovative index (higher scores
Indicate a more innovative and creative organizational culture). What does the scatterplot
Below suggest about developing a multiple regression model to predict turnover rate?
A) Using Job Growth as an indicator variable in this model is appropriate.
B) Using the interaction term Job Growth*Industry in the model is appropriate.
C) Using Industry as an indicator variable in this model is appropriate.
D) Job Growth should not be included in the model as a variable.
E) None of the above.
Unlock Deck
Unlock for access to all 13 flashcards in this deck.
Unlock Deck
k this deck
10
Use indicator (dummy) variables in multiple regression.
A sample of 22 firms was selected from the high tech industry (Industry = 1) and the
Financial services sector (Industry = 0). Data were collected on a number of variables in
An attempt to develop a model to predict Turnover Rate (%). The final model deemed
Most appropriate includes two predictor variables: Job Growth (%) and Industry. The
Results are shown below. The predicted turnover rate for a firm in the financial services
Sector with a 2% job growth rate is
A) 8.25%
B) 7.69%
C) 4.56%
D) 6.19%
E) None of the above.
Unlock Deck
Unlock for access to all 13 flashcards in this deck.
Unlock Deck
k this deck
11
Check for collinearity among predictor variables in multiple regression.
A sample of 22 firms was selected from the high tech industry (Industry = 1) and the
Financial services sector (Industry = 0). Data were collected on the following variables:
Turnover rate, job growth, number of employees, and innovative index (higher scores
Indicate a more innovative and creative organizational culture). A multiple regression
Model is developed to predict Turnover Rate. However, to check for the possibility of
Collinearity, a regression among just the predictor variables was run. Based on the results
Shown below, the Variance Inflation Factor (VIF) for the predictor variable Innovative
Index is
A) 52.5
B) 13.1511
C) 3.63
D) 2.10
E) 1.00
Unlock Deck
Unlock for access to all 13 flashcards in this deck.
Unlock Deck
k this deck
12
Apply principles of the multiple regression model building process.
A sample of 30 companies was randomly selected for a study investigating what
Factors affect the size of company bonuses. Data were collected on the number of
Employees at the company and whether or not the employees were unionized (1 = yes,
0 = no). Multiple regression output is shown below for two competing models. Which
Of the following statements is true?
A) Model 2 explains less of the variability in average annual bonus than model 1.
B) The standard deviation of residuals is lower for model 1 compared to model 2.
C) Model 1 includes an interaction term.
D) Model 2 is better than model 1.
E) Model 1 is better than model 2.
Unlock Deck
Unlock for access to all 13 flashcards in this deck.
Unlock Deck
k this deck
13
Interpret multiple regression output.
A sample of 30 companies was randomly selected for a study investigating what
Factors affect the size of company bonuses. Data were collected on the number of
Employees at the company and whether or not the employees were unionized (1 = yes,
0 = no). The multiple regression output including a plot of residuals versus fitted values
Is shown below. Based on the results shown, which of the following statements is true?
A) The indicator variable in the model is not significant.
B) The interaction term in the model is not significant.
C) The indicator variable in the model is significant.
D) The interaction term should be dropped from the model.
E) None of the above.
A sample of 30 companies was randomly selected for a study investigating what
Factors affect the size of company bonuses. Data were collected on the number of
Employees at the company and whether or not the employees were unionized (1 = yes,
0 = no). The multiple regression output including a plot of residuals versus fitted values
Is shown below. Based on the results shown, which of the following statements is true?
A) The indicator variable in the model is not significant.
B) The interaction term in the model is not significant.
C) The indicator variable in the model is significant.
D) The interaction term should be dropped from the model.
E) None of the above.
Unlock Deck
Unlock for access to all 13 flashcards in this deck.
Unlock Deck
k this deck
Unlock Deck
Unlock for access to all 13 flashcards in this deck.


