Deck 17: Understanding Residuals
Full screen (f)
Question
Question
Determine when a linear model is appropriate for data.
Based on the following plot of residuals, which assumption and / or condition is not
Satisfied for using a linear regression model?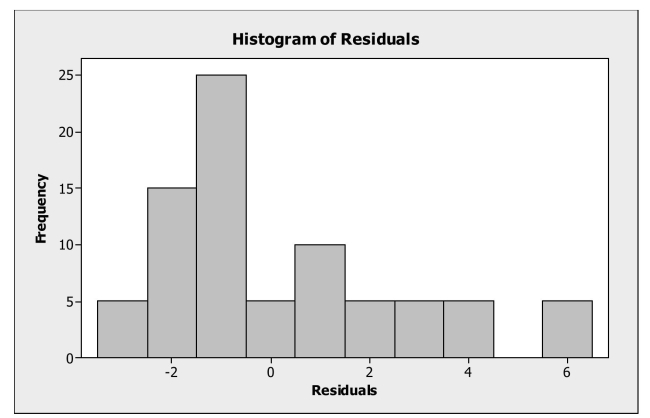
A) Nearly normal condition.
B) Equal spread condition.
C) Linearity condition.
D) Quantitative variables condition.
E) Randomization condition.
Based on the following plot of residuals, which assumption and / or condition is not
Satisfied for using a linear regression model?
A) Nearly normal condition.
B) Equal spread condition.
C) Linearity condition.
D) Quantitative variables condition.
E) Randomization condition.
Question
Question
Determine when a linear model is appropriate for data.
Monthly closing stock prices for a utility company were obtained from January 2007
Through August 2008. A regression model was estimated to describe the trend in closing
Stock prices over time. What does the plot of residuals below suggest?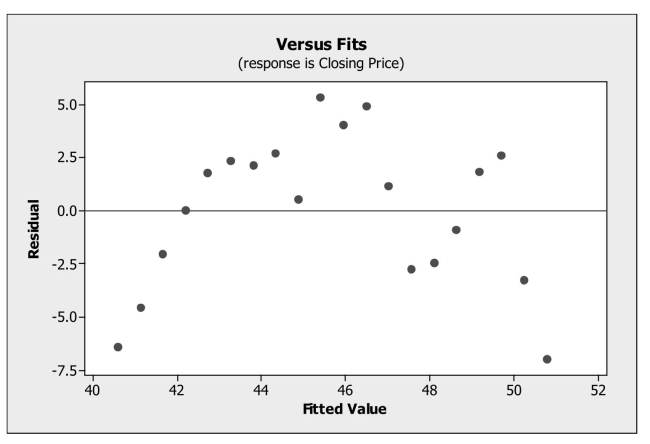
A) An outlier is present in the data set.
B) The linearity condition is not satisfied.
C) A high leverage point is present in the data set.
D) The data are not normal.
E) The equal spread condition is not satisfied.
Question
Determine when a linear model is appropriate for data.
A regression model was developed relating average annual pay to the percentage of
Women employed for a sample of companies. Below is the plot of residuals versus
Predicted values. What does the plot of residuals suggest?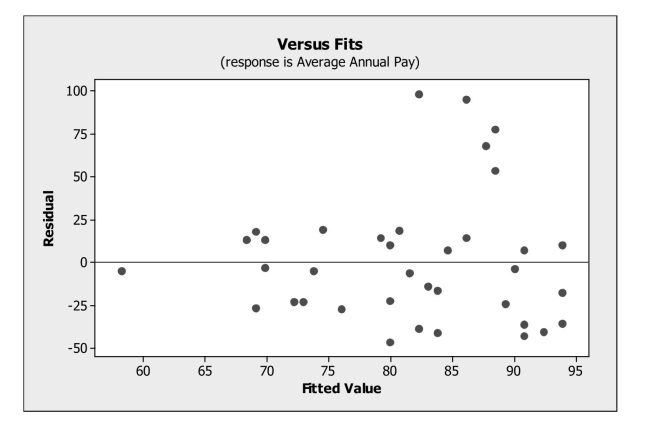
A) An outlier is present in the data set.
B) The linearity condition is not satisfied.
C) A high leverage point is present in the data set.
D) The equal spread condition is not satisfied.
E) The data are not normal.
Question
Examining residuals for groups.
A medical researcher was interested in determining how systolic blood pressure is
Affected by increased exertion during exercise for a sample of cardiac patients. She
Measured the systolic blood pressure of participants in the study as the speed of the
Treadmill on which they were walking was increased. Below is the scatterplot of the data
For smokers and nonsmokers. How is the relationship between systolic blood pressure
And speed of the treadmill affected by whether or not a participant smokes?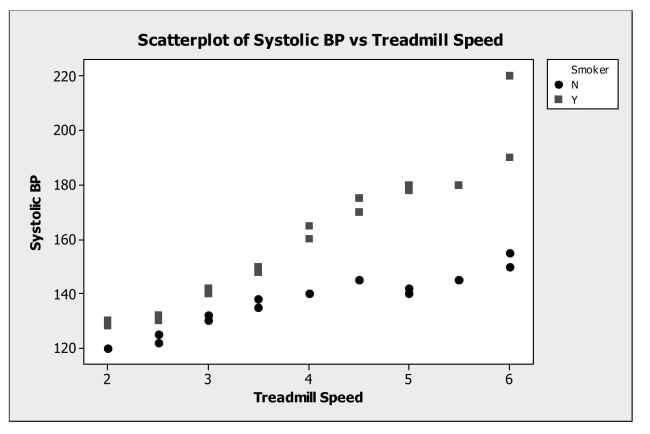
A) Whether or not a participant smokes does not affect the relationship between systolic blood pressure and speed of the treadmill.
B) The regression equation explaining the relationship between systolic blood pressure and speed of the treadmill has a steeper slope for smokers.
C) The systolic blood pressure for nonsmokers is higher than that of smokers.
D) The regression equation explaining the relationship between systolic blood pressure and speed of the treadmill has a steeper slope for nonsmokers.
E) There is a negative linear relationship between smoking and systolic blood pressure.
Question
Examining residuals for groups.
A medical researcher was interested in determining how systolic blood pressure is
Affected by increased exertion during exercise for a sample of cardiac patients. She
Measured the systolic blood pressure of participants in the study as the speed of the
Treadmill on which they were walking was increased. The regression line fit to these data
Was Systolic BP = 97.5 + 12.9 Treadmill Speed, which is significant at = 0.05. The
Α
Residual plot shown below indicates values for smokers and nonsmokers. Which of the
Following statements is true?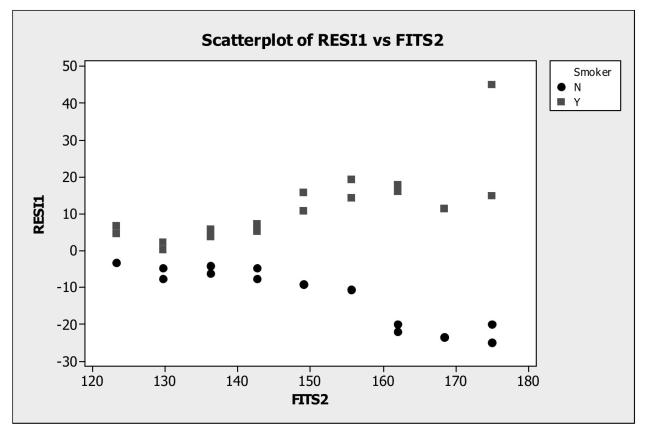
A) Smokers have systolic blood pressures higher than what the model predicts.
B) Nonsmokers have systolic blood pressures lower than what the model predicts.
C) The regression model fit to these data should take into account whether a participant is a smoker or not.
D) All of the above.
E) None of the above.
Question
Perform statistical inference for multiple regression.
The advertising campaign for a high fiber cereal wants to claim that high fiber cereals
are lower in calories. In order to research this claim, they obtain nutritional information
for 77 breakfast cereals including the amount of fiber (in grams) and the number of
calories per serving. The data resulted in the following scatterplot.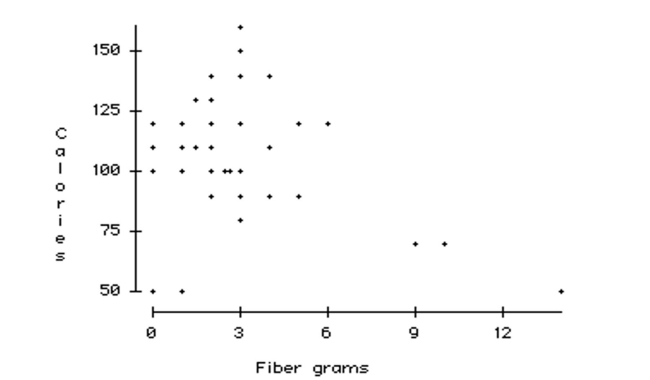
a. Do you think there is a clear pattern? Describe the association between fiber and
calories.
b. Comment on any unusual data point or points in the data set. Explain.
c. Do you think a model could accurately predict the number of calories in a serving of
cereal that has 22 grams of fiber? Explain.
Question
Question
Re-express data to make them appropriate for use with a linear model
A regression model was developed relating average annual pay to the percentage of
Women employed for a sample of companies. Below is the plot of residuals versus
Predicted values. Which of the following re-expression of the data would be appropriate?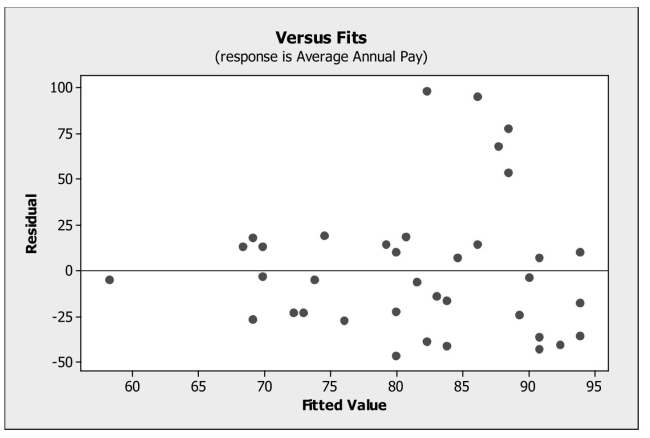
A) Square the data values.
B) Cube the data values.
C) Use a logarithmic transformation.
D) Use a geometric transformation.
E) The data should not be transformed.
Question
Monthly closing stock prices for a utility company were obtained from January 2007
through August 2008. A regression model was estimated to describe the trend in closing
stock prices over time.
a. Based on the plot of residuals versus predicted values, is the linear model
appropriate? Explain.
b. The Durbin-Watson statistic for this regression was found to be 0.5626. What can you
conclude from this statistic?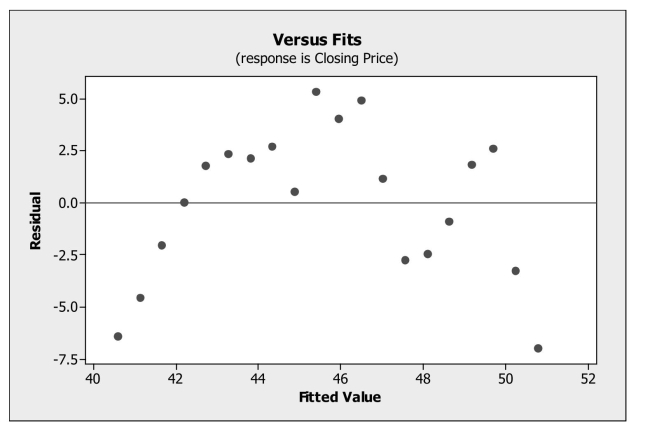
Question
Recognize an extrapolation.
Data on internet usage (per 100 inhabitants) and population were collected for a
Sample of 52 countries (United Nations database). The data resulted in the following
Scatterplot. Suppose the linear model fit to these data is used to determine Internet usage
In India, a country with a population of 1153230948. This would be called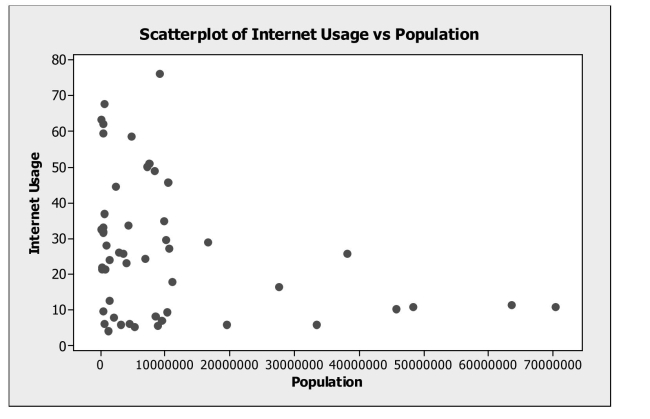
A) an accurate prediction.
B) an extrapolation.
C) a time series prediction.
D) an exaggeration.
E) a residual.
Question
Data on labor productivity and unit labor costs were obtained for the retail industry
from 1987 through 2006 (Bureau of Labor Statistics). A regression was estimated to
describe the linear relationship between the two variables.
a. Based on the plot of residuals versus predicted values, is the linear model
appropriate? Explain.
b. Would a re-expression of the data help? If so, what would you recommend?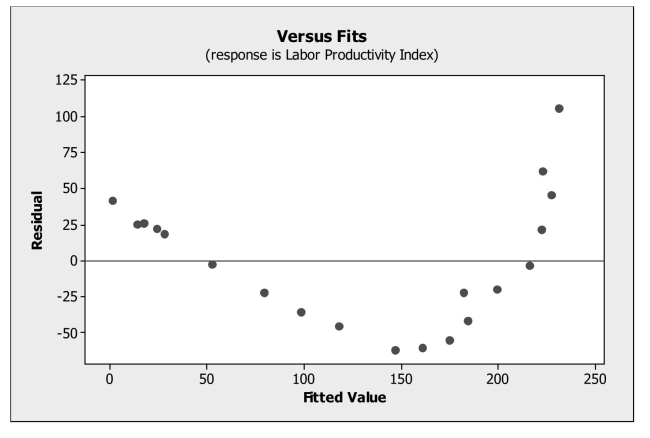
Question
A regression model was developed relating average annual pay to the percentage of
women employed for a sample of companies. Below is the plot of residuals.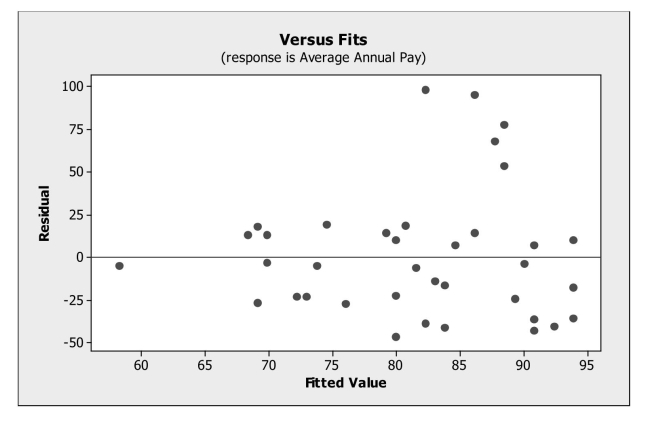
women employed for a sample of companies. Below is the plot of residuals.
Question
Data on internet usage (per 100 inhabitants) and population were collected for a
sample of 52 countries (United Nations database). The data resulted in the following
scatterplot.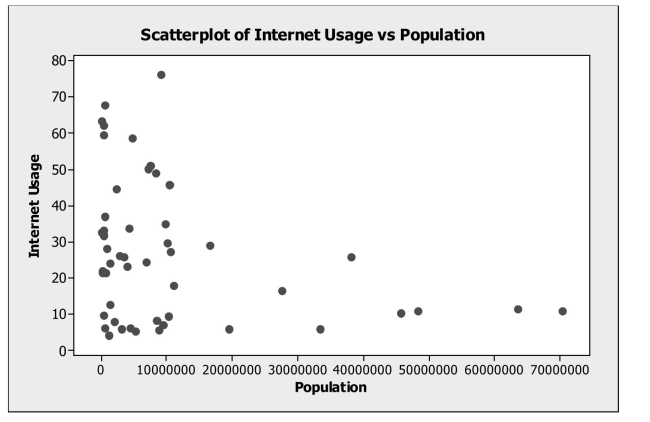
a. Do you think there is a clear pattern? Describe the association between internet usage
and population.
b. Comment on any unusual data point or points in the data set. Explain.
c. Do you think a model could accurately predict the internet usage in India with a
population of 1153230948? Explain
Question
Question
Determine when a linear model is appropriate for data.
A linear regression model was estimated to describe the trend in world population over
Time. Below is the plot of residuals versus predicted values. What does the plot of
Residuals suggest?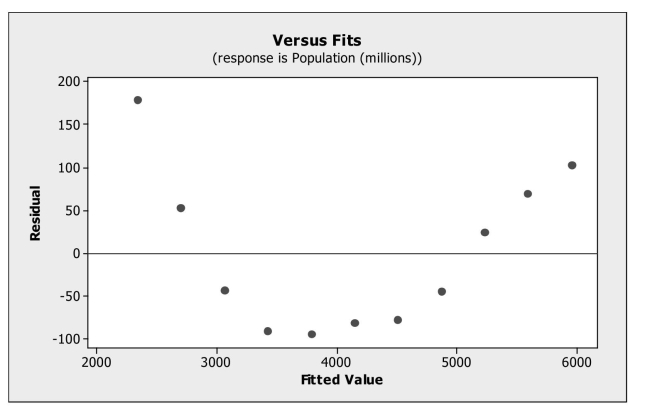
A) An outlier is present in the data set.
B) The linearity condition is not satisfied.
C) A high leverage point is present in the data set.
D) The data are not normal.
E) The equal spread condition is not satisfied.
Question
Question
Re-express data to make them appropriate for use with a linear model
Data on labor productivity and unit labor costs were obtained for the retail industry
From 1987 through 2006 (Bureau of Labor Statistics). A regression was estimated to
Describe the linear relationship between the two variables. Below is the plot of residuals
Versus predicted values. Which of the following re-expression of the data would be
Appropriate?
A) Square the data values.
B) Cube the data values.
C) Use a logarithmic transformation.
D) Use a geometric transformation.
E) The data should not be transformed.
Question
Re-express data to make them appropriate for use with a linear model
A linear regression model was estimated to describe the trend in world population
Over time. Below is the plot of residuals versus predicted values. Which of the following
Re-expression of the data would be appropriate?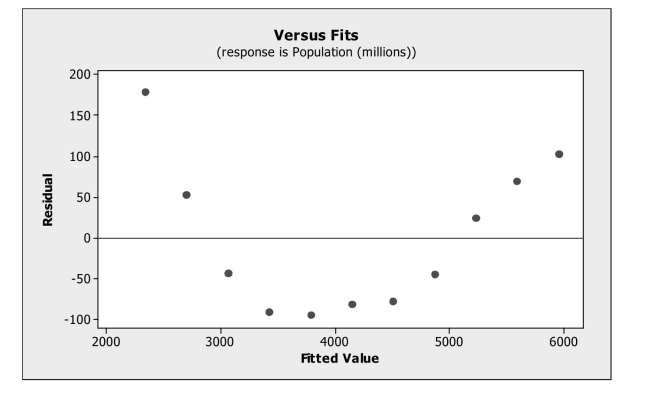
A) Square the data values.
B) Cube the data values.
C) Use a logarithmic transformation.
D) Use a geometric transformation.
E) The data should not be transformed.
Question
Question
Recognize an extrapolation.
The advertising campaign for a high fiber cereal wants to claim that high fiber cereals
Are lower in calories. In order to research this claim, they obtain nutritional information
For 77 breakfast cereals including the amount of fiber (in grams) and the number of
Calories per serving. The data resulted in the following scatterplot.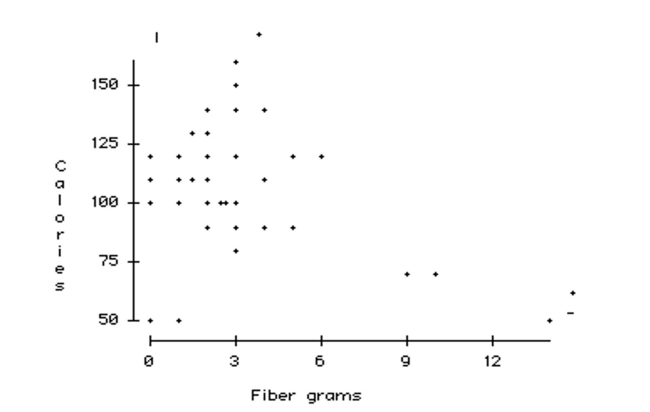
Based on the linear regression equation, predictions are made about the number of
Calories for various amounts of fiber. For which amount of fiber below will the
Prediction be least accurate?
A) 2.75
B) 3.5
C) 4
D) 10
E) 22

Unlock Deck
Sign up to unlock the cards in this deck!
Unlock Deck
Unlock Deck
1/22
Play
Full screen (f)
Deck 17: Understanding Residuals
1
Recognize unusual or extraordinary points.
Suppose a regression model is fit to data and an unusual point is recognized in the
Residual plot. If omitting this point results in a regression model that is very different
From the original, we call this point
A) an outlier.
B) a high leverage point.
C) an influential point.
D) an extrapolated point.
E) all of the above.
C
2
Determine when a linear model is appropriate for data.
Based on the following plot of residuals, which assumption and / or condition is not
Satisfied for using a linear regression model?
A) Nearly normal condition.
B) Equal spread condition.
C) Linearity condition.
D) Quantitative variables condition.
E) Randomization condition.
Based on the following plot of residuals, which assumption and / or condition is not
Satisfied for using a linear regression model?
A) Nearly normal condition.
B) Equal spread condition.
C) Linearity condition.
D) Quantitative variables condition.
E) Randomization condition.
A
3
Quarterly sales figures for e-commerce retail sales were obtained from the first quarter
of 2001 through the fourth quarter of 2007. A regression model was estimated to
describe the trend in e-commerce retail sales over time.
a. Based on the plot of residuals versus predicted values, is the linear model
appropriate? Explain.
b. The Durbin-Watson statistic for this regression was found to be 1.727. What can you
conclude from this statistic?
a.The residual plot shows a curvature and the plot seems to thicken. The spread of
residuals increases as the value of the fitted value increases (over time). The linear model
does not appear to be appropriate.
b.There is no evidence of positive or negative autocorrelation.
residuals increases as the value of the fitted value increases (over time). The linear model
does not appear to be appropriate.
b.There is no evidence of positive or negative autocorrelation.
4
Determine when a linear model is appropriate for data.
Monthly closing stock prices for a utility company were obtained from January 2007
Through August 2008. A regression model was estimated to describe the trend in closing
Stock prices over time. What does the plot of residuals below suggest?
A) An outlier is present in the data set.
B) The linearity condition is not satisfied.
C) A high leverage point is present in the data set.
D) The data are not normal.
E) The equal spread condition is not satisfied.
Unlock Deck
Unlock for access to all 22 flashcards in this deck.
Unlock Deck
k this deck
5
Determine when a linear model is appropriate for data.
A regression model was developed relating average annual pay to the percentage of
Women employed for a sample of companies. Below is the plot of residuals versus
Predicted values. What does the plot of residuals suggest?
A) An outlier is present in the data set.
B) The linearity condition is not satisfied.
C) A high leverage point is present in the data set.
D) The equal spread condition is not satisfied.
E) The data are not normal.
Unlock Deck
Unlock for access to all 22 flashcards in this deck.
Unlock Deck
k this deck
6
Examining residuals for groups.
A medical researcher was interested in determining how systolic blood pressure is
Affected by increased exertion during exercise for a sample of cardiac patients. She
Measured the systolic blood pressure of participants in the study as the speed of the
Treadmill on which they were walking was increased. Below is the scatterplot of the data
For smokers and nonsmokers. How is the relationship between systolic blood pressure
And speed of the treadmill affected by whether or not a participant smokes?
A) Whether or not a participant smokes does not affect the relationship between systolic blood pressure and speed of the treadmill.
B) The regression equation explaining the relationship between systolic blood pressure and speed of the treadmill has a steeper slope for smokers.
C) The systolic blood pressure for nonsmokers is higher than that of smokers.
D) The regression equation explaining the relationship between systolic blood pressure and speed of the treadmill has a steeper slope for nonsmokers.
E) There is a negative linear relationship between smoking and systolic blood pressure.
Unlock Deck
Unlock for access to all 22 flashcards in this deck.
Unlock Deck
k this deck
7
Examining residuals for groups.
A medical researcher was interested in determining how systolic blood pressure is
Affected by increased exertion during exercise for a sample of cardiac patients. She
Measured the systolic blood pressure of participants in the study as the speed of the
Treadmill on which they were walking was increased. The regression line fit to these data
Was Systolic BP = 97.5 + 12.9 Treadmill Speed, which is significant at = 0.05. The
Α
Residual plot shown below indicates values for smokers and nonsmokers. Which of the
Following statements is true?
A) Smokers have systolic blood pressures higher than what the model predicts.
B) Nonsmokers have systolic blood pressures lower than what the model predicts.
C) The regression model fit to these data should take into account whether a participant is a smoker or not.
D) All of the above.
E) None of the above.
Unlock Deck
Unlock for access to all 22 flashcards in this deck.
Unlock Deck
k this deck
8
Perform statistical inference for multiple regression.
The advertising campaign for a high fiber cereal wants to claim that high fiber cereals
are lower in calories. In order to research this claim, they obtain nutritional information
for 77 breakfast cereals including the amount of fiber (in grams) and the number of
calories per serving. The data resulted in the following scatterplot.
a. Do you think there is a clear pattern? Describe the association between fiber and
calories.
b. Comment on any unusual data point or points in the data set. Explain.
c. Do you think a model could accurately predict the number of calories in a serving of
cereal that has 22 grams of fiber? Explain.
The advertising campaign for a high fiber cereal wants to claim that high fiber cereals
are lower in calories. In order to research this claim, they obtain nutritional information
for 77 breakfast cereals including the amount of fiber (in grams) and the number of
calories per serving. The data resulted in the following scatterplot.
a. Do you think there is a clear pattern? Describe the association between fiber and
calories.
b. Comment on any unusual data point or points in the data set. Explain.
c. Do you think a model could accurately predict the number of calories in a serving of
cereal that has 22 grams of fiber? Explain.
Unlock Deck
Unlock for access to all 22 flashcards in this deck.
Unlock Deck
k this deck
9
Recognize the presence of autocorrelation in residuals.
Quarterly figures for e-commerce retail sales were obtained from the first quarter of
2001 through the fourth quarter of 2007. A regression model was estimated to describe
The trend in e-commerce retail sales over time. The Durbin Watson statistic was
Calculated as 1.727. Using = .01 we can conclude that
Α
A) there is evidence of positive autocorrelation.
B) there is evidence of negative autocorrelation.
C) there is no evidence of positive or negative autocorrelation.
D) there is evidence of an outlier.
E) the test is inconclusive.
Unlock Deck
Unlock for access to all 22 flashcards in this deck.
Unlock Deck
k this deck
10
Re-express data to make them appropriate for use with a linear model
A regression model was developed relating average annual pay to the percentage of
Women employed for a sample of companies. Below is the plot of residuals versus
Predicted values. Which of the following re-expression of the data would be appropriate?
A) Square the data values.
B) Cube the data values.
C) Use a logarithmic transformation.
D) Use a geometric transformation.
E) The data should not be transformed.
Unlock Deck
Unlock for access to all 22 flashcards in this deck.
Unlock Deck
k this deck
11
Monthly closing stock prices for a utility company were obtained from January 2007
through August 2008. A regression model was estimated to describe the trend in closing
stock prices over time.
a. Based on the plot of residuals versus predicted values, is the linear model
appropriate? Explain.
b. The Durbin-Watson statistic for this regression was found to be 0.5626. What can you
conclude from this statistic?
Unlock Deck
Unlock for access to all 22 flashcards in this deck.
Unlock Deck
k this deck
12
Recognize an extrapolation.
Data on internet usage (per 100 inhabitants) and population were collected for a
Sample of 52 countries (United Nations database). The data resulted in the following
Scatterplot. Suppose the linear model fit to these data is used to determine Internet usage
In India, a country with a population of 1153230948. This would be called
A) an accurate prediction.
B) an extrapolation.
C) a time series prediction.
D) an exaggeration.
E) a residual.
Unlock Deck
Unlock for access to all 22 flashcards in this deck.
Unlock Deck
k this deck
13
Data on labor productivity and unit labor costs were obtained for the retail industry
from 1987 through 2006 (Bureau of Labor Statistics). A regression was estimated to
describe the linear relationship between the two variables.
a. Based on the plot of residuals versus predicted values, is the linear model
appropriate? Explain.
b. Would a re-expression of the data help? If so, what would you recommend?
Unlock Deck
Unlock for access to all 22 flashcards in this deck.
Unlock Deck
k this deck
14
A regression model was developed relating average annual pay to the percentage of
women employed for a sample of companies. Below is the plot of residuals.
women employed for a sample of companies. Below is the plot of residuals.
Unlock Deck
Unlock for access to all 22 flashcards in this deck.
Unlock Deck
k this deck
15
Data on internet usage (per 100 inhabitants) and population were collected for a
sample of 52 countries (United Nations database). The data resulted in the following
scatterplot.
a. Do you think there is a clear pattern? Describe the association between internet usage
and population.
b. Comment on any unusual data point or points in the data set. Explain.
c. Do you think a model could accurately predict the internet usage in India with a
population of 1153230948? Explain
Unlock Deck
Unlock for access to all 22 flashcards in this deck.
Unlock Deck
k this deck
16
Recognize the presence of autocorrelation in residuals.
Monthly closing stock prices for a utility company were obtained from January 2007
Through August 2008. A regression model was estimated to describe the trend in closing
Stock prices over time. The Durbin Watson statistic was calculated as 0.5626. Using
= )01 we can conclude that
Α
A) there is evidence of positive autocorrelation.
B) there is evidence of negative autocorrelation.
C) there is no evidence of positive or negative autocorrelation.
D) there is evidence of an outlier.
E) the test is inconclusive.
Unlock Deck
Unlock for access to all 22 flashcards in this deck.
Unlock Deck
k this deck
17
Determine when a linear model is appropriate for data.
A linear regression model was estimated to describe the trend in world population over
Time. Below is the plot of residuals versus predicted values. What does the plot of
Residuals suggest?
A) An outlier is present in the data set.
B) The linearity condition is not satisfied.
C) A high leverage point is present in the data set.
D) The data are not normal.
E) The equal spread condition is not satisfied.
Unlock Deck
Unlock for access to all 22 flashcards in this deck.
Unlock Deck
k this deck
18
Understand how working with summary values affects results.
Data were collected for a sample of companies regarding their investment in quality
Improvement efforts and cost savings realized as a result (both measured as a percentage
Of sales revenue). The correlation coefficient for these data is r = .913. If the data were
Collected for individual departments within companies rather than at the company level,
We would expect
A) a stronger correlation.
B) a weaker correlation.
C) the same correlation.
D) fewer outliers in the data.
E) None of the above.
Unlock Deck
Unlock for access to all 22 flashcards in this deck.
Unlock Deck
k this deck
19
Re-express data to make them appropriate for use with a linear model
Data on labor productivity and unit labor costs were obtained for the retail industry
From 1987 through 2006 (Bureau of Labor Statistics). A regression was estimated to
Describe the linear relationship between the two variables. Below is the plot of residuals
Versus predicted values. Which of the following re-expression of the data would be
Appropriate?
A) Square the data values.
B) Cube the data values.
C) Use a logarithmic transformation.
D) Use a geometric transformation.
E) The data should not be transformed.
Unlock Deck
Unlock for access to all 22 flashcards in this deck.
Unlock Deck
k this deck
20
Re-express data to make them appropriate for use with a linear model
A linear regression model was estimated to describe the trend in world population
Over time. Below is the plot of residuals versus predicted values. Which of the following
Re-expression of the data would be appropriate?
A) Square the data values.
B) Cube the data values.
C) Use a logarithmic transformation.
D) Use a geometric transformation.
E) The data should not be transformed.
Unlock Deck
Unlock for access to all 22 flashcards in this deck.
Unlock Deck
k this deck
21
Recognize unusual or extraordinary points.
Which of the following statements is false?
A) Outliers are observations with large residuals.
B) A high leverage point has an x-value that is far from the mean of the x-values.
C) A high leverage point is an influential point.
D) Influential points may be difficult to detect in residual plots.
E) None of the above.
Unlock Deck
Unlock for access to all 22 flashcards in this deck.
Unlock Deck
k this deck
22
Recognize an extrapolation.
The advertising campaign for a high fiber cereal wants to claim that high fiber cereals
Are lower in calories. In order to research this claim, they obtain nutritional information
For 77 breakfast cereals including the amount of fiber (in grams) and the number of
Calories per serving. The data resulted in the following scatterplot.
Based on the linear regression equation, predictions are made about the number of
Calories for various amounts of fiber. For which amount of fiber below will the
Prediction be least accurate?
A) 2.75
B) 3.5
C) 4
D) 10
E) 22
Unlock Deck
Unlock for access to all 22 flashcards in this deck.
Unlock Deck
k this deck
Unlock Deck
Unlock for access to all 22 flashcards in this deck.


