Deck 14: Nonparametric Statistics
Full screen (f)
Question
A real estate agent surmises that the median rent for a one-bedroom apartment in a beach community is at least $1900 per month. The rents for a random sample of 15 one-bedroom apartments are listed below. Test the agent's claim. Use α = .01. 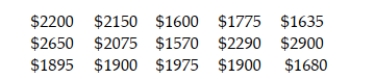
Question
Question
Question
Calculate or use a table to find the binomial probability  . Also use the normal approximation to calculate the probability.
. Also use the normal approximation to calculate the probability. Question
Question
Eight SmartCars were randomly selected and the highway mileage of each was noted. The highway mileage per gallon for each car is shown below: 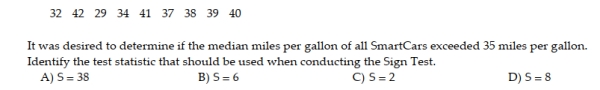
Question
Question
Question
Question
Question
Question
Question
Calculate or use a table to find the binomial probability  .
.
. Question
A convenience store owner believes that the median number of lottery tickets sold per day is 79. A random sample of 20 days yields the data below. Test the owner's claim. Use α = .05. 
Question
The median household income of a community is reported to be $62,000. A random sample of six households in the community yielded the following incomes.  Does the sample provide sufficient evidence to refute the reported median household income? Perform a sign test using α = .10.
Does the sample provide sufficient evidence to refute the reported median household income? Perform a sign test using α = .10. Question
Question
Eight SmartCars were randomly selected and the highway mileage of each was noted. The highway mileage per gallon for each car is shown below: 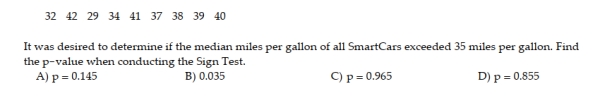
Question
Question
Question
Question
Question
Verbal SAT scores for students randomly selected from two different schools are listed below. Use the Wilcoxon rank sum procedure to test the claim that there is no difference in the scores from each school. Use α = .05. 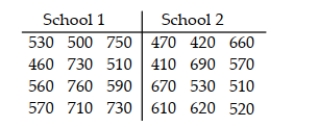
Question
A consumer protection organization claims that a new car model gets less than 29 miles per gallon of gas. Ten cars are tested. The results are given below. Test the organization's claim. Use α = .05. 
Question
Question
A researcher wants to know if the time spent in prison for a particular type of crime is the same for men and women. A random sample of men and women were each asked to give the length of sentence received. The data, in years, are listed below. Use the Wilcoxon rank sum procedure to test the claim that there is no difference in the sentence received by each gender. Use α = .05. 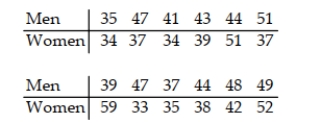
Question
Question
Online classes are becoming more and more prevalent at the college level. A statistics instructor randomly sampled ten students from his traditional face-to-face class and ten students from his online class to compare their comprehension of the material that was taught in the class. He administered the same final exam to each student and wants to use the Wilcoxon Rank Sum test to compare their exam scores. The results are shown below: 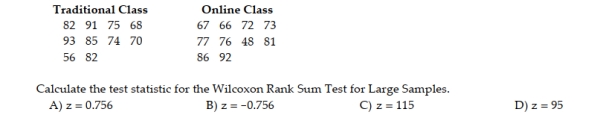
Question
Question
At six different randomly chosen times, a researcher measures the temperature (in degrees Fahrenheit) of a pint of milk from a supermarket's shelf. The measurements are shown below. 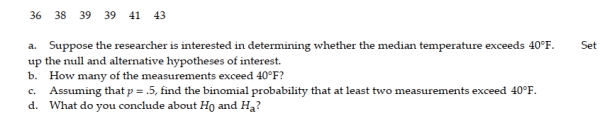
Question
Specify the rejection region for the Wilcoxon rank sum test in the following situation.  H0: Two probability distributions, 1 and 2, are identical Ha: Probability distribution of population 1 is shifted to the right or left of the probability distribution for population 2
H0: Two probability distributions, 1 and 2, are identical Ha: Probability distribution of population 1 is shifted to the right or left of the probability distribution for population 2 Question
Question
Question
Question
Question
Question
Question
Question
Online classes are becoming more and more prevalent at the college level. A statistics instructor randomly sampled ten students from his traditional face-to-face class and ten students from his online class to compare their comprehension of the material that was taught in the class. He administered the same final exam to each student and wants to use the Wilcoxon Rank Sum test to compare their exam scores. The results are shown below: 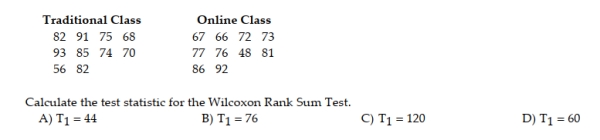
Question
Question
Independent random samples from two populations are shown in the table. 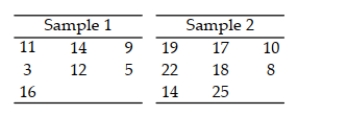 Use the Wilcoxon rank sum test to determine whether the data provide sufficient evidence to indicate a shift in the locations of the probability distributions of the sampled populations. Use α = .05.
Use the Wilcoxon rank sum test to determine whether the data provide sufficient evidence to indicate a shift in the locations of the probability distributions of the sampled populations. Use α = .05. Question
Do popular diets really help customers in the long-run? Many diets help customers lose weight initially only to have the customer add the weight back on after the first few months on the diet. A commercially successful diet company conducted a study of twelve randomly selected customers and measured their weight after before starting the diet and then again after staying with the diet for a year. The company hoped that the initial weight loss would be sustained after the first year on the diet. The data is shown below: 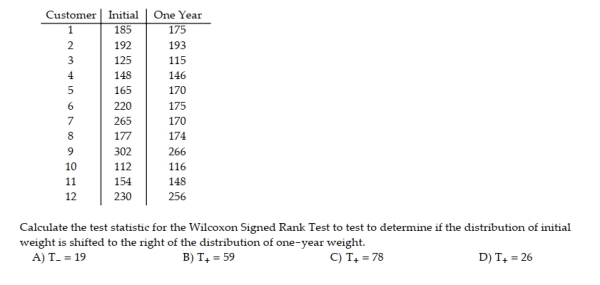
Question
Question
A physician claims that a person's diastolic blood pressure can be lowered, if, instead of taking a drug, the person listens to a relaxation tape each evening. Ten subjects are randomly selected. Their blood pressures, measured in millimeters of mercury, are listed below. The 10 patients are given the tapes and told to listen to them each evening for one month. At the end of the month, their blood pressures are taken again. The data are listed below. Use the Wilcoxon signed rank test to test the physician's claim. Use α = .05. 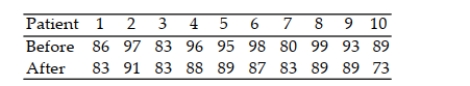
Question
A certain manufacturer is interested in evaluating two alternative manufacturing plans consisting of different machine layouts. Because of union rules, hours of operation vary greatly for this particular manufacturer from one day to the next. Twenty-eight random working days were selected and each plan was monitored and the number of items produced each day was recorded. Some of the collected data is shown below: 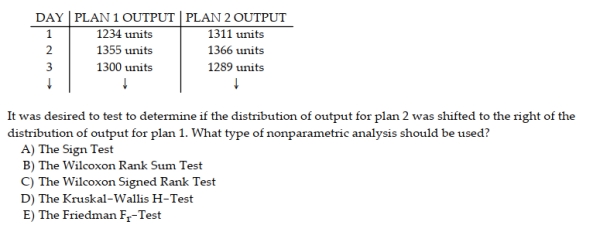
Question
Do popular diets really help customers in the long-run? Many diets help customers lose weight initially only to have the customer add the weight back on after the first few months on the diet. A commercially successful diet company conducted a study of twelve randomly selected customers and measured their weight after before starting the diet and then again after staying with the diet for a year. The company hoped that the initial weight loss would be sustained after the first year on the diet. The data is shown below: 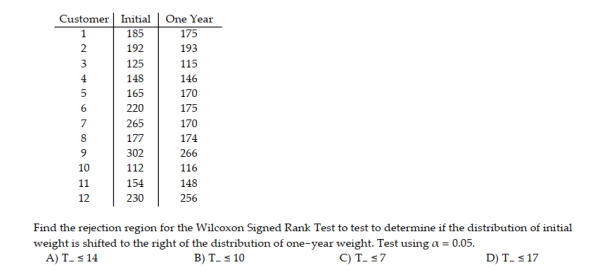
Question
Question
Question
Question
A weight-lifting coach claims that a weight-lifter can increase strength by taking vitamin E. To test the theory, the coach randomly selects 9 athletes and gives them a strength test using a bench press. The results are listed below. Thirty days later, after regular training supplemented by vitamin E, they are tested again. The new results are listed below. Use the Wilcoxon signed rank test to find the critical value to test the claim that the vitamin E supplement is effective in increasing the athletes' strength. Use α = .05. 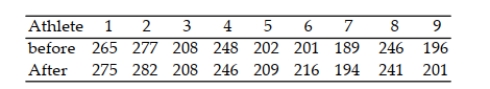
Question
Question
Question
Nine students took the SAT test. Their scores are listed below. Later, they took a test preparation course and retook the SAT. Their new scores are listed below. Use the Wilcoxon signed rank test to test the claim that the test preparation had no effect on their scores. Use α = .05. 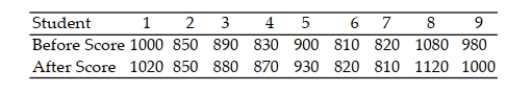
Question
In a study of the effectiveness of physical exercise on weight loss, 20 people were randomly selected to participate in a program for 30 days. Use the Wilcoxon signed rank test to test the claim that exercise has no bearing on weight loss. Use α = .02. 
Question
Question
Question
Question
Question
A pharmaceutical company wishes to test a new drug with the expectation of lowering cholesterol levels. Ten subjects are randomly selected and their cholesterol levels are recorded. The results are listed below. The subjects were placed on the drug for a period of 6 months, after which their cholesterol levels were tested again. The results are listed below. (All units are milligrams per deciliter.) Use the Wilcoxon signed rank test to test the company's claim that the drug lowers cholesterol levels. Use α = .05. 
Question
A local school district is concerned about the number of school days missed by its teachers due to illness. A random sample of 10 teachers is selected. The numbers of days absent in one year is listed below. An incentive program is offered in an attempt to decrease the number of days absent.The number of days absent in one year after the incentive program is listed below. Use the Wilcoxon signed rank test to test the claim that the incentive program cuts down on the number of days missed by teachers. Use α = .05. Days Absent 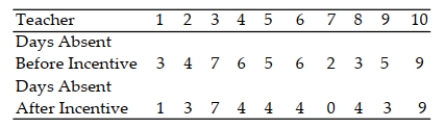
Question
Question
Question
The grade point averages of students participating in sports at a college are to be compared. The data are listed below. Use the Kruskal-Wallis test to test the claim that there is no difference in the distribution of the populations. Use α = .05. 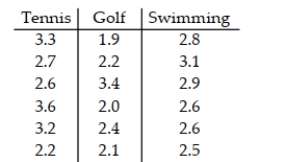
Question
Fading of wood is a problem with wooden decks on boats. Three varnishes used to retard this aging process were tested to see whether there were any differences among them. Samples of 10 different types of wood were treated with each of the three varnishes and the amount of fading was measured after three months of exposure to the sun. The data are listed below. Is there evidence of a difference in the probability distributions of the amounts of fading among the three types of varnish? Use α = .05. 
Question
Question
A researcher wishes to determine whether there is a difference in the average age of elementary school, high school, and community college teachers. Teachers are randomly selected. Their ages are recorded below. Use the Kruskal-Wallis H-test to test the claim that there is no difference in the distribution of the populations. Use α = .05. 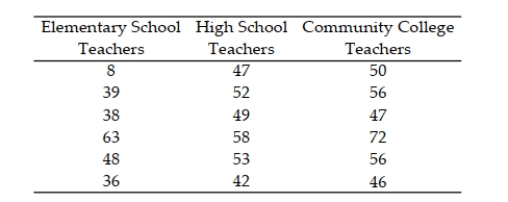
Question
In a study comparing the effects of four energy drinks on running speed, eight runners were timed (in seconds) running four miles. On each day, they were given a single energy drink. The data are listed below. Is there evidence of a difference in the probability distributions of the running times among the four drinks? Use α = .025. 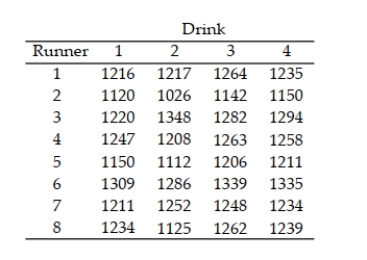
Question
Question
Question
A medical researcher wishes to try three different techniques to lower blood pressure of patients with high blood pressure. The subjects are randomly selected and assigned to one of three groups. Group 1 is given medication, Group 2 is given an exercise program, and Group 3 is assigned a diet program. At the end of six weeks, the reduction in each subject's blood pressure is recorded. Use the Kruskal-Wallis H-test to test the claim that there is no difference in the distribution of the populations. Use α = .05. 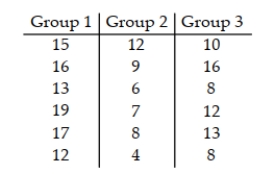
Question
The time (in minutes) it takes to assemble a computer component for three different machines is listed below. Workers are randomly selected. Use the Kruskal-Wallis test to test the claim that there is no difference in the distribution of the populations. Use α = .05. 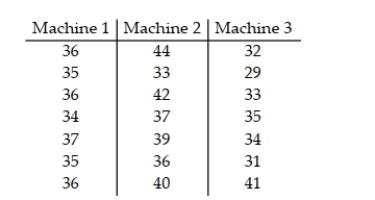
Question
A realtor wishes to compare the square footage of houses in 4 different cities, all of which are priced approximately the same. The data are listed below. Use the Kruskal-Wallis test to test the claim that there is no difference in the distribution of the populations. Use α = .05. 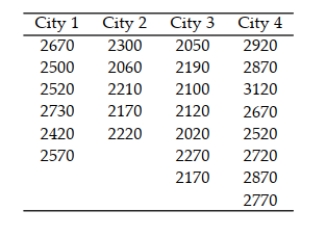 14.6 Comparing Three or More Populations: Randomized Block Design 1 Understand the Friedman
14.6 Comparing Three or More Populations: Randomized Block Design 1 Understand the Friedman Question
A scientist is hoping to compare the levels of DDT toxin found in three species of fish in a local river. He randomly samples 7 of each species to use in the analysis. For each fish, he measures the amount of DDT toxin present. The data is shown below: 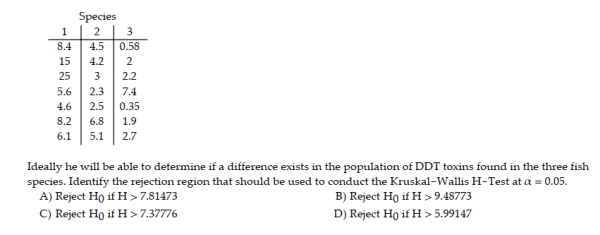
Question
Question
if a difference exists in the population of median distances for each of the four brands of baseball bat. 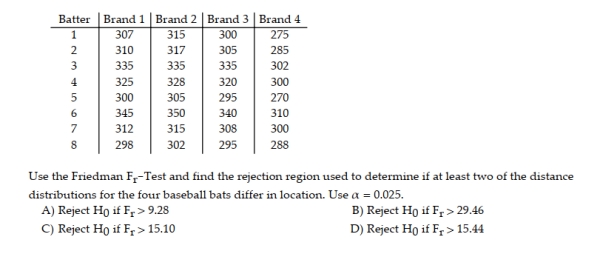 2 Perform Friedman Fr-Test
SHORT ANSWER. Write the word or phrase that best completes each statement or answers the question.
Suppose you have used a randomized block design to compare the efficacy of three different doses of an experimental drug. You used seven patients in your study. The data is listed below. Do the data indicate that a particular dosage is more effective than any other dosage? Use α = .10.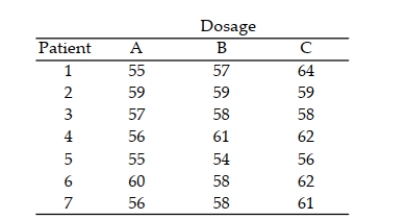
2 Perform Friedman Fr-TestSHORT ANSWER. Write the word or phrase that best completes each statement or answers the question.
Suppose you have used a randomized block design to compare the efficacy of three different doses of an experimental drug. You used seven patients in your study. The data is listed below. Do the data indicate that a particular dosage is more effective than any other dosage? Use α = .10.
Question
Four different types of fertilizers are used on raspberry plants. The number of raspberries on each randomly selected plant is given below. Use the Kruskal-Wallis H-test to test the claim that there is no difference in the distribution of the populations. Use α = .05. 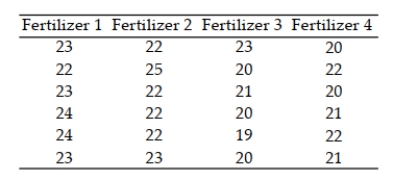
Question
Question
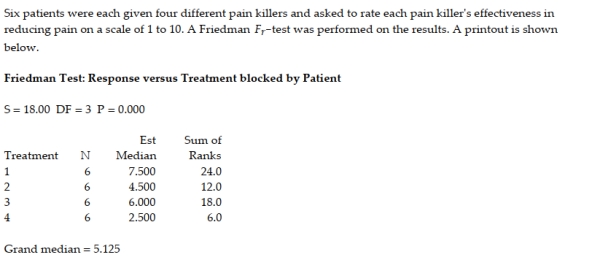 Is there evidence that at least two of the treatment probability distributions differ in location? Explain. 14.7 Rank Correlation 1 Understand Spearman's Rank Correlation Test
 Question
Question
Question

Unlock Deck
Sign up to unlock the cards in this deck!
Unlock Deck
Unlock Deck
1/90
Play
Full screen (f)
Deck 14: Nonparametric Statistics
1
A real estate agent surmises that the median rent for a one-bedroom apartment in a beach community is at least $1900 per month. The rents for a random sample of 15 one-bedroom apartments are listed below. Test the agent's claim. Use α = .01.
critical value 2.33; test statistic z = 0; fail to reject H0; There is not sufficient evidence to reject the claim.
2
Nonparametric tests are useful for qualitative data that can be ranked.
True
3
For a sign test to be valid, a large sample must be selected from a population which is approximately normal.
False
4
Calculate or use a table to find the binomial probability . Also use the normal approximation to calculate the probability.
. Also use the normal approximation to calculate the probability. Unlock Deck
Unlock for access to all 90 flashcards in this deck.
Unlock Deck
k this deck
5
The sign test can not be used when an outlier is present.
Unlock Deck
Unlock for access to all 90 flashcards in this deck.
Unlock Deck
k this deck
6
Eight SmartCars were randomly selected and the highway mileage of each was noted. The highway mileage per gallon for each car is shown below:
Unlock Deck
Unlock for access to all 90 flashcards in this deck.
Unlock Deck
k this deck
7
What is referred to as nonparametrics?
Unlock Deck
Unlock for access to all 90 flashcards in this deck.
Unlock Deck
k this deck
8
Calculate or use a table to find the binomial probability .
A) .035
B) .004
C) .965
D) .996
A) .035
B) .004
C) .965
D) .996
Unlock Deck
Unlock for access to all 90 flashcards in this deck.
Unlock Deck
k this deck
9
If a distribution is approximately normal, the t-test is a more powerful test about the central tendency of the distribution than the sign test.
Unlock Deck
Unlock for access to all 90 flashcards in this deck.
Unlock Deck
k this deck
10
What are distribution-free tests?
Unlock Deck
Unlock for access to all 90 flashcards in this deck.
Unlock Deck
k this deck
11
The sign test provides inferences about the population median rather than the population mean.
Unlock Deck
Unlock for access to all 90 flashcards in this deck.
Unlock Deck
k this deck
12
Nonparametric methods focus on the location of the probability distribution, rather than on specific parameters of the population.
Unlock Deck
Unlock for access to all 90 flashcards in this deck.
Unlock Deck
k this deck
13
Calculate or use a table to find the binomial probability .
. Unlock Deck
Unlock for access to all 90 flashcards in this deck.
Unlock Deck
k this deck
14
A convenience store owner believes that the median number of lottery tickets sold per day is 79. A random sample of 20 days yields the data below. Test the owner's claim. Use α = .05.
Unlock Deck
Unlock for access to all 90 flashcards in this deck.
Unlock Deck
k this deck
15
The median household income of a community is reported to be $62,000. A random sample of six households in the community yielded the following incomes. Does the sample provide sufficient evidence to refute the reported median household income? Perform a sign test using α = .10.
Does the sample provide sufficient evidence to refute the reported median household income? Perform a sign test using α = .10. Unlock Deck
Unlock for access to all 90 flashcards in this deck.
Unlock Deck
k this deck
16
Which of the following is unknown, in general?
A) the probability that a randomly selected observation exceeds the mean of a nonnormal distribution
B) the probability that a randomly selected observation exceeds the median of a nonnormal distribution
C) the probability that a randomly selected observation exceeds the mean of a normal distribution
D) the probability that a randomly selected observation exceeds the median of a normal distribution
Unlock Deck
Unlock for access to all 90 flashcards in this deck.
Unlock Deck
k this deck
17
Eight SmartCars were randomly selected and the highway mileage of each was noted. The highway mileage per gallon for each car is shown below:
Unlock Deck
Unlock for access to all 90 flashcards in this deck.
Unlock Deck
k this deck
18
What are rank statistics (or rank tests)?
Unlock Deck
Unlock for access to all 90 flashcards in this deck.
Unlock Deck
k this deck
19
Fifteen SmartCars were randomly selected and the highway mileage of each was noted. It was desired to determine if the median miles per gallon of all SmartCars exceeded 35 miles per gallon. What type of nonparametric analysis should be used?
A) The Sign Test
B) The Wilcoxon Rank Sum Test
C) The Wilcoxon Signed Rank Test
D) The Kruskal-Wallis H-Test
E)
A) The Sign Test
B) The Wilcoxon Rank Sum Test
C) The Wilcoxon Signed Rank Test
D) The Kruskal-Wallis H-Test
E)
Unlock Deck
Unlock for access to all 90 flashcards in this deck.
Unlock Deck
k this deck
20
The only assumption necessary to ensure the validity of the sign test is that the probability distribution of measurements is continuous.
Unlock Deck
Unlock for access to all 90 flashcards in this deck.
Unlock Deck
k this deck
21
A government agency claims that the median hourly wages for workers at fast food restaurants in the western U.S. is $8.20. In a random sample of 100 workers, 68 were paid less than $8.20, 10 were paid $8.20, and the rest more than $8.20. Test the government's claim. Use α = .05.
Unlock Deck
Unlock for access to all 90 flashcards in this deck.
Unlock Deck
k this deck
22
Verbal SAT scores for students randomly selected from two different schools are listed below. Use the Wilcoxon rank sum procedure to test the claim that there is no difference in the scores from each school. Use α = .05.
Unlock Deck
Unlock for access to all 90 flashcards in this deck.
Unlock Deck
k this deck
23
A consumer protection organization claims that a new car model gets less than 29 miles per gallon of gas. Ten cars are tested. The results are given below. Test the organization's claim. Use α = .05.
Unlock Deck
Unlock for access to all 90 flashcards in this deck.
Unlock Deck
k this deck
24
When performing a rank test comparing two populations, we rank the sample observations from both populations as though they were drawn from the same population.
Unlock Deck
Unlock for access to all 90 flashcards in this deck.
Unlock Deck
k this deck
25
A researcher wants to know if the time spent in prison for a particular type of crime is the same for men and women. A random sample of men and women were each asked to give the length of sentence received. The data, in years, are listed below. Use the Wilcoxon rank sum procedure to test the claim that there is no difference in the sentence received by each gender. Use α = .05.
Unlock Deck
Unlock for access to all 90 flashcards in this deck.
Unlock Deck
k this deck
26
A marketing study was conducted to compare the mean age of male and female purchasers of a certain product. Random and independent samples were selected for both male and female purchasers of the product. It was desired to test to determine if the distribution of ages of all female purchasers was shifted to the right of the distribution of ages of all male purchasers. What type of nonparametric analysis should be used?
A) The Sign Test
B) The Wilcoxon Rank Sum Test
C) The Wilcoxon Signed Rank Test
D) The Kruskal-Wallis H-Test
E)
A) The Sign Test
B) The Wilcoxon Rank Sum Test
C) The Wilcoxon Signed Rank Test
D) The Kruskal-Wallis H-Test
E)
Unlock Deck
Unlock for access to all 90 flashcards in this deck.
Unlock Deck
k this deck
27
Online classes are becoming more and more prevalent at the college level. A statistics instructor randomly sampled ten students from his traditional face-to-face class and ten students from his online class to compare their comprehension of the material that was taught in the class. He administered the same final exam to each student and wants to use the Wilcoxon Rank Sum test to compare their exam scores. The results are shown below:
Unlock Deck
Unlock for access to all 90 flashcards in this deck.
Unlock Deck
k this deck
28
Test the hypothesis that the median age of statistics teachers is 51 years. A random sample of 60 statistics teachers found 25 above 51 years and 35 below 51 years. Use α = .01.
Unlock Deck
Unlock for access to all 90 flashcards in this deck.
Unlock Deck
k this deck
29
At six different randomly chosen times, a researcher measures the temperature (in degrees Fahrenheit) of a pint of milk from a supermarket's shelf. The measurements are shown below.
Unlock Deck
Unlock for access to all 90 flashcards in this deck.
Unlock Deck
k this deck
30
Specify the rejection region for the Wilcoxon rank sum test in the following situation. H0: Two probability distributions, 1 and 2, are identical Ha: Probability distribution of population 1 is shifted to the right or left of the probability distribution for population 2
H0: Two probability distributions, 1 and 2, are identical Ha: Probability distribution of population 1 is shifted to the right or left of the probability distribution for population 2 Unlock Deck
Unlock for access to all 90 flashcards in this deck.
Unlock Deck
k this deck
31
Online classes are becoming more and more prevalent at the college level. A statistics instructor randomly sampled ten students from his traditional face-to-face class and ten students from his online class to compare their comprehension of the material that was taught in the class. He administered the same final exam to each student and wants to use the Wilcoxon Rank Sum test to compare their exam scores. The results are shown below:
What alternative hypothesis should the instructor test to show that the students in the traditional class outperformed the students in the online class?
A) The distribution of exams scores for the traditional class is identical to the distribution of exams scores for the online class.
B) The distribution of exams scores for the traditional class is shifted to the left of the distribution of exams scores for the online class.
C) The distribution of exams scores for the traditional class is shifted to the right of the distribution of exams scores for the online class.
D) The distribution of exams scores for the traditional class is shifted to the right or to the left of the distribution of exams scores for the online class.
Unlock Deck
Unlock for access to all 90 flashcards in this deck.
Unlock Deck
k this deck
32
The results of independent random samples from two populations are shown below. Sample A: 11, 15, 18, 21 Sample B: 9, 12, 15, 17, 20, 23 Calculate the rank sum for each sample. Which would be used as the test statistic in a Wilcoxon rank sum test?
Unlock Deck
Unlock for access to all 90 flashcards in this deck.
Unlock Deck
k this deck
33
The results of independent random samples from two populations are shown below. Sample A: 35, 38, 42, 43, 45, 47, 49, 58 Sample B: 36, 41, 44, 53, 57 Calculate the rank sum for each sample. Which would be used as the test statistic in a Wilcoxon rank sum test?
Unlock Deck
Unlock for access to all 90 flashcards in this deck.
Unlock Deck
k this deck
34
The Wilcoxon rank sum test is recommended for comparing discrete distributions.
Unlock Deck
Unlock for access to all 90 flashcards in this deck.
Unlock Deck
k this deck
35
Specify the rejection region for the Wilcoxon rank sum test in the following situation. n1 = 7, n2 = 5, α = .05 H0: Two probability distributions, 1 and 2, are identical Ha: Probability distribution of population 1 is shifted to the right of the probability distribution for population 2
Unlock Deck
Unlock for access to all 90 flashcards in this deck.
Unlock Deck
k this deck
36
For the Wilcoxon rank sum test to be valid, the number of ties in the measurements needs to be small relative to the sample sizes.
Unlock Deck
Unlock for access to all 90 flashcards in this deck.
Unlock Deck
k this deck
37
The Wilcoxon rank sum test is used to test the hypothesis that the probability distributions associated with two populations are equivalent.
Unlock Deck
Unlock for access to all 90 flashcards in this deck.
Unlock Deck
k this deck
38
Online classes are becoming more and more prevalent at the college level. A statistics instructor randomly sampled ten students from his traditional face-to-face class and ten students from his online class to compare their comprehension of the material that was taught in the class. He administered the same final exam to each student and wants to use the Wilcoxon Rank Sum test to compare their exam scores. The results are shown below:
Unlock Deck
Unlock for access to all 90 flashcards in this deck.
Unlock Deck
k this deck
39
Suppose you want to compare two treatments, A and B. In particular, you wish to determine whether the distribution for population B is shifted to the right of the distribution for population A. You plan to use the Wilcoxon rank sum test. a. Specify the null and alternative hypotheses you would test. b. Suppose you obtained the following independent random samples of observations on experimental units subjected to the two treatments. Conduct the test of hypotheses described above, using α = .05. Sample A: 1.2, 1.5, 2.3, 3.2, 3.7, 4.1 Sample B: 2.5, 2.8, 3.6, 4.2, 4.5
Unlock Deck
Unlock for access to all 90 flashcards in this deck.
Unlock Deck
k this deck
40
Independent random samples from two populations are shown in the table. Use the Wilcoxon rank sum test to determine whether the data provide sufficient evidence to indicate a shift in the locations of the probability distributions of the sampled populations. Use α = .05.
Use the Wilcoxon rank sum test to determine whether the data provide sufficient evidence to indicate a shift in the locations of the probability distributions of the sampled populations. Use α = .05. Unlock Deck
Unlock for access to all 90 flashcards in this deck.
Unlock Deck
k this deck
41
Do popular diets really help customers in the long-run? Many diets help customers lose weight initially only to have the customer add the weight back on after the first few months on the diet. A commercially successful diet company conducted a study of twelve randomly selected customers and measured their weight after before starting the diet and then again after staying with the diet for a year. The company hoped that the initial weight loss would be sustained after the first year on the diet. The data is shown below:
Unlock Deck
Unlock for access to all 90 flashcards in this deck.
Unlock Deck
k this deck
42
The Kruskal-Wallis test is valid only when each sample contains five or fewer measurements.
Unlock Deck
Unlock for access to all 90 flashcards in this deck.
Unlock Deck
k this deck
43
A physician claims that a person's diastolic blood pressure can be lowered, if, instead of taking a drug, the person listens to a relaxation tape each evening. Ten subjects are randomly selected. Their blood pressures, measured in millimeters of mercury, are listed below. The 10 patients are given the tapes and told to listen to them each evening for one month. At the end of the month, their blood pressures are taken again. The data are listed below. Use the Wilcoxon signed rank test to test the physician's claim. Use α = .05.
Unlock Deck
Unlock for access to all 90 flashcards in this deck.
Unlock Deck
k this deck
44
A certain manufacturer is interested in evaluating two alternative manufacturing plans consisting of different machine layouts. Because of union rules, hours of operation vary greatly for this particular manufacturer from one day to the next. Twenty-eight random working days were selected and each plan was monitored and the number of items produced each day was recorded. Some of the collected data is shown below:
Unlock Deck
Unlock for access to all 90 flashcards in this deck.
Unlock Deck
k this deck
45
Do popular diets really help customers in the long-run? Many diets help customers lose weight initially only to have the customer add the weight back on after the first few months on the diet. A commercially successful diet company conducted a study of twelve randomly selected customers and measured their weight after before starting the diet and then again after staying with the diet for a year. The company hoped that the initial weight loss would be sustained after the first year on the diet. The data is shown below:
Unlock Deck
Unlock for access to all 90 flashcards in this deck.
Unlock Deck
k this deck
46
Do popular diets really help customers in the long-run? Many diets help customers lose weight initially only to have the customer add the weight back on after the first few months on the diet. A commercially successful diet company conducted a study of twelve randomly selected customers and measured their weight after before starting the diet and then again after staying with the diet for a year. The company hoped that the initial weight loss would be sustained after the first year on the diet. The data is shown below: What alternative hypothesis should be tested in order to determine if the diet is successful at helping customers lose and keep weight off after one year?
A) The distribution of initial weight is identical to the distribution of one-year weight.
B) The distribution of initial weight is shifted to the right of the distribution of one-year weight.
C) The distribution of initial weight is shifted to the left of the distribution of one-year weight.
D) The distribution of initial weight is shifted to the right or to the left of the distribution of one-year weight.
Unlock Deck
Unlock for access to all 90 flashcards in this deck.
Unlock Deck
k this deck
47
When performing a signed rank test in a paired difference experiment, tied absolute value differences are assigned the average of the ranks they would receive if they were unequal, but successive measurements.
Unlock Deck
Unlock for access to all 90 flashcards in this deck.
Unlock Deck
k this deck
48
For a valid signed rank test, the probability distribution from which the sample of paired differences is drawn must be continuous.
Unlock Deck
Unlock for access to all 90 flashcards in this deck.
Unlock Deck
k this deck
49
A weight-lifting coach claims that a weight-lifter can increase strength by taking vitamin E. To test the theory, the coach randomly selects 9 athletes and gives them a strength test using a bench press. The results are listed below. Thirty days later, after regular training supplemented by vitamin E, they are tested again. The new results are listed below. Use the Wilcoxon signed rank test to find the critical value to test the claim that the vitamin E supplement is effective in increasing the athletes' strength. Use α = .05.
Unlock Deck
Unlock for access to all 90 flashcards in this deck.
Unlock Deck
k this deck
50
A scientist is hoping to compare the levels of DDT toxin found in three species of fish in a local river. He randomly samples 7 of each species to use in the analysis. For each fish, he measures the amount of DDT toxin present. The data is shown below: Ideally he will be able to determine if a difference exists in the population of DDT toxins found in the three fish species. Identify the test statistic for the Kruskal-Wallis H-Test.
A) H = 17.0
B) H = 10.286
C) H = 11.718
D) H = 5.714
A) H = 17.0
B) H = 10.286
C) H = 11.718
D) H = 5.714
Unlock Deck
Unlock for access to all 90 flashcards in this deck.
Unlock Deck
k this deck
51
For a valid Kruskal-Wallis test, the probability distribution from which the samples are drawn must be continuous.
Unlock Deck
Unlock for access to all 90 flashcards in this deck.
Unlock Deck
k this deck
52
Nine students took the SAT test. Their scores are listed below. Later, they took a test preparation course and retook the SAT. Their new scores are listed below. Use the Wilcoxon signed rank test to test the claim that the test preparation had no effect on their scores. Use α = .05.
Unlock Deck
Unlock for access to all 90 flashcards in this deck.
Unlock Deck
k this deck
53
In a study of the effectiveness of physical exercise on weight loss, 20 people were randomly selected to participate in a program for 30 days. Use the Wilcoxon signed rank test to test the claim that exercise has no bearing on weight loss. Use α = .02.
Unlock Deck
Unlock for access to all 90 flashcards in this deck.
Unlock Deck
k this deck
54
When applying the Wilcoxon signed rank test, the number of ties should be small relative to the number of observations to ensure the validity of the test.
Unlock Deck
Unlock for access to all 90 flashcards in this deck.
Unlock Deck
k this deck
55
A scientist is hoping to compare the levels of DDT toxin found in three species of fish in a local river. He randomly samples 50 of each species to use in the analysis. For each fish, he measures the amount of DDT toxin present. Ideally he will be able to determine if a difference exists in the population of DDT toxins found in the three fish species. What type of nonparametric analysis should be used?
A) The Sign Test
B) The Wilcoxon Rank Sum Test
C) The Wilcoxon Signed Rank Test
D) The Kruskal-Wallis H-Test
E)
A) The Sign Test
B) The Wilcoxon Rank Sum Test
C) The Wilcoxon Signed Rank Test
D) The Kruskal-Wallis H-Test
E)
Unlock Deck
Unlock for access to all 90 flashcards in this deck.
Unlock Deck
k this deck
56
Specify the rejection region for the Wilcoxon signed rank test in the following situation. n = 25, α = .05 H0: Two probability distributions, 1 and 2, are identical Ha: Probability distribution of population 1 is shifted to the right of the probability distribution for population 2
Unlock Deck
Unlock for access to all 90 flashcards in this deck.
Unlock Deck
k this deck
57
Specify the rejection region for the Wilcoxon signed rank test in the following situation. n = 35, α = .10 H0: Two probability distributions, 1 and 2, are identical Ha: Probability distribution of population 1 is shifted to the right or left of the probability distribution for population 2
Unlock Deck
Unlock for access to all 90 flashcards in this deck.
Unlock Deck
k this deck
58
A pharmaceutical company wishes to test a new drug with the expectation of lowering cholesterol levels. Ten subjects are randomly selected and their cholesterol levels are recorded. The results are listed below. The subjects were placed on the drug for a period of 6 months, after which their cholesterol levels were tested again. The results are listed below. (All units are milligrams per deciliter.) Use the Wilcoxon signed rank test to test the company's claim that the drug lowers cholesterol levels. Use α = .05.
Unlock Deck
Unlock for access to all 90 flashcards in this deck.
Unlock Deck
k this deck
59
A local school district is concerned about the number of school days missed by its teachers due to illness. A random sample of 10 teachers is selected. The numbers of days absent in one year is listed below. An incentive program is offered in an attempt to decrease the number of days absent.The number of days absent in one year after the incentive program is listed below. Use the Wilcoxon signed rank test to test the claim that the incentive program cuts down on the number of days missed by teachers. Use α = .05. Days Absent
Unlock Deck
Unlock for access to all 90 flashcards in this deck.
Unlock Deck
k this deck
60
The Wilcoxon signed rank test for large samples can be used when .
Unlock Deck
Unlock for access to all 90 flashcards in this deck.
Unlock Deck
k this deck
61
A scientist is hoping to compare the levels of DDT toxin found in three species of fish in a local river. He randomly samples 7 of each species to use in the analysis. For each fish, he measures the amount of DDT toxin present. The data is shown below:
Ideally he will be able to determine if a difference exists in the population of DDT toxins found in the three fish species. The test statistic was determined to be H = 11.718. State the appropriate conclusion when testing at ? = 0.025.
A) There is sufficient evidence to indicate that the distributions of DDT toxins for the three species are identical.
B) There is insufficient evidence to indicate that the distributions of DDT toxins for the three species are identical.
C) There is sufficient evidence to indicate that the distributions of DDT toxins for the three species differ in location.
D) There is insufficient evidence to indicate that the distributions of DDT toxins for the three species differ in location.
Unlock Deck
Unlock for access to all 90 flashcards in this deck.
Unlock Deck
k this deck
62
The grade point averages of students participating in sports at a college are to be compared. The data are listed below. Use the Kruskal-Wallis test to test the claim that there is no difference in the distribution of the populations. Use α = .05.
Unlock Deck
Unlock for access to all 90 flashcards in this deck.
Unlock Deck
k this deck
63
Fading of wood is a problem with wooden decks on boats. Three varnishes used to retard this aging process were tested to see whether there were any differences among them. Samples of 10 different types of wood were treated with each of the three varnishes and the amount of fading was measured after three months of exposure to the sun. The data are listed below. Is there evidence of a difference in the probability distributions of the amounts of fading among the three types of varnish? Use α = .05.
Unlock Deck
Unlock for access to all 90 flashcards in this deck.
Unlock Deck
k this deck
64
A) 0.005
B) 0.01
C) 0.995
D) 0.05
Unlock Deck
Unlock for access to all 90 flashcards in this deck.
Unlock Deck
k this deck
65
A researcher wishes to determine whether there is a difference in the average age of elementary school, high school, and community college teachers. Teachers are randomly selected. Their ages are recorded below. Use the Kruskal-Wallis H-test to test the claim that there is no difference in the distribution of the populations. Use α = .05.
Unlock Deck
Unlock for access to all 90 flashcards in this deck.
Unlock Deck
k this deck
66
In a study comparing the effects of four energy drinks on running speed, eight runners were timed (in seconds) running four miles. On each day, they were given a single energy drink. The data are listed below. Is there evidence of a difference in the probability distributions of the running times among the four drinks? Use α = .025.
Unlock Deck
Unlock for access to all 90 flashcards in this deck.
Unlock Deck
k this deck
67
Four brands of baseball bats were tested to determine which bat allowed hitters to hit a baseball farthest. Eight different batters were thrown 25 pitches while hitting with each of the four bats (assigned in random order). The median distance of the five longest hits using each bat is shown in the table below. The goal is to determine if a difference exists in the population of median distances for each of the four brands of baseball bat
What type of nonparametric analysis should be used?
A) The Sign Test
B) The Wilcoxon Rank Sum Test
C) The Wilcoxon Signed Rank Test
D) The Kruskal-Wallis H-Test
E) The Friedman Fr-Test
What type of nonparametric analysis should be used?
A) The Sign Test
B) The Wilcoxon Rank Sum Test
C) The Wilcoxon Signed Rank Test
D) The Kruskal-Wallis H-Test
E) The Friedman Fr-Test
Unlock Deck
Unlock for access to all 90 flashcards in this deck.
Unlock Deck
k this deck
68
When there is a perfect negative rank correlation between two variables, the value of the test statistic rs in Spearman's test is -1.
Unlock Deck
Unlock for access to all 90 flashcards in this deck.
Unlock Deck
k this deck
69
A medical researcher wishes to try three different techniques to lower blood pressure of patients with high blood pressure. The subjects are randomly selected and assigned to one of three groups. Group 1 is given medication, Group 2 is given an exercise program, and Group 3 is assigned a diet program. At the end of six weeks, the reduction in each subject's blood pressure is recorded. Use the Kruskal-Wallis H-test to test the claim that there is no difference in the distribution of the populations. Use α = .05.
Unlock Deck
Unlock for access to all 90 flashcards in this deck.
Unlock Deck
k this deck
70
The time (in minutes) it takes to assemble a computer component for three different machines is listed below. Workers are randomly selected. Use the Kruskal-Wallis test to test the claim that there is no difference in the distribution of the populations. Use α = .05.
Unlock Deck
Unlock for access to all 90 flashcards in this deck.
Unlock Deck
k this deck
71
A realtor wishes to compare the square footage of houses in 4 different cities, all of which are priced approximately the same. The data are listed below. Use the Kruskal-Wallis test to test the claim that there is no difference in the distribution of the populations. Use α = .05. 14.6 Comparing Three or More Populations: Randomized Block Design 1 Understand the Friedman
14.6 Comparing Three or More Populations: Randomized Block Design 1 Understand the Friedman Unlock Deck
Unlock for access to all 90 flashcards in this deck.
Unlock Deck
k this deck
72
A scientist is hoping to compare the levels of DDT toxin found in three species of fish in a local river. He randomly samples 7 of each species to use in the analysis. For each fish, he measures the amount of DDT toxin present. The data is shown below:
Unlock Deck
Unlock for access to all 90 flashcards in this deck.
Unlock Deck
k this deck
73
For a valid Spearman's test, the probability distribution for just one of the two variables must be continuous.
Unlock Deck
Unlock for access to all 90 flashcards in this deck.
Unlock Deck
k this deck
74
if a difference exists in the population of median distances for each of the four brands of baseball bat. 2 Perform Friedman Fr-Test
SHORT ANSWER. Write the word or phrase that best completes each statement or answers the question.
Suppose you have used a randomized block design to compare the efficacy of three different doses of an experimental drug. You used seven patients in your study. The data is listed below. Do the data indicate that a particular dosage is more effective than any other dosage? Use α = .10.
2 Perform Friedman Fr-TestSHORT ANSWER. Write the word or phrase that best completes each statement or answers the question.
Suppose you have used a randomized block design to compare the efficacy of three different doses of an experimental drug. You used seven patients in your study. The data is listed below. Do the data indicate that a particular dosage is more effective than any other dosage? Use α = .10.
Unlock Deck
Unlock for access to all 90 flashcards in this deck.
Unlock Deck
k this deck
75
Four different types of fertilizers are used on raspberry plants. The number of raspberries on each randomly selected plant is given below. Use the Kruskal-Wallis H-test to test the claim that there is no difference in the distribution of the populations. Use α = .05.
Unlock Deck
Unlock for access to all 90 flashcards in this deck.
Unlock Deck
k this deck
76
The advantage of the Friedman is that the measurements within each block do not need to be ranked.
Unlock Deck
Unlock for access to all 90 flashcards in this deck.
Unlock Deck
k this deck
77
Is there evidence that at least two of the treatment probability distributions differ in location? Explain. 14.7 Rank Correlation 1 Understand Spearman's Rank Correlation Test Unlock Deck
Unlock for access to all 90 flashcards in this deck.
Unlock Deck
k this deck
78
Four brands of baseball bats were tested to determine which bat allowed hitters to hit a baseball farthest. Eight different batters were thrown 25 pitches while hitting with each of the four bats (assigned in random order). The median distance of the five longest hits using each bat is shown in the table below. The goal is to determine if a difference exists in the population of median distances for each of the four brands of baseball bat.
Use the Friedman Fr-Test and find the rejection region used to determine if at least two of the distance
distributions for the four baseball bats differ in location. Use ? = 0.025.
A) Reject H0 if Fr > 9.28
B) Reject H0 if Fr > 29.46
C) Reject H0 if Fr > 15.10
D) Reject H0 if Fr > 15.44
Use the Friedman Fr-Test and find the rejection region used to determine if at least two of the distance
distributions for the four baseball bats differ in location. Use ? = 0.025.
A) Reject H0 if Fr > 9.28
B) Reject H0 if Fr > 29.46
C) Reject H0 if Fr > 15.10
D) Reject H0 if Fr > 15.44
Unlock Deck
Unlock for access to all 90 flashcards in this deck.
Unlock Deck
k this deck
79
Four brands of baseball bats were tested to determine which bat allowed hitters to hit a baseball farthest. Eight different batters were thrown 25 pitches while hitting with each of the four bats (assigned in random order). The median distance of the five longest hits using each bat is shown in the table below. The goal is to determine if a difference exists in the population of median distances for each of the four brands of baseball bat
Use the Friedman Fr-Test to calculate the test statistic used to determine if at least two of the distance
distributions for the four baseball bats differ in location.
A) Fr = 3.125
B) Fr = 4.781
C) Fr = 22.950
D) Fr = 25.828
Use the Friedman Fr-Test to calculate the test statistic used to determine if at least two of the distance
distributions for the four baseball bats differ in location.
A) Fr = 3.125
B) Fr = 4.781
C) Fr = 22.950
D) Fr = 25.828
Unlock Deck
Unlock for access to all 90 flashcards in this deck.
Unlock Deck
k this deck
80
For a valid Friedman Fr-test, the probability distributions from which the samples within each block are drawn must be continuous.
Unlock Deck
Unlock for access to all 90 flashcards in this deck.
Unlock Deck
k this deck
Unlock Deck
Unlock for access to all 90 flashcards in this deck.


