Deck 6: Putting Statistics to Work
Full screen (f)
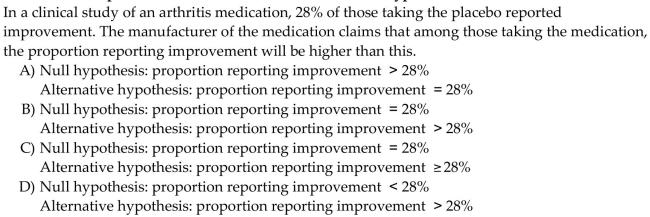
Question
Explanation:
Question
Question
Question
Question
Question
Question
Provide an appropriate response.
Question
Question
Question
Provide an appropriate response.
Question
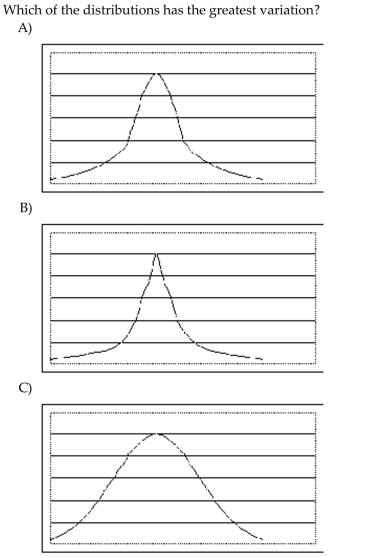
Select the requested distribution.
Which of the distributions is skewed to the right?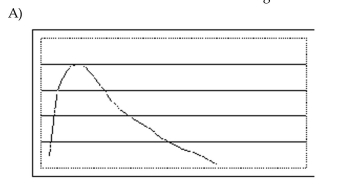
Which of the distributions is skewed to the right?
Question
Select the requested distribution.
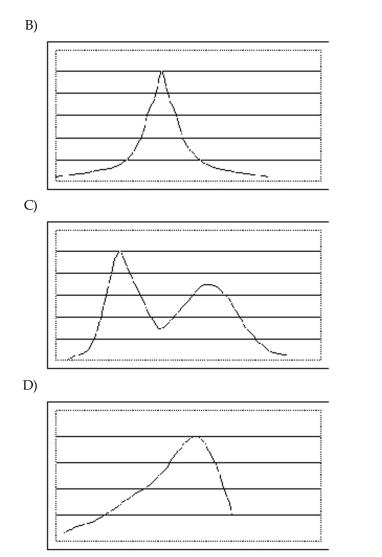
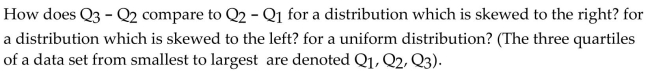
Which of the distributions is multimodal? 3)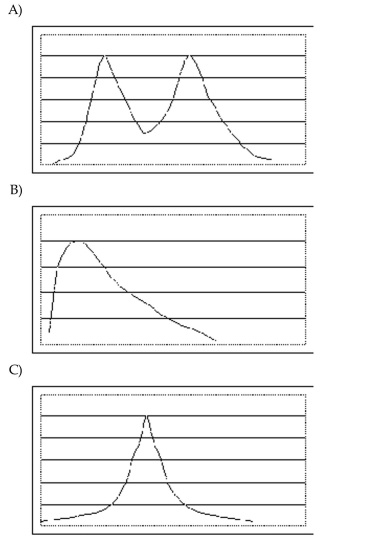
Which of the distributions is multimodal? 3)
Question
Question
Question
Question
Provide an appropriate response.
Question
Question
Select the requested distribution.
Which of the distributions is multimodal and approximately symmetric?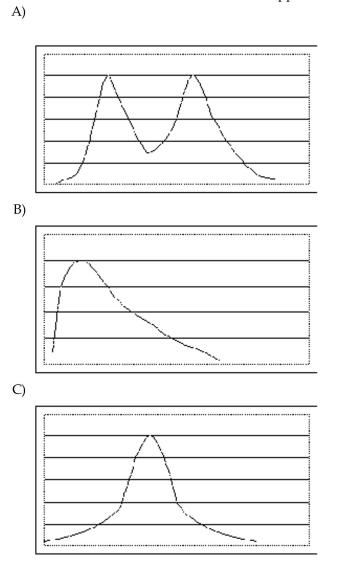
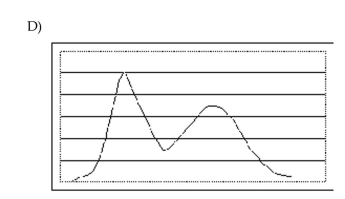
Which of the distributions is multimodal and approximately symmetric?
Question
Question
Question
Question
Question
Provide an appropriate response.
Question
Question
Question
Question
Provide an appropriate response.
Question
Question
Question
Question
Question
Provide an appropriate response.
Heights of gymnasts at a certain college are normally distributed. Which of the following are the most plausible values for the mean and standard deviation?
Heights of gymnasts at a certain college are normally distributed. Which of the following are the most plausible values for the mean and standard deviation?
Question
Question
Question
Question
Question
Question
Question
Question
Select the requested distribution.
Which of the distributions is symmetric?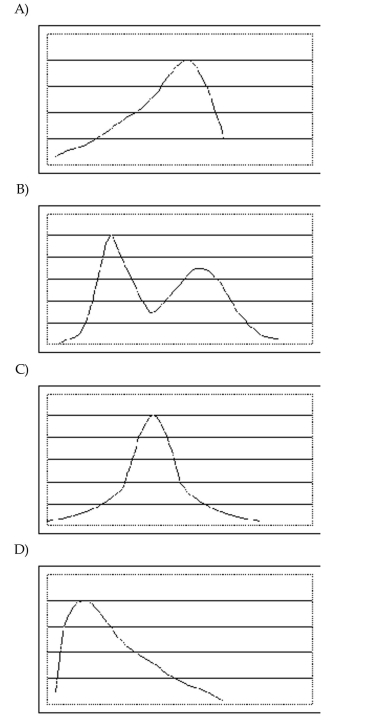
Which of the distributions is symmetric?
Question
Question
Provide an appropriate response.
Question
Question
Question
Provide an appropriate response.
Draw one boxplot to illustrate bell-shaped data, another for uniform data, and a third for
skewed data. Which of these shapes matches the boxplot for the first 100 digits of π?
(Below is the frequency table for the first 100 digits of π.)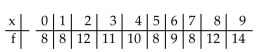
Draw one boxplot to illustrate bell-shaped data, another for uniform data, and a third for
skewed data. Which of these shapes matches the boxplot for the first 100 digits of π?
(Below is the frequency table for the first 100 digits of π.)
Question
Question
Question
Question
State which type of average, the mean, median, or mode, would be most appropriate in the situation described. Explainyour thinking.
The table below provides a frequency distribution for the winner of the Davis Cup during
the period 1977-1994.
The table below provides a frequency distribution for the winner of the Davis Cup during
the period 1977-1994.
Question
The result of a hypothesis is described in terms of the probability of obtaining a particular sample. Use the given contextto formulate the null and alternative hypotheses. Discuss whether the sample provides evidence for rejecting the nullhypothesis.
Question
Provide an appropriate response.
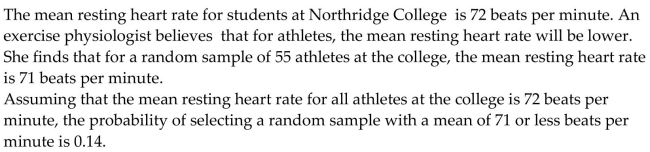
Describe any similarities or differences in the two distributions represented by the
boxplots below. Assume the two boxplots have the same scale.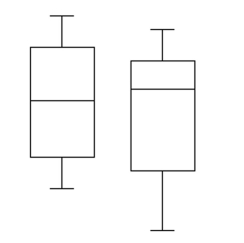
Describe any similarities or differences in the two distributions represented by the
boxplots below. Assume the two boxplots have the same scale.
Question
Provide an appropriate response.
The range and standard deviation of the data set below are 35 and 12.47 respectively.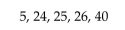 If the 26 is replaced with 39, how will this affect the range? How will this affect the
standard deviation. Use your answers to explain why the standard deviation is preferable
to the range as a measure of variation.
The range and standard deviation of the data set below are 35 and 12.47 respectively.
If the 26 is replaced with 39, how will this affect the range? How will this affect thestandard deviation. Use your answers to explain why the standard deviation is preferable
to the range as a measure of variation.
Question
Provide an appropriate response.

Question
Question
Provide an appropriate response.
In essence, the standard deviation indicates how far, on average, the observations are from
the mean. Do you think that for the data set below the standard deviation will give a good
indication of the typical deviation from the mean?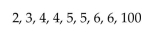 What drawback of the standard deviation is illustrated by this example?
In essence, the standard deviation indicates how far, on average, the observations are from
the mean. Do you think that for the data set below the standard deviation will give a good
indication of the typical deviation from the mean?
What drawback of the standard deviation is illustrated by this example? Question
The result of a hypothesis is described in terms of the probability of obtaining a particular sample. Use the given contextto formulate the null and alternative hypotheses. Discuss whether the sample provides evidence for rejecting the nullhypothesis.
Question
Question
The result of a hypothesis is described in terms of the probability of obtaining a particular sample. Use the given contextto formulate the null and alternative hypotheses. Discuss whether the sample provides evidence for rejecting the nullhypothesis.
Question
Provide an appropriate response.
Discuss the differences between the distributions represented by the two boxplots below.
Explain your reasoning.
Discuss the differences between the distributions represented by the two boxplots below.
Explain your reasoning.
Question
Question
Provide an appropriate response.
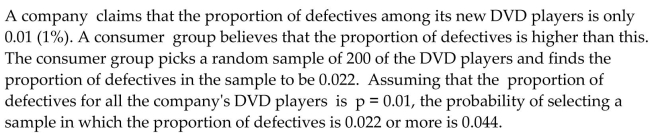
Four different distributions are represented by the four boxplots below. Which distribution has the smallest median? Which has the greatest variation? Which is
skewed to the left?
Four different distributions are represented by the four boxplots below.
Which distribution has the smallest median? Which has the greatest variation? Which isskewed to the left?
Question
A hypothesis test is to be performed. State the null and alternative hypotheses.
Question
Find the mode(s)for the given sample data.

Question
Question
Question
Question
Question
Question
Question
Question
A hypothesis test is to be performed. Describe the two possible outcomes of the test using the context of the givensituation.
A health insurer has determined that the "reasonable and customary" fee for a certain medical procedure is $1200. They suspect that the average fee charged by one particular clinic for this
Procedure is higher than $1200. The insurer wants to perform a hypothesis test to determine
Whether their suspicion is correct.
The hypothesis tests are as follows:
Null hypothesis: mean fee = $1200
Alternative hypothe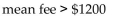
A)Rejecting the null hypothesis means there is evidence that the mean fee is greater than $1200. Failing to reject the null hypothesis means there is insufficient evidence to conclude that the
Mean fee is greater than $1200.
B)Rejecting the null hypothesis means there is evidence that the mean fee is greater than $1200. Accepting the null hypothesis means there is evidence to conclude that the mean fee is equal
To $1200.
C)Rejecting the null hypothesis means there is evidence that the mean fee is not equal to $1200. Failing to reject the null hypothesis means there is insufficient evidence to conclude that the
Mean fee is greater than $1200.
D)Rejecting the null hypothesis means there is evidence that the mean fee is greater than $1200. Failing to reject the null hypothesis means there is insufficient evidence to conclude that the
Mean fee is equal to $1200.
Question
Provide an appropriate response.
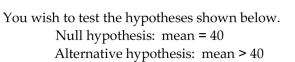 Would you be inclined to reject the null hypothesis if the sample mean turned out to be
much smaller than 40? Explain your thinking.
Would you be inclined to reject the null hypothesis if the sample mean turned out to bemuch smaller than 40? Explain your thinking.
Question
Question
Provide an appropriate response.
Jenny is conducting a hypothesis test concerning a population mean. The hypotheses are as
follows.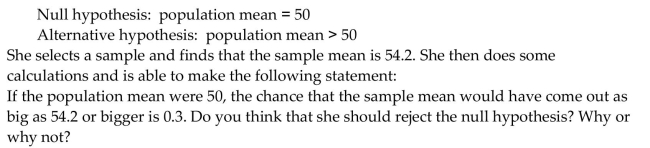
Jenny is conducting a hypothesis test concerning a population mean. The hypotheses are as
follows.
Question
Construct a boxplot as requested.
The test scores of 40 students are listed below. Construct a boxplot for the data set.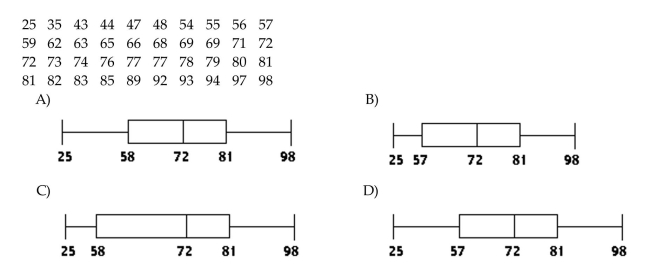
The test scores of 40 students are listed below. Construct a boxplot for the data set.
Question
Question
Question
The result of a hypothesis is described in terms of the probability of obtaining a particular sample. Use the given contextto formulate the null and alternative hypotheses. Discuss whether the sample provides evidence for rejecting the nullhypothesis.
Question
Question
The result of a hypothesis is described in terms of the probability of obtaining a particular sample. Use the given contextto formulate the null and alternative hypotheses. Discuss whether the sample provides evidence for rejecting the nullhypothesis.
The owner of a small manufacturing plant employs six people. The commute distances, in miles, for the six employees are listed below.
The owner of a small manufacturing plant employs six people. The commute distances, in miles, for the six employees are listed below.

Unlock Deck
Sign up to unlock the cards in this deck!
Unlock Deck
Unlock Deck
1/258
Play
Full screen (f)
Deck 6: Putting Statistics to Work
1
Explanation:
C
2
Provide an appropriate response.
Which of the following statements is true?
A)The mean is always one of the data points in a set of data.
B)The mode is always one of the data points in a set of data.
C)The median is always one of the data points in a set of data
D)None of the above is true
Which of the following statements is true?
A)The mean is always one of the data points in a set of data.
B)The mode is always one of the data points in a set of data.
C)The median is always one of the data points in a set of data
D)None of the above is true
B
3
Provide an appropriate response.
Scores on a test are normally distributed. Which of the following statements is (are)plausible? A: Margo's score was in the 90th percentile and she got a C
B: Helena's score was in the 40th percentile and she got an A
C: Monica's score was in the 5th percentile and she failed
D: Gale's score was in the 70th percentile and she got a D
A)C and D
B)C only
C)B and C
D)A and B
E)D only
B
4
Provide an appropriate response.
Traditionally in hypothesis testing the null hypothesis represents the "status quo" which will be overturned only if there is evidence against it. Which of the statements below might represent a
Null hypothesis?
A)The treatment has no effect.
B)The mean temperature this decade is higher than the mean temperature over the past century.
C)The teaching method raises SAT scores.
D)The defendant is guilty.
Unlock Deck
Unlock for access to all 258 flashcards in this deck.
Unlock Deck
k this deck
5
Answer the question.
Tell which of the following distributions would have the least variation. 4)
A)100-meter times for college seniors
B)100-meter times for male college seniors
C)100-meter times for adults
D)100-meter times for male Olympic sprinters
Tell which of the following distributions would have the least variation. 4)
A)100-meter times for college seniors
B)100-meter times for male college seniors
C)100-meter times for adults
D)100-meter times for male Olympic sprinters
Unlock Deck
Unlock for access to all 258 flashcards in this deck.
Unlock Deck
k this deck
6
Provide an appropriate response.
A data set consists of 9 values which are not all the same. Which of the following is possible?
A)The mode is equal to the largest value.
B)The mean is equal to the largest value.
C)The median is equal to the largest value.
D)None of the above is possible.
A data set consists of 9 values which are not all the same. Which of the following is possible?
A)The mode is equal to the largest value.
B)The mean is equal to the largest value.
C)The median is equal to the largest value.
D)None of the above is possible.
Unlock Deck
Unlock for access to all 258 flashcards in this deck.
Unlock Deck
k this deck
7
Provide an appropriate response.
Unlock Deck
Unlock for access to all 258 flashcards in this deck.
Unlock Deck
k this deck
8
Answer the question.
Tell which of the following distributions would have the least variation.
A)Weights of all adults
B)Weights of 20-year olds
C)Weights of adult men
D)Weights of 20-year old women
Tell which of the following distributions would have the least variation.
A)Weights of all adults
B)Weights of 20-year olds
C)Weights of adult men
D)Weights of 20-year old women
Unlock Deck
Unlock for access to all 258 flashcards in this deck.
Unlock Deck
k this deck
9
Answer the question.
Tell which of the following distributions would have the most variation.
A)Scores on a test in which all students got a perfect score
B)Scores on a test in which half the students got a C and half failed
C)Scores on a test in which half the students got an A and half failed
D)Scores on a test in which half the students got an A and half got a B
Unlock Deck
Unlock for access to all 258 flashcards in this deck.
Unlock Deck
k this deck
10
Provide an appropriate response.
Unlock Deck
Unlock for access to all 258 flashcards in this deck.
Unlock Deck
k this deck
11
Select the requested distribution.
Which of the distributions is skewed to the right?
Which of the distributions is skewed to the right?
Unlock Deck
Unlock for access to all 258 flashcards in this deck.
Unlock Deck
k this deck
12
Select the requested distribution.
Which of the distributions is multimodal? 3)
Which of the distributions is multimodal? 3)
Unlock Deck
Unlock for access to all 258 flashcards in this deck.
Unlock Deck
k this deck
13
Provide an appropriate response.
Which quantity describes how widely data values are spread about the center of a distribution?
A)Skewness
B)Number of peaks
C)Mean
D)Variation
Which quantity describes how widely data values are spread about the center of a distribution?
A)Skewness
B)Number of peaks
C)Mean
D)Variation
Unlock Deck
Unlock for access to all 258 flashcards in this deck.
Unlock Deck
k this deck
14
Answer the question.
Tell which of the following distributions would have the least variation.
A)Number of children for women in Kenya
B)Number of children for women in Portland, Oregon
C)Number of children for women in India
D)Number of children for women in Haiti
Tell which of the following distributions would have the least variation.
A)Number of children for women in Kenya
B)Number of children for women in Portland, Oregon
C)Number of children for women in India
D)Number of children for women in Haiti
Unlock Deck
Unlock for access to all 258 flashcards in this deck.
Unlock Deck
k this deck
15
Provide an appropriate response.
Which of the following is not possible?
A)Two data sets have equal means and modes but still have very different distributions.
B)A distribution is symmetric and single peaked and the mean, median, and mode are all equal.
C)A distribution is symmetric and the mode is different from the mean.
D)A distribution is symmetric and single peaked and the mode is greater than the mean.
Unlock Deck
Unlock for access to all 258 flashcards in this deck.
Unlock Deck
k this deck
16
Provide an appropriate response.
Unlock Deck
Unlock for access to all 258 flashcards in this deck.
Unlock Deck
k this deck
17
Provide an appropriate response.
Which of the following statements is not true for a left-skewed distribution?
A)The mode is at the peak
B)The median is smaller than the mode
C)The mode is greater than the mean
D)The mean is greater than the median
Which of the following statements is not true for a left-skewed distribution?
A)The mode is at the peak
B)The median is smaller than the mode
C)The mode is greater than the mean
D)The mean is greater than the median
Unlock Deck
Unlock for access to all 258 flashcards in this deck.
Unlock Deck
k this deck
18
Select the requested distribution.
Which of the distributions is multimodal and approximately symmetric?
Which of the distributions is multimodal and approximately symmetric?
Unlock Deck
Unlock for access to all 258 flashcards in this deck.
Unlock Deck
k this deck
19
Provide an appropriate response.
A variable is normally distributed with a mean of 100. Which of the following is the largest?
A)The percentage of observations between 90 and 100
B)The percentage of observations between 95 and 105
C)The percentage of observations between 80 and 90
D)The percentage of observations between 100 and 110
Unlock Deck
Unlock for access to all 258 flashcards in this deck.
Unlock Deck
k this deck
20
Answer the question.
Tell which of the following distributions would have the least variation.
A)Weights of all pet dogs
B)Weights of all pet cats
C)Weights of all children who have a pet cat
D)Weights of all pets
Tell which of the following distributions would have the least variation.
A)Weights of all pet dogs
B)Weights of all pet cats
C)Weights of all children who have a pet cat
D)Weights of all pets
Unlock Deck
Unlock for access to all 258 flashcards in this deck.
Unlock Deck
k this deck
21
Provide an appropriate response.
If a hypothesis test is conducted at a significance level of 0.05, which of the following statements is true?
A)The probability that the result will be significant is 0.05.
B)The probability that the null hypothesis will be rejected when it is true is 0.05.
C)The probability that the null hypothesis will not be rejected when it is false is 0.05.
D)The probability that the null hypothesis will be rejected when it is false is 0.05.
Unlock Deck
Unlock for access to all 258 flashcards in this deck.
Unlock Deck
k this deck
22
Provide an appropriate response.
A criminal trial can be compared to a hypothesis test. The hypotheses are as follows: Null hypothesis: The defendant is innocent
Alternative hypothesis: The defendant is guilty
Suppose that in one trial, if convicted, the defendant will receive the death penalty. Do you think
That a significance level of 0.05 or 0.01 is more appropriate in this case. Why?
A)0.05. It is important not to reject the null hypothesis if it is true.
B)0.01. It is important not to reject the null hypothesis if it is true.
C)0.05. It is important to reject the null hypothesis if it is false.
D)0.01. It is important to reject the null hypothesis if it is false.
Unlock Deck
Unlock for access to all 258 flashcards in this deck.
Unlock Deck
k this deck
23
Provide an appropriate response.
Unlock Deck
Unlock for access to all 258 flashcards in this deck.
Unlock Deck
k this deck
24
Answer the question.
Tell which of the following distributions would have the most variation.
A)Temperature over a one-month period in San Diego.
B)Temperature over a one-year period in Boston.
C)Temperature over a one-month period in Boston.
D)Temperature over a one-year period in San Diego.
Tell which of the following distributions would have the most variation.
A)Temperature over a one-month period in San Diego.
B)Temperature over a one-year period in Boston.
C)Temperature over a one-month period in Boston.
D)Temperature over a one-year period in San Diego.
Unlock Deck
Unlock for access to all 258 flashcards in this deck.
Unlock Deck
k this deck
25
Provide an appropriate response.
Of the mean, median, and mode, which take(s)into account the numerical size of all the data values?
A)The mean only
B)The median and mode
C)The mean and median
D)All of them
Of the mean, median, and mode, which take(s)into account the numerical size of all the data values?
A)The mean only
B)The median and mode
C)The mean and median
D)All of them
Unlock Deck
Unlock for access to all 258 flashcards in this deck.
Unlock Deck
k this deck
26
Provide an appropriate response.
A data set consists of 9 values which are all different. Which of the following is possible?
A)The median is equal to the second smallest value.
B)The mean is equal to the second smallest value.
C)The mode is equal to the second smallest value.
D)None of the above is possible.
A data set consists of 9 values which are all different. Which of the following is possible?
A)The median is equal to the second smallest value.
B)The mean is equal to the second smallest value.
C)The mode is equal to the second smallest value.
D)None of the above is possible.
Unlock Deck
Unlock for access to all 258 flashcards in this deck.
Unlock Deck
k this deck
27
Provide an appropriate response.
Unlock Deck
Unlock for access to all 258 flashcards in this deck.
Unlock Deck
k this deck
28
Provide an appropriate response.
Which of the following is not possible?
A)A distribution is right-skewed and the mean is greater than the median
B)A distribution has a single peak and the mean and median are different
C)A distribution is left-skewed and the mean is equal to the median
D)A distribution is not symmetric and the median is equal to the mean
Unlock Deck
Unlock for access to all 258 flashcards in this deck.
Unlock Deck
k this deck
29
Answer the question.
Tell which of the following distributions would have the most variation.
A)Salaries of high-school teachers
B)Salaries of bank clerks
C)Salaries of waitresses
D)Salaries of CEOs of U.S. corporations
Tell which of the following distributions would have the most variation.
A)Salaries of high-school teachers
B)Salaries of bank clerks
C)Salaries of waitresses
D)Salaries of CEOs of U.S. corporations
Unlock Deck
Unlock for access to all 258 flashcards in this deck.
Unlock Deck
k this deck
30
Write the word or phrase that best completes each statement or answers the question.State which type of average, the mean, median, or mode, would be most appropriate in the situation described. Explainyour thinking.
Before a mayoral election, a pollster tries to predict which candidate will win the most
votes. Which average does the pollster need to know?
Before a mayoral election, a pollster tries to predict which candidate will win the most
votes. Which average does the pollster need to know?
Unlock Deck
Unlock for access to all 258 flashcards in this deck.
Unlock Deck
k this deck
31
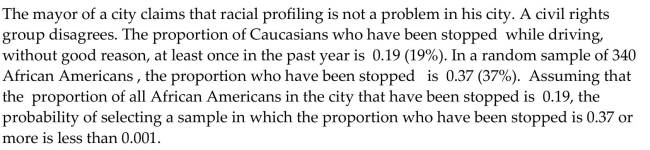
The result of a hypothesis is described in terms of the probability of obtaining a particular sample. Use the given contextto formulate the null and alternative hypotheses. Discuss whether the sample provides evidence for rejecting the nullhypothesis.
A public bus company official claims that the mean waiting time for bus number 14 during
peak hours is only 10 minutes. Karen finds this hard to believe as she seems to be
invariably late for work. For 42 randomly selected days, her mean waiting time for bus 14
during peak hours was 11.3 minutes.
Assuming that the population mean waiting time is 10 minutes , the probability of
selecting a random sample with a mean waiting time of 11.3 minutes or more is 0.0026.
Unlock Deck
Unlock for access to all 258 flashcards in this deck.
Unlock Deck
k this deck
32
Provide an appropriate response.
Heights of gymnasts at a certain college are normally distributed. Which of the following are the most plausible values for the mean and standard deviation?
Heights of gymnasts at a certain college are normally distributed. Which of the following are the most plausible values for the mean and standard deviation?
Unlock Deck
Unlock for access to all 258 flashcards in this deck.
Unlock Deck
k this deck
33
State which type of average, the mean, median, or mode, would be most appropriate in the situation described. Explainyour thinking.
A shoe manufacturer wants to know in which size they should make the most shoes.
Which type of average would be the most useful?
A shoe manufacturer wants to know in which size they should make the most shoes.
Which type of average would be the most useful?
Unlock Deck
Unlock for access to all 258 flashcards in this deck.
Unlock Deck
k this deck
34
Provide an appropriate response.
Of the mean, median, and mode, which is (are)affected by outliers?
A)The mean and mode
B)The median and mode
C)The mean only
D)The mean and median
Of the mean, median, and mode, which is (are)affected by outliers?
A)The mean and mode
B)The median and mode
C)The mean only
D)The mean and median
Unlock Deck
Unlock for access to all 258 flashcards in this deck.
Unlock Deck
k this deck
35
Provide an appropriate response.
Rank the mean, median, and mode in order of ascending size for a right-skewed distribution.
A)Mean, Median, Mode
B)Mode, Mean, Median
C)Mode, Median, Mean
D)Median, Mode, Mean
Rank the mean, median, and mode in order of ascending size for a right-skewed distribution.
A)Mean, Median, Mode
B)Mode, Mean, Median
C)Mode, Median, Mean
D)Median, Mode, Mean
Unlock Deck
Unlock for access to all 258 flashcards in this deck.
Unlock Deck
k this deck
36
Provide an appropriate response.
Marcella is nearing retirement age and has some money to invest. She is deciding between
Fund A which in the past has grown by a mean of 7% per year with a standard deviation of
2% and Fund B which has grown by a mean of 10% with a standard deviation of 6%.
Which fund should she choose? Explain your thinking.
Unlock Deck
Unlock for access to all 258 flashcards in this deck.
Unlock Deck
k this deck
37
Answer the question.
Tell which of the following distributions would have the most variation.
A)The number of hours of light per day over a one-year period at the North Pole
B)The number of hours of light per day over a one-year period at the equator
C)The number of hours of light per day over a one-year period in Mexico City
D)The number of hours of light per day over a one-year period in New York
Unlock Deck
Unlock for access to all 258 flashcards in this deck.
Unlock Deck
k this deck
38
Provide an appropriate response.
In the Florida lottery, the numbers (between 1 and 49)are generated randomly with the
expectation that each number has an equal chance of winning. Draw a boxplot which
should illustrate the data set of all numbers picked for the lottery during the past year.
In the Florida lottery, the numbers (between 1 and 49)are generated randomly with the
expectation that each number has an equal chance of winning. Draw a boxplot which
should illustrate the data set of all numbers picked for the lottery during the past year.
Unlock Deck
Unlock for access to all 258 flashcards in this deck.
Unlock Deck
k this deck
39
Provide an appropriate response.
A company advertises an average of 42,000 miles for one of its new tires. In the
manufacturing process there is some variation around that average. Would the company
want a process that provides a large or a small standard deviation? Justify your answer.
A company advertises an average of 42,000 miles for one of its new tires. In the
manufacturing process there is some variation around that average. Would the company
want a process that provides a large or a small standard deviation? Justify your answer.
Unlock Deck
Unlock for access to all 258 flashcards in this deck.
Unlock Deck
k this deck
40
Select the requested distribution.
Which of the distributions is symmetric?
Which of the distributions is symmetric?
Unlock Deck
Unlock for access to all 258 flashcards in this deck.
Unlock Deck
k this deck
41
Provide an appropriate response.
An environmental group is investigating global warming and is conducting a hypothesis
test. The hypotheses are as follows:
Null hypothesis: The mean temperature has not changed in recent years
Alternative hypothesis: The mean temperature has increased in recent years
Do you think that the environmental group would prefer a significance level of 0.05 or
0.01. Why? Do you think that car manufacturers would prefer a significance level of 0.05 or
0.01? Why?
Unlock Deck
Unlock for access to all 258 flashcards in this deck.
Unlock Deck
k this deck
42
Provide an appropriate response.
Unlock Deck
Unlock for access to all 258 flashcards in this deck.
Unlock Deck
k this deck
43
Provide an appropriate response.
You are late for work. You have two options for getting to work. You may take the bus
which takes on average 40 minutes with a standard deviation of 12 minutes. Or you can
cycle which takes on average 50 minutes with a standard deviation of 2 minutes. Compare
these two distributions.
You leave your house at 8.20 am and are supposed to start work at 9.00 am.
Which option would you choose if you will be fired if you are even a few minutes late?
Which option would you choose if you know that up to 15 minutes late is OK but after that
there is trouble? Explain your thinking.
Unlock Deck
Unlock for access to all 258 flashcards in this deck.
Unlock Deck
k this deck
44
Provide an appropriate response.
A population consists of 100 professional gymnasts and 100 professional basketball
players. For this group, the average height is 70 inches. However, most of the gymnasts are
between 57 and 61 inches tall while most of the basketball players are between 78 and 82
inches tall. For this group, observations far from the mean are more common than
observations close to the mean. Describe what a boxplot for the heights of this group
would look like. Discuss, in particular, the lengths of the whiskers relative to the width of
the box and explain your reasoning.
Unlock Deck
Unlock for access to all 258 flashcards in this deck.
Unlock Deck
k this deck
45
Provide an appropriate response.
Draw one boxplot to illustrate bell-shaped data, another for uniform data, and a third for
skewed data. Which of these shapes matches the boxplot for the first 100 digits of π?
(Below is the frequency table for the first 100 digits of π.)
Draw one boxplot to illustrate bell-shaped data, another for uniform data, and a third for
skewed data. Which of these shapes matches the boxplot for the first 100 digits of π?
(Below is the frequency table for the first 100 digits of π.)
Unlock Deck
Unlock for access to all 258 flashcards in this deck.
Unlock Deck
k this deck
46
Provide an appropriate response.
Can the sample variance ever be a negative number? If so, for what types of data? If not,
why not? Can the sample variance ever be zero? If so, for what types of data? If not, why
not? Explain your reasoning.
Can the sample variance ever be a negative number? If so, for what types of data? If not,
why not? Can the sample variance ever be zero? If so, for what types of data? If not, why
not? Explain your reasoning.
Unlock Deck
Unlock for access to all 258 flashcards in this deck.
Unlock Deck
k this deck
47
Provide an appropriate response.
You are the coach of a basketball team. Player A's mean score per game over the last
season has been 24 with a standard deviation of 2. Player B's mean score per game over
the last season has been 23 with a standard deviation of 6. Contrast the performance of the
two players. Which player would be your choice to play in a game in which you all you
need is a medium performance to win? Which player would be your choice to play in a
game in which your team needs an exceptional performance in order to win?
Unlock Deck
Unlock for access to all 258 flashcards in this deck.
Unlock Deck
k this deck
48
State which type of average, the mean, median, or mode, would be most appropriate in the situation described. Explainyour thinking.
Dave is a college student contemplating a possible career option. One factor that will
influence his decision is the amount of money he is likely to make. He decides to look up
the average starting salary of graduates in that profession. Which information would be
most useful to him, the mean starting salary, the median starting salary, or the mode of the
starting salaries. Why?
Unlock Deck
Unlock for access to all 258 flashcards in this deck.
Unlock Deck
k this deck
49
State which type of average, the mean, median, or mode, would be most appropriate in the situation described. Explainyour thinking.
The table below provides a frequency distribution for the winner of the Davis Cup during
the period 1977-1994.
The table below provides a frequency distribution for the winner of the Davis Cup during
the period 1977-1994.
Unlock Deck
Unlock for access to all 258 flashcards in this deck.
Unlock Deck
k this deck
50
The result of a hypothesis is described in terms of the probability of obtaining a particular sample. Use the given contextto formulate the null and alternative hypotheses. Discuss whether the sample provides evidence for rejecting the nullhypothesis.
Unlock Deck
Unlock for access to all 258 flashcards in this deck.
Unlock Deck
k this deck
51
Provide an appropriate response.
Describe any similarities or differences in the two distributions represented by the
boxplots below. Assume the two boxplots have the same scale.
Describe any similarities or differences in the two distributions represented by the
boxplots below. Assume the two boxplots have the same scale.
Unlock Deck
Unlock for access to all 258 flashcards in this deck.
Unlock Deck
k this deck
52
Provide an appropriate response.
The range and standard deviation of the data set below are 35 and 12.47 respectively. If the 26 is replaced with 39, how will this affect the range? How will this affect the
standard deviation. Use your answers to explain why the standard deviation is preferable
to the range as a measure of variation.
The range and standard deviation of the data set below are 35 and 12.47 respectively.
If the 26 is replaced with 39, how will this affect the range? How will this affect thestandard deviation. Use your answers to explain why the standard deviation is preferable
to the range as a measure of variation.
Unlock Deck
Unlock for access to all 258 flashcards in this deck.
Unlock Deck
k this deck
53
Provide an appropriate response.
Unlock Deck
Unlock for access to all 258 flashcards in this deck.
Unlock Deck
k this deck
54
The result of a hypothesis is described in terms of the probability of obtaining a particular sample. Use the given contextto formulate the null and alternative hypotheses. Discuss whether the sample provides evidence for rejecting the nullhypothesis.
A company claims that it pays women the same as men for comparable work. The union
decides to investigate this claim. The mean monthly salary for men in entry level positions
is $2250. Amongst a random sample of 60 female employees in similar positions , the
mean monthly salary was $2210.
Assuming that the mean salary for all female employees in entry level positions is $2250,
the probability of selecting a sample in which the mean monthly salary is $2210 or less is
0.06.
Unlock Deck
Unlock for access to all 258 flashcards in this deck.
Unlock Deck
k this deck
55
Provide an appropriate response.
In essence, the standard deviation indicates how far, on average, the observations are from
the mean. Do you think that for the data set below the standard deviation will give a good
indication of the typical deviation from the mean? What drawback of the standard deviation is illustrated by this example?
In essence, the standard deviation indicates how far, on average, the observations are from
the mean. Do you think that for the data set below the standard deviation will give a good
indication of the typical deviation from the mean?
What drawback of the standard deviation is illustrated by this example? Unlock Deck
Unlock for access to all 258 flashcards in this deck.
Unlock Deck
k this deck
56
The result of a hypothesis is described in terms of the probability of obtaining a particular sample. Use the given contextto formulate the null and alternative hypotheses. Discuss whether the sample provides evidence for rejecting the nullhypothesis.
Unlock Deck
Unlock for access to all 258 flashcards in this deck.
Unlock Deck
k this deck
57
State which type of average, the mean, median, or mode, would be most appropriate in the situation described. Explainyour thinking.
An engineer has designed an elevator and wishes to determine the maximum number of
people that will be allowed to ride in the elevator at a time. In order to do this, the engineer
needs to know the average weight of the people likely to ride in the elevator. Which type of
average would be the most useful?
Unlock Deck
Unlock for access to all 258 flashcards in this deck.
Unlock Deck
k this deck
58
The result of a hypothesis is described in terms of the probability of obtaining a particular sample. Use the given contextto formulate the null and alternative hypotheses. Discuss whether the sample provides evidence for rejecting the nullhypothesis.
Unlock Deck
Unlock for access to all 258 flashcards in this deck.
Unlock Deck
k this deck
59
Provide an appropriate response.
Discuss the differences between the distributions represented by the two boxplots below.
Explain your reasoning.
Discuss the differences between the distributions represented by the two boxplots below.
Explain your reasoning.
Unlock Deck
Unlock for access to all 258 flashcards in this deck.
Unlock Deck
k this deck
60
Provide an appropriate response.
We want to compare two different groups of students, students taking Composition 1 in a
traditional lecture format and students taking Composition 1 in a distance learning format.
We know that the mean score on the research paper is 85 for both groups. What additional
information would be provided by knowing the standard deviation?
Unlock Deck
Unlock for access to all 258 flashcards in this deck.
Unlock Deck
k this deck
61
Provide an appropriate response.
Four different distributions are represented by the four boxplots below. Which distribution has the smallest median? Which has the greatest variation? Which is
skewed to the left?
Four different distributions are represented by the four boxplots below.
Which distribution has the smallest median? Which has the greatest variation? Which isskewed to the left?
Unlock Deck
Unlock for access to all 258 flashcards in this deck.
Unlock Deck
k this deck
62
A hypothesis test is to be performed. State the null and alternative hypotheses.
Unlock Deck
Unlock for access to all 258 flashcards in this deck.
Unlock Deck
k this deck
63
Find the mode(s)for the given sample data.
Unlock Deck
Unlock for access to all 258 flashcards in this deck.
Unlock Deck
k this deck
64
Find a 95% confidence interval for the true population proportion.
In a survey of 114 adults, 24% said that they had tried acupuncture at some point in their lives.
A)23.1% to 24.9%
B)23.9% to 24.1%
C)19.3% to 28.7%
D)14.6% to 33.4%
In a survey of 114 adults, 24% said that they had tried acupuncture at some point in their lives.
A)23.1% to 24.9%
B)23.9% to 24.1%
C)19.3% to 28.7%
D)14.6% to 33.4%
Unlock Deck
Unlock for access to all 258 flashcards in this deck.
Unlock Deck
k this deck
65
Provide an appropriate response.
What does it mean for an observed difference to be statistically significant at the 0.01 level?
A)The probability of the observed difference occurring by chance is 1 in 100 or more.
B)The probability of the observed difference occurring by chance is 1 in 100 or less.
C)The probability of the observed difference occurring if the alternative hypothesis is true is 1 in 100 or more.
D)The probability of the observed difference occurring if the alternative hypothesis is true is 1 in 100 or less.
Unlock Deck
Unlock for access to all 258 flashcards in this deck.
Unlock Deck
k this deck
66
State which type of average, the mean, median, or mode, would be most appropriate in the situation described. Explainyour thinking.
A state governor is planning a tax cut. The governor is to announce the average amount
that people would save if the tax cut were to take effect. If the governor wants to
exaggerate the benefit of the tax cut, which average would he quote?
A state governor is planning a tax cut. The governor is to announce the average amount
that people would save if the tax cut were to take effect. If the governor wants to
exaggerate the benefit of the tax cut, which average would he quote?
Unlock Deck
Unlock for access to all 258 flashcards in this deck.
Unlock Deck
k this deck
67
State how many peaks you would expect for the distribution described.
Numbers of people with birthdays in a particular month (January through December)
A)None
B)Three
C)One
D)Two
Numbers of people with birthdays in a particular month (January through December)
A)None
B)Three
C)One
D)Two
Unlock Deck
Unlock for access to all 258 flashcards in this deck.
Unlock Deck
k this deck
68
Provide an appropriate response.
Boxplots are graphs that are useful for revealing central tendency, the spread of the data,
the distribution of the data and the presence of outliers. Draw an example of a box plot and
comment on each of these characteristics as shown by your boxplot.
Boxplots are graphs that are useful for revealing central tendency, the spread of the data,
the distribution of the data and the presence of outliers. Draw an example of a box plot and
comment on each of these characteristics as shown by your boxplot.
Unlock Deck
Unlock for access to all 258 flashcards in this deck.
Unlock Deck
k this deck
69
State which type of average, the mean, median, or mode, would be most appropriate in the situation described. Explainyour thinking.
A parcel service wants to estimate how many vans it will need. It knows how many parcels
are delivered each day, but it also needs to know the average volume of the parcels. Which
average would be the most useful?
A parcel service wants to estimate how many vans it will need. It knows how many parcels
are delivered each day, but it also needs to know the average volume of the parcels. Which
average would be the most useful?
Unlock Deck
Unlock for access to all 258 flashcards in this deck.
Unlock Deck
k this deck
70
State which type of average, the mean, median, or mode, would be most appropriate in the situation described. Explainyour thinking.
You are considering moving to a new city and would like to know the average price of a
new home in that city. Which type of average would be the most useful to you?
You are considering moving to a new city and would like to know the average price of a
new home in that city. Which type of average would be the most useful to you?
Unlock Deck
Unlock for access to all 258 flashcards in this deck.
Unlock Deck
k this deck
71
A hypothesis test is to be performed. Describe the two possible outcomes of the test using the context of the givensituation.
A health insurer has determined that the "reasonable and customary" fee for a certain medical procedure is $1200. They suspect that the average fee charged by one particular clinic for this
Procedure is higher than $1200. The insurer wants to perform a hypothesis test to determine
Whether their suspicion is correct.
The hypothesis tests are as follows:
Null hypothesis: mean fee = $1200
Alternative hypothe
A)Rejecting the null hypothesis means there is evidence that the mean fee is greater than $1200. Failing to reject the null hypothesis means there is insufficient evidence to conclude that the
Mean fee is greater than $1200.
B)Rejecting the null hypothesis means there is evidence that the mean fee is greater than $1200. Accepting the null hypothesis means there is evidence to conclude that the mean fee is equal
To $1200.
C)Rejecting the null hypothesis means there is evidence that the mean fee is not equal to $1200. Failing to reject the null hypothesis means there is insufficient evidence to conclude that the
Mean fee is greater than $1200.
D)Rejecting the null hypothesis means there is evidence that the mean fee is greater than $1200. Failing to reject the null hypothesis means there is insufficient evidence to conclude that the
Mean fee is equal to $1200.
A health insurer has determined that the "reasonable and customary" fee for a certain medical procedure is $1200. They suspect that the average fee charged by one particular clinic for this
Procedure is higher than $1200. The insurer wants to perform a hypothesis test to determine
Whether their suspicion is correct.
The hypothesis tests are as follows:
Null hypothesis: mean fee = $1200
Alternative hypothe
A)Rejecting the null hypothesis means there is evidence that the mean fee is greater than $1200. Failing to reject the null hypothesis means there is insufficient evidence to conclude that the
Mean fee is greater than $1200.
B)Rejecting the null hypothesis means there is evidence that the mean fee is greater than $1200. Accepting the null hypothesis means there is evidence to conclude that the mean fee is equal
To $1200.
C)Rejecting the null hypothesis means there is evidence that the mean fee is not equal to $1200. Failing to reject the null hypothesis means there is insufficient evidence to conclude that the
Mean fee is greater than $1200.
D)Rejecting the null hypothesis means there is evidence that the mean fee is greater than $1200. Failing to reject the null hypothesis means there is insufficient evidence to conclude that the
Mean fee is equal to $1200.
Unlock Deck
Unlock for access to all 258 flashcards in this deck.
Unlock Deck
k this deck
72
Provide an appropriate response.
Would you be inclined to reject the null hypothesis if the sample mean turned out to be
much smaller than 40? Explain your thinking.
Would you be inclined to reject the null hypothesis if the sample mean turned out to bemuch smaller than 40? Explain your thinking.
Unlock Deck
Unlock for access to all 258 flashcards in this deck.
Unlock Deck
k this deck
73
Identify the distribution as symmetric, left-skewed, or right-skewed.
Age at death for residents of the U.S.
A)Right-skewed
B)Symmetric
C)Left-skewed
Age at death for residents of the U.S.
A)Right-skewed
B)Symmetric
C)Left-skewed
Unlock Deck
Unlock for access to all 258 flashcards in this deck.
Unlock Deck
k this deck
74
Provide an appropriate response.
Jenny is conducting a hypothesis test concerning a population mean. The hypotheses are as
follows.
Jenny is conducting a hypothesis test concerning a population mean. The hypotheses are as
follows.
Unlock Deck
Unlock for access to all 258 flashcards in this deck.
Unlock Deck
k this deck
75
Construct a boxplot as requested.
The test scores of 40 students are listed below. Construct a boxplot for the data set.
The test scores of 40 students are listed below. Construct a boxplot for the data set.
Unlock Deck
Unlock for access to all 258 flashcards in this deck.
Unlock Deck
k this deck
76
State which type of average, the mean, median, or mode, would be most appropriate in the situation described. Explainyour thinking.
Suppose that a state introduces a state income tax which will be at a flat rate of 3%. The
state legislature wishes to estimate how much money they will receive in taxes, and to do
this they need to know the average income of residents of the state. Which information
would be most useful, the mean income, the median income, or the mode of the incomes?
Why?
Unlock Deck
Unlock for access to all 258 flashcards in this deck.
Unlock Deck
k this deck
77
State which type of average, the mean, median, or mode, would be most appropriate in the situation described. Explainyour thinking.
A state governor is planning a tax cut. A researcher calculates the average amount that
will be saved by residents of the state. Which average would best convey the amount that
will be saved by most residents of the state?
A state governor is planning a tax cut. A researcher calculates the average amount that
will be saved by residents of the state. Which average would best convey the amount that
will be saved by most residents of the state?
Unlock Deck
Unlock for access to all 258 flashcards in this deck.
Unlock Deck
k this deck
78
The result of a hypothesis is described in terms of the probability of obtaining a particular sample. Use the given contextto formulate the null and alternative hypotheses. Discuss whether the sample provides evidence for rejecting the nullhypothesis.
Unlock Deck
Unlock for access to all 258 flashcards in this deck.
Unlock Deck
k this deck
79
The result of a hypothesis is described in terms of the probability of obtaining a particular sample. Use the given contextto formulate the null and alternative hypotheses. Discuss whether the sample provides evidence for rejecting the nullhypothesis.
A consumer group believes that the mean volume of juice in a company's 24 ounce juice
bottles is actually less than 24 ounces.
In a random sample of 310 bottles, the mean volume of juice was 23.9 ounces.
Assuming that the mean volume of juice for all the company's 24-ounce bottles is 24
ounces, the probability of selecting a random sample with a mean volume of 23.9 ounces
or less is 0.00017.
Unlock Deck
Unlock for access to all 258 flashcards in this deck.
Unlock Deck
k this deck
80
The result of a hypothesis is described in terms of the probability of obtaining a particular sample. Use the given contextto formulate the null and alternative hypotheses. Discuss whether the sample provides evidence for rejecting the nullhypothesis.
The owner of a small manufacturing plant employs six people. The commute distances, in miles, for the six employees are listed below.
The owner of a small manufacturing plant employs six people. The commute distances, in miles, for the six employees are listed below.
Unlock Deck
Unlock for access to all 258 flashcards in this deck.
Unlock Deck
k this deck
Unlock Deck
Unlock for access to all 258 flashcards in this deck.


