Deck 3: Descriptive Measures
Full screen (f)
Question
Provide an appropriate response.
The range and standard deviation of the data set below are 35 and 12.47 respectively. If the 26 is replaced with 39, how will this affect the range? How will this affect the
standard deviation. Use your answers to explain why the standard deviation is preferable
to the range as a measure of variation.
The range and standard deviation of the data set below are 35 and 12.47 respectively.
If the 26 is replaced with 39, how will this affect the range? How will this affect thestandard deviation. Use your answers to explain why the standard deviation is preferable
to the range as a measure of variation.
Question
Provide an appropriate response.
The data set below consists of the scores of 15 students on a quiz. For this data set, which
measure of variation do you think is more appropriate, the range or the standard
deviation? Explain your thinking.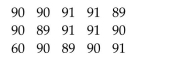
The data set below consists of the scores of 15 students on a quiz. For this data set, which
measure of variation do you think is more appropriate, the range or the standard
deviation? Explain your thinking.
Question
Question
Question
Provide an appropriate response.
Which boxplot shape (uniform, bell-shaped, or skewed)best matches the boxplot for the
first 100 digits of π? (Below is the frequency table for the first 100 digits of
Which boxplot shape (uniform, bell-shaped, or skewed)best matches the boxplot for the
first 100 digits of π? (Below is the frequency table for the first 100 digits of
Question
Question
Question
Question
Question
Provide an appropriate response.

Question
Question
Question
Question
Provide an appropriate response.
Discuss the differences between the distributions represented by the two boxplots below.
Assume the two boxplots have the same scale. Explain your reasoning.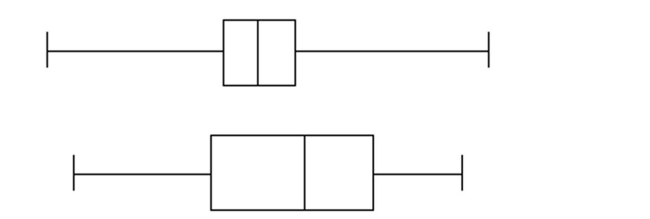
Discuss the differences between the distributions represented by the two boxplots below.
Assume the two boxplots have the same scale. Explain your reasoning.
Question
Question
Question
Question
Question
Question
Question
Question
Question
Question
Question
Provide an appropriate response.
A machine fills bottles with juice. The average amount filled in the bottles is 16 ounces;
however this amount varies slightly from bottle to bottle. The manufacturer is interested in
knowing how much the amount of juice varies from bottle to bottle. How could the
manufacturer obtain an estimate of the population standard deviation
Question
Provide an appropriate response.
The table below provides a frequency distribution for the winner of the Davis Cup during
the period 1977-1994.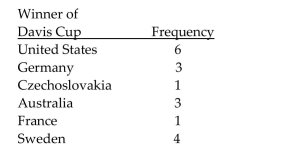 Which measure of center, the mean, the median, or the mode is most appropriate here?
Why?
The table below provides a frequency distribution for the winner of the Davis Cup during
the period 1977-1994.
Which measure of center, the mean, the median, or the mode is most appropriate here?Why?
Question
Provide an appropriate response.
Without calculating the standard deviation, compare the standard deviation for the
following data sets. (Note: All data sets have a mean of 30.)Which do you expect to have
the largest standard deviation and which do you expect to have the smallest standard
deviation? Explain your answers in terms of the formula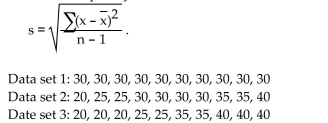
Question
Provide an appropriate response.
Roughly speaking, the standard deviation indicates how far, on average, the observations
are from the mean. Do you think that for the data set below the standard deviation will
give a good indication of the typical deviation from the mean?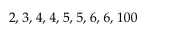 What drawback of the standard deviation is illustrated by this example?
Roughly speaking, the standard deviation indicates how far, on average, the observations
are from the mean. Do you think that for the data set below the standard deviation will
give a good indication of the typical deviation from the mean?
What drawback of the standard deviation is illustrated by this example? Question
Question
Question
Construct and interpret a boxplot or a modified boxplot as specified.
The ages of the 21 members of a track and field team are listed below. Construct a modified boxplot for the data.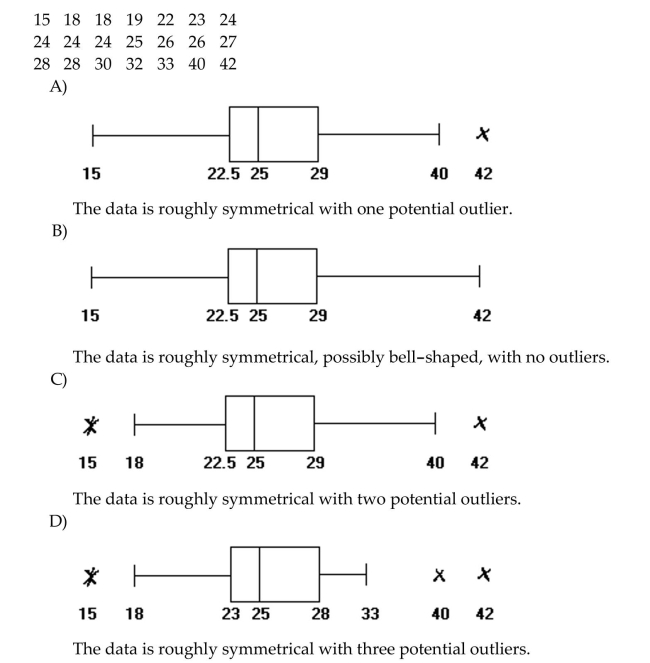
The ages of the 21 members of a track and field team are listed below. Construct a modified boxplot for the data.
Question
Question
Question
Provide an appropriate response.
Question
Question
Question
Find the sample standard deviation for the given data. Round your final answer to one more decimal place than that used
for the observations.
The normal monthly precipitation (in inches)for August is listed for 12 different U.S. cities.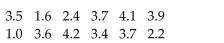
A)12.03 in.
B)1.05 in.
C)1.00 in.
D)1.09 in.
for the observations.
The normal monthly precipitation (in inches)for August is listed for 12 different U.S. cities.
A)12.03 in.
B)1.05 in.
C)1.00 in.
D)1.09 in.
Question
Provide an appropriate response.
Describe any similarities or differences in the two distributions represented by the
following boxplots. Assume the two boxplots have the same scale. Explain your reasoning.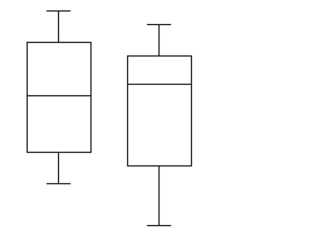
Describe any similarities or differences in the two distributions represented by the
following boxplots. Assume the two boxplots have the same scale. Explain your reasoning.
Question
Question
Question
Construct and interpret a boxplot or a modified boxplot as specified.
The test scores of 32 students are listed below. Construct a boxplot for the data.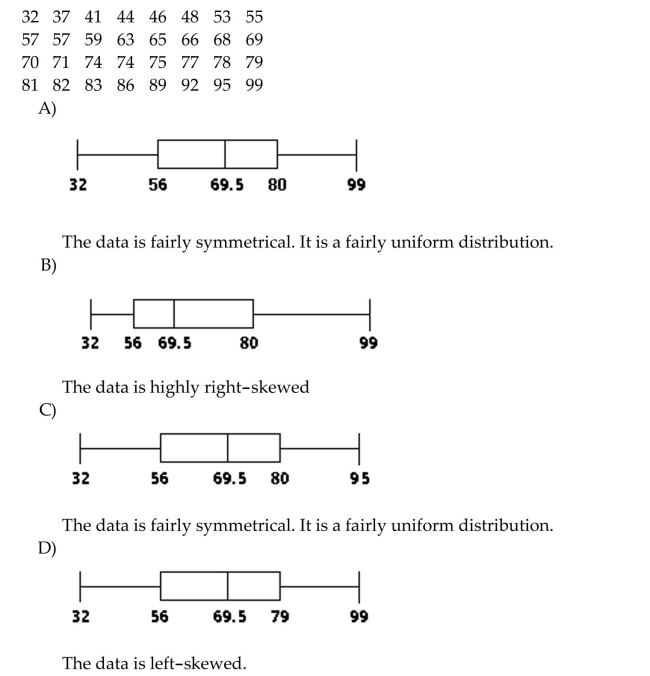
The test scores of 32 students are listed below. Construct a boxplot for the data.
Question
Find the sample standard deviation for the given data. Round your final answer to one more decimal place than that usedfor the observations.
The manager of an electrical supply store measured the diameters of the rolls of wire in the inventory. The diameters of the rolls (in m)are listed below.
The manager of an electrical supply store measured the diameters of the rolls of wire in the inventory. The diameters of the rolls (in m)are listed below.
Question
Find the mean for the given sample data. Unless otherwise specified, round your answer to one more decimal place thanthat used for the observations.
The normal monthly precipitation (in inches)for August is listed for 20 different U.S. cities. Find the mean of the data.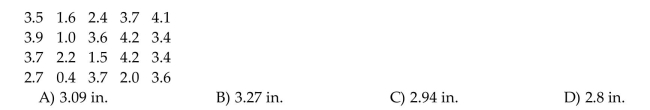
The normal monthly precipitation (in inches)for August is listed for 20 different U.S. cities. Find the mean of the data.
Question
Find the range for the given data set.
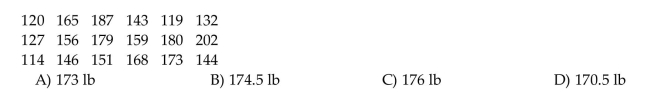
The weights, in pounds, of 18 randomly selected adults are given below.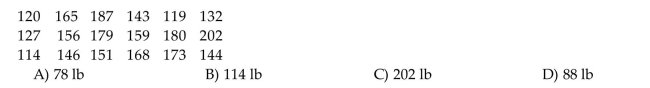
The weights, in pounds, of 18 randomly selected adults are given below.
Question
Find the range for the given data set.
The test scores of 19 students are listed below.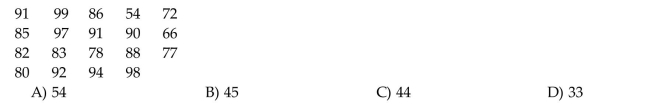
The test scores of 19 students are listed below.
Question
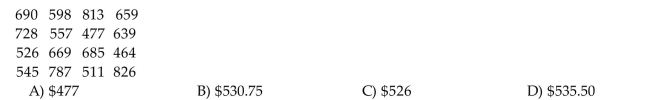
Identify potential outliers, if any, for the given data.
The weekly salaries (in dollars)of sixteen government workers are listed below.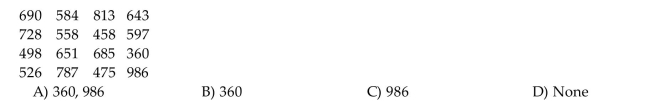
The weekly salaries (in dollars)of sixteen government workers are listed below.
Question
Question
Question
Determine the quartile or interquartile range as specified.
The weekly salaries (in dollars)of sixteen government workers are listed below. Find the third quartile,
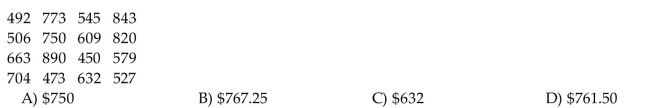
The weekly salaries (in dollars)of sixteen government workers are listed below. Find the third quartile,
Question
Find the mode(s)for the given sample data.

Question
Solve the problem.
Describe what these boxplots tell you about the relationship between the state you live in and your salary, based on the same occupation.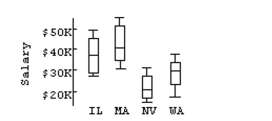
A)IL and MA have very comparable salaries. The average salaries for these states are just above $40K, and their variations are very close. NV is very comparable to IL and MA. The upper
50% of salaries for NV corresponds to the lower 50% of WA salaries.
B)IL and MA don't have very comparable salaries. The average salaries for these states are just below $40K, and their variations are different. NV is not very comparable to either IL or MA.
The upper 50% of salaries for WA corresponds to the lower 50% of NV salaries.
C)IL and MA have very comparable salaries. The average salaries for these states are just below $40K, but their variations are different. NV is not very comparable to either IL or MA. The
Upper 50% of salaries for NV corresponds to the lower 50% of WA salaries.
D)IL and MA have very comparable salaries. The average salaries for these states are just below $40K, and their variations are very close. NV is not very comparable to either IL or MA. The
Upper 50% of salaries for NV corresponds to the lower 50% of WA salaries.
Question
Question
Determine the quartile or interquartile range as specified.
The weights (in pounds)of 18 randomly selected adults are given below. Find the third quartile,
The weights (in pounds)of 18 randomly selected adults are given below. Find the third quartile,
Question
Solve the problem.
A variable x has the possible observations shown below.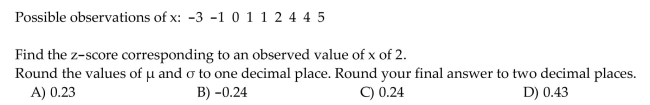
A variable x has the possible observations shown below.
Question
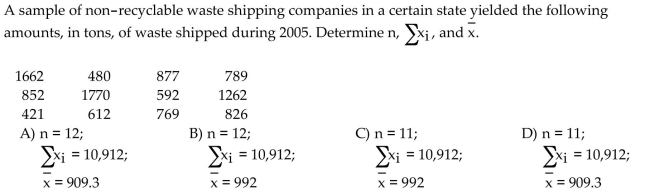
Provide an appropriate response.
The amount of money, in dollars, that an employee of a bank spent on lunch on six randomly selected days yielded the following data set:
The amount of money, in dollars, that an employee of a bank spent on lunch on six randomly selected days yielded the following data set:
Question
Provide an appropriate response.
The heights of a group of professional basketball players are summarized in the frequency distribution below. Find the standard deviation. Round your answer to one decimal place.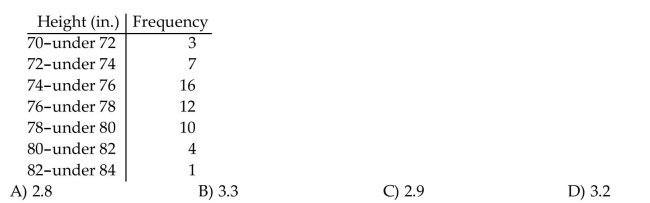
The heights of a group of professional basketball players are summarized in the frequency distribution below. Find the standard deviation. Round your answer to one decimal place.
Question
Obtain the five-number summary for the given data.
The weights (in pounds)of 18 randomly selected adults are given below.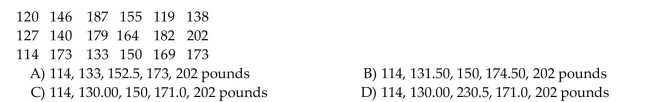
The weights (in pounds)of 18 randomly selected adults are given below.
Question
Provide an appropriate response.
Obtain the population standard deviation, Ϭ, for the given data. Assume that the data represent population data. Round your final answer to one more decimal place than that used for the
Observations.
The weekly salaries (in dollars)of seven government workers are listed below
Obtain the population standard deviation, Ϭ, for the given data. Assume that the data represent population data. Round your final answer to one more decimal place than that used for the
Observations.
The weekly salaries (in dollars)of seven government workers are listed below
Question
Solve the problem.
Do men and women run a 5 kilometer race at the same pace? Here are boxplots of the time (in minutes)for a race recently run in Chicago. Write a brief report discussing what these data show.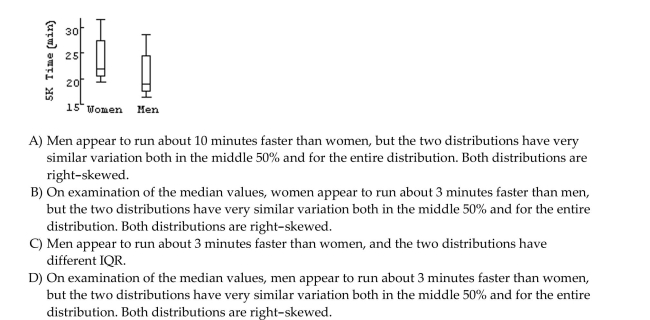
Do men and women run a 5 kilometer race at the same pace? Here are boxplots of the time (in minutes)for a race recently run in Chicago. Write a brief report discussing what these data show.
Question
Solve the problem.
Here are boxplots of the points scored during the first 10 games of the basketball season for both Caroline and Alexandra. Summarize the similarities and differences in their performance so far.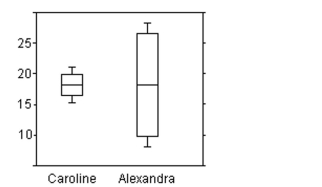
A)The girls have a different average score per game. Caroline is much more consistent, because her IQR is about 4 points, while Alexandra's is over 15. In other words, Alexandra has more
Variation in her scores than does Caroline. The distribution of scores for Caroline is
Symmetric, while the distribution of scores for Alexandra is left-skewed.
B)Both girls have a median score of about 18 points per game. Alexandra is much more consistent, because her IQR is about 15 points, while Caroline's is over 3. In other words,
Alexandra has less variation in her scores than does Caroline. The distribution of scores for
Both women is symmetric.
C)Both girls have a median score of about 18 points per game. Caroline is much more consistent, because her IQR is about 6 points, while Alexandra's is over 20. In other words, Alexandra
Has more variation in her scores than does Caroline. The distribution of scores for Caroline is
Right skewed, while the distribution of scores for Alexandra is bell-shaped.
D)Both girls have a median score of about 18 points per game. Caroline is much more consistent, because her IQR is about 4 points, while Alexandra's is over 15. In other words, Alexandra
Has more variation in her scores than does Caroline. The distribution of scores for both
Women is symmetric.
Question
Solve the problem.
A variable x has a mean, µ, of 22 and a standard deviation, Ϭ, of 7. Determine the standardized version of x.
A variable x has a mean, µ, of 22 and a standard deviation, Ϭ, of 7. Determine the standardized version of x.
Question
Question
Obtain the five-number summary for the given data.
The normal annual precipitation (in inches)is given below for 21 different U.S. cities.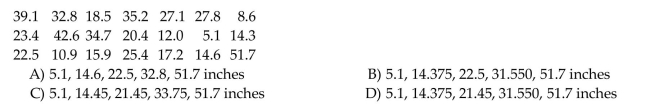
The normal annual precipitation (in inches)is given below for 21 different U.S. cities.
Question
Solve the problem. If necessary, round your answer to one more decimal place than that used for the observations.

Question
Construct and interpret a boxplot or a modified boxplot as specified.
The weights (in pounds)of 30 newborn babies are listed below. Construct a boxplot for the data.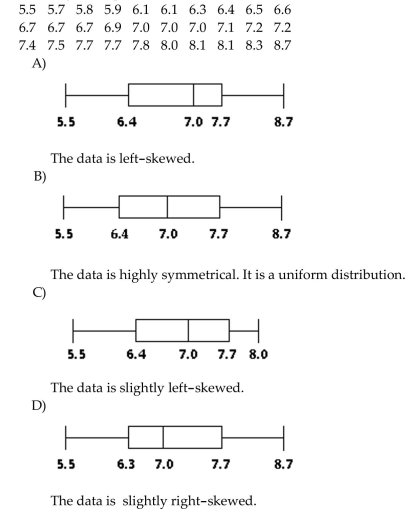
The weights (in pounds)of 30 newborn babies are listed below. Construct a boxplot for the data.
Question
Identify potential outliers, if any, for the given data.
The weekly salaries (in dollars)of 24 randomly selected employees of a company are shown below.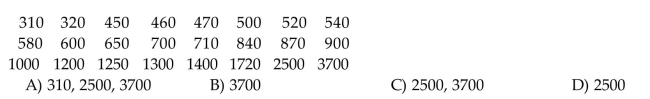
The weekly salaries (in dollars)of 24 randomly selected employees of a company are shown below.
Question
Provide an appropriate response.
Obtain the population standard deviation, Ϭ, for the given data. Assume that the data represent population data. Round your final answer to one more decimal place than that used for the
Observations.
The normal annual precipitation (in inches)is given below for 8 different U.S. cities.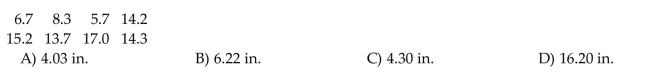
Obtain the population standard deviation, Ϭ, for the given data. Assume that the data represent population data. Round your final answer to one more decimal place than that used for the
Observations.
The normal annual precipitation (in inches)is given below for 8 different U.S. cities.
Question
Find the mode(s)for the given sample data.
The weights (in ounces)of 14 different apples are shown below.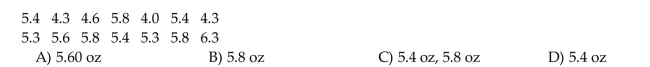
The weights (in ounces)of 14 different apples are shown below.
Question
Construct and interpret a boxplot or a modified boxplot as specified.
The test scores of 40 students are listed below. Construct a boxplot for the data.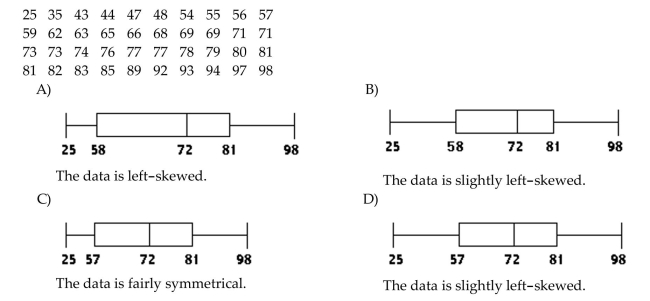
The test scores of 40 students are listed below. Construct a boxplot for the data.
Question
Find the median for the given sample data.
The number of vehicles passing through a bank drive-up line during each 15-minute period was recorded. The results are shown below.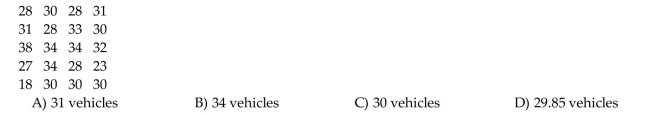
The number of vehicles passing through a bank drive-up line during each 15-minute period was recorded. The results are shown below.
Question
Solve the problem. If necessary, round your answer to one more decimal place than that used for the observations.
Question
Determine the quartile or interquartile range as specified.
The weekly salaries (in dollars)of sixteen government workers are listed below. Find the first quartile,
The weekly salaries (in dollars)of sixteen government workers are listed below. Find the first quartile,
Question
Find the sample standard deviation for the given data. Round your final answer to one more decimal place than that usedfor the observations.
To get the best deal on a CD player, Tom called eight appliance stores and asked the cost of a specific model. The prices he was quoted are listed below:
To get the best deal on a CD player, Tom called eight appliance stores and asked the cost of a specific model. The prices he was quoted are listed below:
Question
Identify potential outliers, if any, for the given data.
The normal monthly precipitation (in inches)for August is listed for 20 different U.S. cities.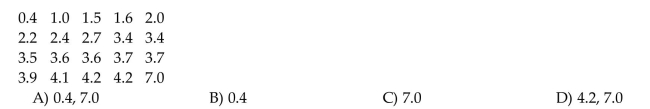
The normal monthly precipitation (in inches)for August is listed for 20 different U.S. cities.
Question
Question
Question
Identify potential outliers, if any, for the given data.
The normal annual precipitation (in inches)is given below for 21 different U.S. cities.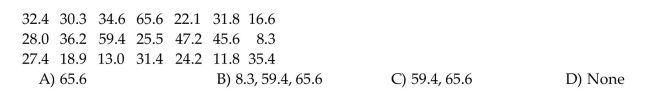
The normal annual precipitation (in inches)is given below for 21 different U.S. cities.
Question
Question
Question

Unlock Deck
Sign up to unlock the cards in this deck!
Unlock Deck
Unlock Deck
1/195
Play
Full screen (f)
Deck 3: Descriptive Measures
1
Provide an appropriate response.
The range and standard deviation of the data set below are 35 and 12.47 respectively. If the 26 is replaced with 39, how will this affect the range? How will this affect the
standard deviation. Use your answers to explain why the standard deviation is preferable
to the range as a measure of variation.
The range and standard deviation of the data set below are 35 and 12.47 respectively.
If the 26 is replaced with 39, how will this affect the range? How will this affect thestandard deviation. Use your answers to explain why the standard deviation is preferable
to the range as a measure of variation.
The range will be unaffected, while the
standard deviation will increase. The standard deviation is preferable as it takes all
observations into account while the range depends only on the smallest and largest
observations and disregards other observations.
standard deviation will increase. The standard deviation is preferable as it takes all
observations into account while the range depends only on the smallest and largest
observations and disregards other observations.
2
Provide an appropriate response.
The data set below consists of the scores of 15 students on a quiz. For this data set, which
measure of variation do you think is more appropriate, the range or the standard
deviation? Explain your thinking.
The data set below consists of the scores of 15 students on a quiz. For this data set, which
measure of variation do you think is more appropriate, the range or the standard
deviation? Explain your thinking.
For this data set, the range is very misleading. The range depends only on the
smallest and largest values and the remainder of the data contributes nothing to the
range. In this case, the smallest value is an outlier. Thus even though all the values
except one lie between 89 and 91, the range is 31. The standard deviation, while it
will also be affected by the outlier, will be less misleading, as it depends on every
piece of data.
3
Provide an appropriate response.
A teacher records the test scores for the 40 students in her class. Corresponding to each
score, she calculates a z-score. Julia's z-score is -2.8. Should she be concerned? Explain
your reasoning.
A teacher records the test scores for the 40 students in her class. Corresponding to each
score, she calculates a z-score. Julia's z-score is -2.8. Should she be concerned? Explain
your reasoning.
Yes. Almost all z-scores lie between -3 and 3 so
a z-score of -2.8 indicates that Julia's test score was lower than almost all of the
other scores.
a z-score of -2.8 indicates that Julia's test score was lower than almost all of the
other scores.
4
Provide an appropriate response.
Explain the difference between the interquartile range and the range. Which is more
sensitive to extreme values? Explain your thinking.
Explain the difference between the interquartile range and the range. Which is more
sensitive to extreme values? Explain your thinking.
Unlock Deck
Unlock for access to all 195 flashcards in this deck.
Unlock Deck
k this deck
5
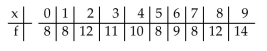
Provide an appropriate response.
Which boxplot shape (uniform, bell-shaped, or skewed)best matches the boxplot for the
first 100 digits of π? (Below is the frequency table for the first 100 digits of
Which boxplot shape (uniform, bell-shaped, or skewed)best matches the boxplot for the
first 100 digits of π? (Below is the frequency table for the first 100 digits of
Unlock Deck
Unlock for access to all 195 flashcards in this deck.
Unlock Deck
k this deck
6
Provide an appropriate response.
A census bureau collects information about the household income (total income of
everyone living in one residence)of people in a certain country.
(i)Identify the variable and population under consideration.
(ii)By consulting the most recent census data, it was found that the mean household
income of all residents in the country is $35,352. Decide whether this descriptive measure
is a parameter or a statistic and use the correct notation to express the result.
Unlock Deck
Unlock for access to all 195 flashcards in this deck.
Unlock Deck
k this deck
7
Provide an appropriate response.
Dave is a college student contemplating a possible career option. One factor that will
influence his decision is the amount of money he is likely to make. He decides to look up
the average starting salary of graduates in that profession. Which information would be
most useful to him, the mean starting salary, the median starting salary, or the mode of the
starting salaries? Why?
Unlock Deck
Unlock for access to all 195 flashcards in this deck.
Unlock Deck
k this deck
8
Provide an appropriate response.
A data set has a mean of 100 and a standard deviation of 12. Using Chebychev's rule, what
can you say about the percentage of observations lying between 64 and 136? Using the
empirical rule, what can you say about the percentage of observations lying between 64
and 136? What assumption is required to use the empirical rule?
Unlock Deck
Unlock for access to all 195 flashcards in this deck.
Unlock Deck
k this deck
9
Provide an appropriate response.
Draw one boxplot to illustrate bell-shaped data, another for uniform data, and a third for
skewed data.
Draw one boxplot to illustrate bell-shaped data, another for uniform data, and a third for
skewed data.
Unlock Deck
Unlock for access to all 195 flashcards in this deck.
Unlock Deck
k this deck
10
Provide an appropriate response.
Unlock Deck
Unlock for access to all 195 flashcards in this deck.
Unlock Deck
k this deck
11
Provide an appropriate response.
The two most frequently used measures of central tendency are the mean and the median.
Compare these two measures for the following characteristics: Takes every score into
account? Affected by extreme scores? Advantages.
The two most frequently used measures of central tendency are the mean and the median.
Compare these two measures for the following characteristics: Takes every score into
account? Affected by extreme scores? Advantages.
Unlock Deck
Unlock for access to all 195 flashcards in this deck.
Unlock Deck
k this deck
12
Provide an appropriate response.
Explain how to find the adjacent values when constructing a modified boxplot. When are
the adjacent values equal to the minimum and maximum observations?
Explain how to find the adjacent values when constructing a modified boxplot. When are
the adjacent values equal to the minimum and maximum observations?
Unlock Deck
Unlock for access to all 195 flashcards in this deck.
Unlock Deck
k this deck
13
Provide an appropriate response.
We want to compare two different groups of students, students taking Composition 1 in a
traditional lecture format and students taking Composition 1 in a distance learning format.
We know that the mean score on the research paper is 85 for both groups. What additional
information would be provided by knowing the standard deviation?
Unlock Deck
Unlock for access to all 195 flashcards in this deck.
Unlock Deck
k this deck
14
Provide an appropriate response.
Discuss the differences between the distributions represented by the two boxplots below.
Assume the two boxplots have the same scale. Explain your reasoning.
Discuss the differences between the distributions represented by the two boxplots below.
Assume the two boxplots have the same scale. Explain your reasoning.
Unlock Deck
Unlock for access to all 195 flashcards in this deck.
Unlock Deck
k this deck
15
Provide an appropriate response.
A machine fills bottles with juice. The average amount filled in the bottles is 16 ounces;
however this amount varies slightly from bottle to bottle. The manufacturer is interested in
knowing how much the amount of juice varies from bottle to bottle. In this context, what is
the population of interest and what does Ϭ represent?
Unlock Deck
Unlock for access to all 195 flashcards in this deck.
Unlock Deck
k this deck
16
Provide an appropriate response.
Explain in your own words the difference between a parameter and a statistic. Give
examples of two statistics and two parameters.
Explain in your own words the difference between a parameter and a statistic. Give
examples of two statistics and two parameters.
Unlock Deck
Unlock for access to all 195 flashcards in this deck.
Unlock Deck
k this deck
17
Provide an appropriate response.
Heights of adult women are known to have a bell-shaped distribution. Draw a boxplot to
illustrate the results.
Heights of adult women are known to have a bell-shaped distribution. Draw a boxplot to
illustrate the results.
Unlock Deck
Unlock for access to all 195 flashcards in this deck.
Unlock Deck
k this deck
18
Provide an appropriate response.
Suppose that a state introduces a state income tax which will be at a flat rate of 3%. The
state legislature wishes to estimate how much money they will receive in taxes, and to do
this they need to know the average income of residents of the state. Which information
would be most useful, the mean income, the median income, or the mode of the incomes?
Why?
Unlock Deck
Unlock for access to all 195 flashcards in this deck.
Unlock Deck
k this deck
19
Provide an appropriate response.
In Mary's first math test she scored 87%. The mean and standard deviation for the class
were 71% and 18% respectively. In her second math test, Mary scored 66%. The mean and
standard deviation for the class were 53% and 14% respectively. In which test did Mary do
better relative to the rest of the class? Explain your reasoning. (Hint: find the z-scores
corresponding to her two test scores.)
Unlock Deck
Unlock for access to all 195 flashcards in this deck.
Unlock Deck
k this deck
20
Provide an appropriate response.
Fill in the blank. If both the sample standard deviation, s, and the population standard
deviation, Ϭ, are computed for the same data set, they will tend to be closer together if the
data set is ___________.
Fill in the blank. If both the sample standard deviation, s, and the population standard
deviation, Ϭ, are computed for the same data set, they will tend to be closer together if the
data set is ___________.
Unlock Deck
Unlock for access to all 195 flashcards in this deck.
Unlock Deck
k this deck
21
Provide an appropriate response.
A teacher records the test scores for the 30 students in her class. Corresponding to each
score, she calculates a z-score. If you were the parents of a girl in the class, would you be
more interested in knowing your daughter's test score or z-score? Explain your reasoning.
A teacher records the test scores for the 30 students in her class. Corresponding to each
score, she calculates a z-score. If you were the parents of a girl in the class, would you be
more interested in knowing your daughter's test score or z-score? Explain your reasoning.
Unlock Deck
Unlock for access to all 195 flashcards in this deck.
Unlock Deck
k this deck
22
Provide an appropriate response.
Do you think it is possible to find two data sets such that the first data set has a smaller
range but a larger standard deviation than the second set? If so, give an example of two
such data sets. If it is not possible, explain why not.
Do you think it is possible to find two data sets such that the first data set has a smaller
range but a larger standard deviation than the second set? If so, give an example of two
such data sets. If it is not possible, explain why not.
Unlock Deck
Unlock for access to all 195 flashcards in this deck.
Unlock Deck
k this deck
23
Provide an appropriate response.
In the Florida lottery, the numbers (between 1 and 49)are generated randomly with the
expectation that each number has an equal chance of winning. Draw a boxplot which
should illustrate the data set of all numbers picked for the lottery during the past year.
In the Florida lottery, the numbers (between 1 and 49)are generated randomly with the
expectation that each number has an equal chance of winning. Draw a boxplot which
should illustrate the data set of all numbers picked for the lottery during the past year.
Unlock Deck
Unlock for access to all 195 flashcards in this deck.
Unlock Deck
k this deck
24
Provide an appropriate response.
Explain how two data sets could have equal means and modes but still differ greatly. Give
an example with two data sets to illustrate.
Explain how two data sets could have equal means and modes but still differ greatly. Give
an example with two data sets to illustrate.
Unlock Deck
Unlock for access to all 195 flashcards in this deck.
Unlock Deck
k this deck
25
Provide an appropriate response.
A machine fills bottles with juice. The average amount filled in the bottles is 16 ounces;
however this amount varies slightly from bottle to bottle. The manufacturer is interested in
knowing how much the amount of juice varies from bottle to bottle. How could the
manufacturer obtain an estimate of the population standard deviation
Unlock Deck
Unlock for access to all 195 flashcards in this deck.
Unlock Deck
k this deck
26
Provide an appropriate response.
The table below provides a frequency distribution for the winner of the Davis Cup during
the period 1977-1994. Which measure of center, the mean, the median, or the mode is most appropriate here?
Why?
The table below provides a frequency distribution for the winner of the Davis Cup during
the period 1977-1994.
Which measure of center, the mean, the median, or the mode is most appropriate here?Why?
Unlock Deck
Unlock for access to all 195 flashcards in this deck.
Unlock Deck
k this deck
27
Provide an appropriate response.
Without calculating the standard deviation, compare the standard deviation for the
following data sets. (Note: All data sets have a mean of 30.)Which do you expect to have
the largest standard deviation and which do you expect to have the smallest standard
deviation? Explain your answers in terms of the formula
Unlock Deck
Unlock for access to all 195 flashcards in this deck.
Unlock Deck
k this deck
28
Provide an appropriate response.
Roughly speaking, the standard deviation indicates how far, on average, the observations
are from the mean. Do you think that for the data set below the standard deviation will
give a good indication of the typical deviation from the mean? What drawback of the standard deviation is illustrated by this example?
Roughly speaking, the standard deviation indicates how far, on average, the observations
are from the mean. Do you think that for the data set below the standard deviation will
give a good indication of the typical deviation from the mean?
What drawback of the standard deviation is illustrated by this example? Unlock Deck
Unlock for access to all 195 flashcards in this deck.
Unlock Deck
k this deck
29
Provide an appropriate response.
Can the sample variance ever be a negative number? If so, for what types of data? If not,
why not? Can the sample variance ever be zero? If so, for what types of data? If not, why
not? Explain your reasoning.
Can the sample variance ever be a negative number? If so, for what types of data? If not,
why not? Can the sample variance ever be zero? If so, for what types of data? If not, why
not? Explain your reasoning.
Unlock Deck
Unlock for access to all 195 flashcards in this deck.
Unlock Deck
k this deck
30
Provide an appropriate response.
When finding the 5-number summary, it becomes easy to identify the outliers of a data set.
Under what conditions should outliers be deleted, and when should they be further
investigated?
When finding the 5-number summary, it becomes easy to identify the outliers of a data set.
Under what conditions should outliers be deleted, and when should they be further
investigated?
Unlock Deck
Unlock for access to all 195 flashcards in this deck.
Unlock Deck
k this deck
31
Construct and interpret a boxplot or a modified boxplot as specified.
The ages of the 21 members of a track and field team are listed below. Construct a modified boxplot for the data.
The ages of the 21 members of a track and field team are listed below. Construct a modified boxplot for the data.
Unlock Deck
Unlock for access to all 195 flashcards in this deck.
Unlock Deck
k this deck
32
Provide an appropriate response.
Does the mode of a data set always lie near the center? Explain your answer and give an
example of a data set to illustrate your answer.
Does the mode of a data set always lie near the center? Explain your answer and give an
example of a data set to illustrate your answer.
Unlock Deck
Unlock for access to all 195 flashcards in this deck.
Unlock Deck
k this deck
33
Provide an appropriate response.
A company advertises an average of 42,000 miles for one of its new tires. In the
manufacturing process there is some variation around that average. Would the company
want a process that provides a large or a small variance? Justify your answer.
A company advertises an average of 42,000 miles for one of its new tires. In the
manufacturing process there is some variation around that average. Would the company
want a process that provides a large or a small variance? Justify your answer.
Unlock Deck
Unlock for access to all 195 flashcards in this deck.
Unlock Deck
k this deck
34
Provide an appropriate response.
Unlock Deck
Unlock for access to all 195 flashcards in this deck.
Unlock Deck
k this deck
35
Provide an appropriate response.
The median of a data set is always/sometimes/never (select one)one of the data points in a
set of data. Explain your answer with brief examples.
The median of a data set is always/sometimes/never (select one)one of the data points in a
set of data. Explain your answer with brief examples.
Unlock Deck
Unlock for access to all 195 flashcards in this deck.
Unlock Deck
k this deck
36
Provide an appropriate response.
A group of medical researchers is interested in knowing the mean cholesterol level for all
men in the U.S. aged between 70 and 80. They pick a sample of 5,000 men and measure
their cholesterol levels. They then calculate the mean and standard deviation of these
cholesterol levels. Do the mean and standard deviation obtained in this way represent
parameters or statistics? Why? What symbols could you use to denote the mean and
standard deviation of the 5,000 cholesterol levels?
Unlock Deck
Unlock for access to all 195 flashcards in this deck.
Unlock Deck
k this deck
37
Find the sample standard deviation for the given data. Round your final answer to one more decimal place than that used
for the observations.
The normal monthly precipitation (in inches)for August is listed for 12 different U.S. cities.
A)12.03 in.
B)1.05 in.
C)1.00 in.
D)1.09 in.
for the observations.
The normal monthly precipitation (in inches)for August is listed for 12 different U.S. cities.
A)12.03 in.
B)1.05 in.
C)1.00 in.
D)1.09 in.
Unlock Deck
Unlock for access to all 195 flashcards in this deck.
Unlock Deck
k this deck
38
Provide an appropriate response.
Describe any similarities or differences in the two distributions represented by the
following boxplots. Assume the two boxplots have the same scale. Explain your reasoning.
Describe any similarities or differences in the two distributions represented by the
following boxplots. Assume the two boxplots have the same scale. Explain your reasoning.
Unlock Deck
Unlock for access to all 195 flashcards in this deck.
Unlock Deck
k this deck
39
Provide an appropriate response.
A population consists of 100 professional gymnasts and 100 professional basketball
players. For this group, the average height is 70 inches. However, most of the gymnasts are
between 57 and 61 inches tall while most of the basketball players are between 78 and 82
inches tall. For this group, observations far from the mean are more common than
observations close to the mean. Describe what a boxplot for the heights of this group
would look like. Discuss, in particular, the lengths of the whiskers relative to the width of
the box and explain your reasoning.
Unlock Deck
Unlock for access to all 195 flashcards in this deck.
Unlock Deck
k this deck
40
Provide an appropriate response.
For a particular population, the _____________ mean is a constant and the ____________
mean is a variable.
For a particular population, the _____________ mean is a constant and the ____________
mean is a variable.
Unlock Deck
Unlock for access to all 195 flashcards in this deck.
Unlock Deck
k this deck
41
Construct and interpret a boxplot or a modified boxplot as specified.
The test scores of 32 students are listed below. Construct a boxplot for the data.
The test scores of 32 students are listed below. Construct a boxplot for the data.
Unlock Deck
Unlock for access to all 195 flashcards in this deck.
Unlock Deck
k this deck
42
Find the sample standard deviation for the given data. Round your final answer to one more decimal place than that usedfor the observations.
The manager of an electrical supply store measured the diameters of the rolls of wire in the inventory. The diameters of the rolls (in m)are listed below.
The manager of an electrical supply store measured the diameters of the rolls of wire in the inventory. The diameters of the rolls (in m)are listed below.
Unlock Deck
Unlock for access to all 195 flashcards in this deck.
Unlock Deck
k this deck
43
Find the mean for the given sample data. Unless otherwise specified, round your answer to one more decimal place thanthat used for the observations.
The normal monthly precipitation (in inches)for August is listed for 20 different U.S. cities. Find the mean of the data.
The normal monthly precipitation (in inches)for August is listed for 20 different U.S. cities. Find the mean of the data.
Unlock Deck
Unlock for access to all 195 flashcards in this deck.
Unlock Deck
k this deck
44
Find the range for the given data set.
The weights, in pounds, of 18 randomly selected adults are given below.
The weights, in pounds, of 18 randomly selected adults are given below.
Unlock Deck
Unlock for access to all 195 flashcards in this deck.
Unlock Deck
k this deck
45
Find the range for the given data set.
The test scores of 19 students are listed below.
The test scores of 19 students are listed below.
Unlock Deck
Unlock for access to all 195 flashcards in this deck.
Unlock Deck
k this deck
46
Identify potential outliers, if any, for the given data.
The weekly salaries (in dollars)of sixteen government workers are listed below.
The weekly salaries (in dollars)of sixteen government workers are listed below.
Unlock Deck
Unlock for access to all 195 flashcards in this deck.
Unlock Deck
k this deck
47
Provide an appropriate response.
Find the z-score corresponding to the given value and use the z-score to determine whether the value is unusual. Consider a score to be unusual if it is at least three standard deviations above or
Below the mean. Round the z-score to one decimal place, if necessary.
A test score of 93.4 on a test having a mean of 73 and a standard deviation of 12.
A)1.7; not unusual
B)-1.7; not unusual
C)1.7; unusual
D)20.4; unusual
Unlock Deck
Unlock for access to all 195 flashcards in this deck.
Unlock Deck
k this deck
48
Find the range for the given data set.
6, 18, 1, 14, 10
A)4
B)17
C)18
D)1
6, 18, 1, 14, 10
A)4
B)17
C)18
D)1
Unlock Deck
Unlock for access to all 195 flashcards in this deck.
Unlock Deck
k this deck
49
Determine the quartile or interquartile range as specified.
The weekly salaries (in dollars)of sixteen government workers are listed below. Find the third quartile,
The weekly salaries (in dollars)of sixteen government workers are listed below. Find the third quartile,
Unlock Deck
Unlock for access to all 195 flashcards in this deck.
Unlock Deck
k this deck
50
Find the mode(s)for the given sample data.
Unlock Deck
Unlock for access to all 195 flashcards in this deck.
Unlock Deck
k this deck
51
Solve the problem.
Describe what these boxplots tell you about the relationship between the state you live in and your salary, based on the same occupation.
A)IL and MA have very comparable salaries. The average salaries for these states are just above $40K, and their variations are very close. NV is very comparable to IL and MA. The upper
50% of salaries for NV corresponds to the lower 50% of WA salaries.
B)IL and MA don't have very comparable salaries. The average salaries for these states are just below $40K, and their variations are different. NV is not very comparable to either IL or MA.
The upper 50% of salaries for WA corresponds to the lower 50% of NV salaries.
C)IL and MA have very comparable salaries. The average salaries for these states are just below $40K, but their variations are different. NV is not very comparable to either IL or MA. The
Upper 50% of salaries for NV corresponds to the lower 50% of WA salaries.
D)IL and MA have very comparable salaries. The average salaries for these states are just below $40K, and their variations are very close. NV is not very comparable to either IL or MA. The
Upper 50% of salaries for NV corresponds to the lower 50% of WA salaries.
Unlock Deck
Unlock for access to all 195 flashcards in this deck.
Unlock Deck
k this deck
52
Find the mean for the given sample data. Unless otherwise specified, round your answer to one more decimal place thanthat used for the observations.
Six college students spent $296.36, $205.42, $178.74, $263.73, $267.15, and $153.80 respectively for books. Compute the mean amount spent. Round your answer to the nearest cent.
A)$261.04
B)$273.04
C)$227.53
D)$341.30
Six college students spent $296.36, $205.42, $178.74, $263.73, $267.15, and $153.80 respectively for books. Compute the mean amount spent. Round your answer to the nearest cent.
A)$261.04
B)$273.04
C)$227.53
D)$341.30
Unlock Deck
Unlock for access to all 195 flashcards in this deck.
Unlock Deck
k this deck
53
Determine the quartile or interquartile range as specified.
The weights (in pounds)of 18 randomly selected adults are given below. Find the third quartile,
The weights (in pounds)of 18 randomly selected adults are given below. Find the third quartile,
Unlock Deck
Unlock for access to all 195 flashcards in this deck.
Unlock Deck
k this deck
54
Solve the problem.
A variable x has the possible observations shown below.
A variable x has the possible observations shown below.
Unlock Deck
Unlock for access to all 195 flashcards in this deck.
Unlock Deck
k this deck
55
Provide an appropriate response.
The amount of money, in dollars, that an employee of a bank spent on lunch on six randomly selected days yielded the following data set:
The amount of money, in dollars, that an employee of a bank spent on lunch on six randomly selected days yielded the following data set:
Unlock Deck
Unlock for access to all 195 flashcards in this deck.
Unlock Deck
k this deck
56
Provide an appropriate response.
The heights of a group of professional basketball players are summarized in the frequency distribution below. Find the standard deviation. Round your answer to one decimal place.
The heights of a group of professional basketball players are summarized in the frequency distribution below. Find the standard deviation. Round your answer to one decimal place.
Unlock Deck
Unlock for access to all 195 flashcards in this deck.
Unlock Deck
k this deck
57
Obtain the five-number summary for the given data.
The weights (in pounds)of 18 randomly selected adults are given below.
The weights (in pounds)of 18 randomly selected adults are given below.
Unlock Deck
Unlock for access to all 195 flashcards in this deck.
Unlock Deck
k this deck
58
Provide an appropriate response.
Obtain the population standard deviation, Ϭ, for the given data. Assume that the data represent population data. Round your final answer to one more decimal place than that used for the
Observations.
The weekly salaries (in dollars)of seven government workers are listed below
Obtain the population standard deviation, Ϭ, for the given data. Assume that the data represent population data. Round your final answer to one more decimal place than that used for the
Observations.
The weekly salaries (in dollars)of seven government workers are listed below
Unlock Deck
Unlock for access to all 195 flashcards in this deck.
Unlock Deck
k this deck
59
Solve the problem.
Do men and women run a 5 kilometer race at the same pace? Here are boxplots of the time (in minutes)for a race recently run in Chicago. Write a brief report discussing what these data show.
Do men and women run a 5 kilometer race at the same pace? Here are boxplots of the time (in minutes)for a race recently run in Chicago. Write a brief report discussing what these data show.
Unlock Deck
Unlock for access to all 195 flashcards in this deck.
Unlock Deck
k this deck
60
Solve the problem.
Here are boxplots of the points scored during the first 10 games of the basketball season for both Caroline and Alexandra. Summarize the similarities and differences in their performance so far.
A)The girls have a different average score per game. Caroline is much more consistent, because her IQR is about 4 points, while Alexandra's is over 15. In other words, Alexandra has more
Variation in her scores than does Caroline. The distribution of scores for Caroline is
Symmetric, while the distribution of scores for Alexandra is left-skewed.
B)Both girls have a median score of about 18 points per game. Alexandra is much more consistent, because her IQR is about 15 points, while Caroline's is over 3. In other words,
Alexandra has less variation in her scores than does Caroline. The distribution of scores for
Both women is symmetric.
C)Both girls have a median score of about 18 points per game. Caroline is much more consistent, because her IQR is about 6 points, while Alexandra's is over 20. In other words, Alexandra
Has more variation in her scores than does Caroline. The distribution of scores for Caroline is
Right skewed, while the distribution of scores for Alexandra is bell-shaped.
D)Both girls have a median score of about 18 points per game. Caroline is much more consistent, because her IQR is about 4 points, while Alexandra's is over 15. In other words, Alexandra
Has more variation in her scores than does Caroline. The distribution of scores for both
Women is symmetric.
Unlock Deck
Unlock for access to all 195 flashcards in this deck.
Unlock Deck
k this deck
61
Solve the problem.
A variable x has a mean, µ, of 22 and a standard deviation, Ϭ, of 7. Determine the standardized version of x.
A variable x has a mean, µ, of 22 and a standard deviation, Ϭ, of 7. Determine the standardized version of x.
Unlock Deck
Unlock for access to all 195 flashcards in this deck.
Unlock Deck
k this deck
62
Find the median for the given sample data.
6, 7, 23, 21, 30, 46
A)22.5
B)21
C)23
D)22
6, 7, 23, 21, 30, 46
A)22.5
B)21
C)23
D)22
Unlock Deck
Unlock for access to all 195 flashcards in this deck.
Unlock Deck
k this deck
63
Obtain the five-number summary for the given data.
The normal annual precipitation (in inches)is given below for 21 different U.S. cities.
The normal annual precipitation (in inches)is given below for 21 different U.S. cities.
Unlock Deck
Unlock for access to all 195 flashcards in this deck.
Unlock Deck
k this deck
64
Solve the problem. If necessary, round your answer to one more decimal place than that used for the observations.
Unlock Deck
Unlock for access to all 195 flashcards in this deck.
Unlock Deck
k this deck
65
Construct and interpret a boxplot or a modified boxplot as specified.
The weights (in pounds)of 30 newborn babies are listed below. Construct a boxplot for the data.
The weights (in pounds)of 30 newborn babies are listed below. Construct a boxplot for the data.
Unlock Deck
Unlock for access to all 195 flashcards in this deck.
Unlock Deck
k this deck
66
Identify potential outliers, if any, for the given data.
The weekly salaries (in dollars)of 24 randomly selected employees of a company are shown below.
The weekly salaries (in dollars)of 24 randomly selected employees of a company are shown below.
Unlock Deck
Unlock for access to all 195 flashcards in this deck.
Unlock Deck
k this deck
67
Provide an appropriate response.
Obtain the population standard deviation, Ϭ, for the given data. Assume that the data represent population data. Round your final answer to one more decimal place than that used for the
Observations.
The normal annual precipitation (in inches)is given below for 8 different U.S. cities.
Obtain the population standard deviation, Ϭ, for the given data. Assume that the data represent population data. Round your final answer to one more decimal place than that used for the
Observations.
The normal annual precipitation (in inches)is given below for 8 different U.S. cities.
Unlock Deck
Unlock for access to all 195 flashcards in this deck.
Unlock Deck
k this deck
68
Find the mode(s)for the given sample data.
The weights (in ounces)of 14 different apples are shown below.
The weights (in ounces)of 14 different apples are shown below.
Unlock Deck
Unlock for access to all 195 flashcards in this deck.
Unlock Deck
k this deck
69
Construct and interpret a boxplot or a modified boxplot as specified.
The test scores of 40 students are listed below. Construct a boxplot for the data.
The test scores of 40 students are listed below. Construct a boxplot for the data.
Unlock Deck
Unlock for access to all 195 flashcards in this deck.
Unlock Deck
k this deck
70
Find the median for the given sample data.
The number of vehicles passing through a bank drive-up line during each 15-minute period was recorded. The results are shown below.
The number of vehicles passing through a bank drive-up line during each 15-minute period was recorded. The results are shown below.
Unlock Deck
Unlock for access to all 195 flashcards in this deck.
Unlock Deck
k this deck
71
Solve the problem. If necessary, round your answer to one more decimal place than that used for the observations.
Unlock Deck
Unlock for access to all 195 flashcards in this deck.
Unlock Deck
k this deck
72
Determine the quartile or interquartile range as specified.
The weekly salaries (in dollars)of sixteen government workers are listed below. Find the first quartile,
The weekly salaries (in dollars)of sixteen government workers are listed below. Find the first quartile,
Unlock Deck
Unlock for access to all 195 flashcards in this deck.
Unlock Deck
k this deck
73
Find the sample standard deviation for the given data. Round your final answer to one more decimal place than that usedfor the observations.
To get the best deal on a CD player, Tom called eight appliance stores and asked the cost of a specific model. The prices he was quoted are listed below:
To get the best deal on a CD player, Tom called eight appliance stores and asked the cost of a specific model. The prices he was quoted are listed below:
Unlock Deck
Unlock for access to all 195 flashcards in this deck.
Unlock Deck
k this deck
74
Identify potential outliers, if any, for the given data.
The normal monthly precipitation (in inches)for August is listed for 20 different U.S. cities.
The normal monthly precipitation (in inches)for August is listed for 20 different U.S. cities.
Unlock Deck
Unlock for access to all 195 flashcards in this deck.
Unlock Deck
k this deck
75
Use the empirical rule to solve the problem.
The amount of Jen's monthly phone bill has a roughly bell-shaped distribution with a mean of $57 and a standard deviation of $9. What percentage of her phone bills are between $30 and $84?
A)99.7%
B)95%
C)99.99%
D)68%
The amount of Jen's monthly phone bill has a roughly bell-shaped distribution with a mean of $57 and a standard deviation of $9. What percentage of her phone bills are between $30 and $84?
A)99.7%
B)95%
C)99.99%
D)68%
Unlock Deck
Unlock for access to all 195 flashcards in this deck.
Unlock Deck
k this deck
76
Obtain the five-number summary for the given data.
2, 3, 5, 8, 10
A)2, 3.5, 5, 8.5, 10
B)2, 3, 5, 8, 10
C)2, 2.5, 5, 7.5, 10
D)2, 2, 5, 10, 10
2, 3, 5, 8, 10
A)2, 3.5, 5, 8.5, 10
B)2, 3, 5, 8, 10
C)2, 2.5, 5, 7.5, 10
D)2, 2, 5, 10, 10
Unlock Deck
Unlock for access to all 195 flashcards in this deck.
Unlock Deck
k this deck
77
Identify potential outliers, if any, for the given data.
The normal annual precipitation (in inches)is given below for 21 different U.S. cities.
The normal annual precipitation (in inches)is given below for 21 different U.S. cities.
Unlock Deck
Unlock for access to all 195 flashcards in this deck.
Unlock Deck
k this deck
78
Find the range for the given data set.
Rich Borne is currently taking Chemistry 101. On the five laboratory assignments for the quarter, he got the following scores.
21 35 20 48 58
A)38
B)14
C)58
D)20
Rich Borne is currently taking Chemistry 101. On the five laboratory assignments for the quarter, he got the following scores.
21 35 20 48 58
A)38
B)14
C)58
D)20
Unlock Deck
Unlock for access to all 195 flashcards in this deck.
Unlock Deck
k this deck
79
Solve the problem.
The mean of a set of data is 1.26 and its standard deviation is 3.81. Find the z-score for a value of 3.97.
Round your final answer to two decimal places.
A)0.78
B)1.01
C)0.64
D)0.71
The mean of a set of data is 1.26 and its standard deviation is 3.81. Find the z-score for a value of 3.97.
Round your final answer to two decimal places.
A)0.78
B)1.01
C)0.64
D)0.71
Unlock Deck
Unlock for access to all 195 flashcards in this deck.
Unlock Deck
k this deck
80
Provide an appropriate response.
Find the z-score corresponding to the given value and use the z-score to determine whether the value is unusual. Consider a score to be unusual if it is at least three standard deviations above or
Below the mean. Round to the z-score to two decimal places, if necessary.
A department store, on average, has daily sales of $29,016.01. The standard deviation of sales is $
1500. On Tuesday, the store sold $35,503.73 worth of goods.
A)4.54, not unusual
B)4.33, unusual
C)4.64, unusual
D)3.46, not unusual
Unlock Deck
Unlock for access to all 195 flashcards in this deck.
Unlock Deck
k this deck
Unlock Deck
Unlock for access to all 195 flashcards in this deck.


