Deck 10: Inferences for Two Population Means
Full screen (f)
Question
Determine the null and alternative hypotheses for the proposed hypothesis test.
A company which designs sports shoes has made an improvement to their popular running shoe. They hope that athletes wearing the new running shoe will be able to run faster over short
Distances. They will use a paired sample to determine whether the mean time to run 100 meters for
Sprinters wearing the new running shoe is less than the mean time to run the 100 meters for
Sprinters wearing the old running shoe.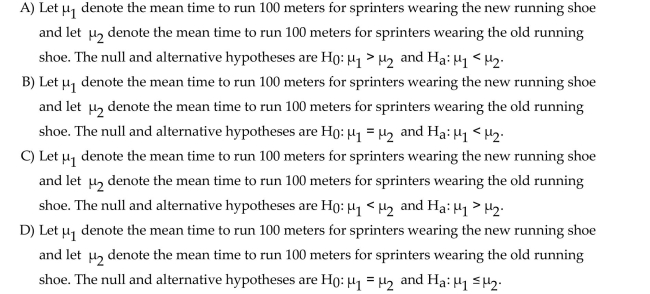
Question
Question
Preliminary data analyses indicates that use of a paired Wilcoxon signed-rank test is reasonable. Perform the hypothesistest by using a paired Wilcoxon signed-rank test. Assume that the null hypothesis is 
Students are given scores on both the mathematics section and the verbal section of a
standardized test. The data for a random sample of students is given below. At the 5% significance level, do the data provide sufficient evidence to conclude that there
is a difference between the mean math score and the mean verbal score?
Students are given scores on both the mathematics section and the verbal section of a
standardized test. The data for a random sample of students is given below.
At the 5% significance level, do the data provide sufficient evidence to conclude that thereis a difference between the mean math score and the mean verbal score?
Question
Perform the required hypothesis test by using a Mann-Whitney test. Use a normal approximation for M. Find the meanand standard deviation of M, the value of M and of the test statistic, the critical value(s), and state your conclusion.
A person who commutes to work is choosing between two different routes. He tries the
first route 11 times and the second route 12 times and records the time of each trip. The
results (in minutes)are shown below. Use a significance level of 0.01 to test whether the
mean time for route 1 differs from the mean time for route 2.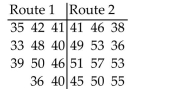
Question
Question
Determine the null and alternative hypotheses for the proposed hypothesis test.
A pharmaceutical company wants to determine whether its new antianxiety medication has any effect on resting pulse rate. They will use a paired sample to determine whether the mean resting
Pulse rate for adults not taking the antianxiety medication differs from the mean resting pulse rate
For adults who are taking the antianxiety medication.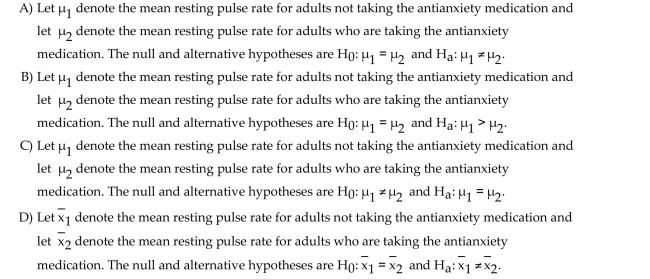
Question
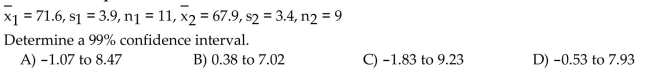
Preliminary data analyses indicate that you can reasonably use nonpooled t-procedures on the given data. Apply anonpooled t-test to perform the required hypothesis test, using either the critical-value approach or the P-value approachas indicated.
A researcher was interested in comparing the amount of time spent watching television by
women and by men. Independent simple random samples of 14 women and 17 men were
selected, and each person was asked how many hours he or she had watched television
during the previous week. The summary statistics are as follows.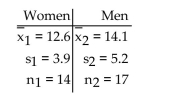 At the 5% significance level, do the data provide sufficient evidence to conclude that the
mean amount of time spent watching television by women is less than the mean amount of
time spent watching television by men? Use the critical-value approach.
A researcher was interested in comparing the amount of time spent watching television by
women and by men. Independent simple random samples of 14 women and 17 men were
selected, and each person was asked how many hours he or she had watched television
during the previous week. The summary statistics are as follows.
At the 5% significance level, do the data provide sufficient evidence to conclude that themean amount of time spent watching television by women is less than the mean amount of
time spent watching television by men? Use the critical-value approach.
Question
Preliminary data analyses indicate that you can reasonably consider the assumptions for using pooled t-proceduressatisfied. Perform the required hypothesis test by using either the critical-value approach or the P-value approach asindicated.
A researcher was interested in comparing the response times of two different cab
companies. Companies A and B were each called at 50 randomly selected times. The calls
to company A were made independently of the calls to company B. The response times for
each call were recorded. The summary statistics were as follows: At the 0.02 level of significance, do the data provide sufficient evidence to conclude that
the mean response time for company A differs from the mean response time for company
B? Use the P-value approach.
A researcher was interested in comparing the response times of two different cab
companies. Companies A and B were each called at 50 randomly selected times. The calls
to company A were made independently of the calls to company B. The response times for
each call were recorded. The summary statistics were as follows:
At the 0.02 level of significance, do the data provide sufficient evidence to conclude thatthe mean response time for company A differs from the mean response time for company
B? Use the P-value approach.
Question
Determine the null and alternative hypotheses for the proposed hypothesis test.
A researcher wants to use a paired sample to determine whether the mean number of hours spent exercising per week for married men differs from the mean number of hours spent exercising per
Week for married women.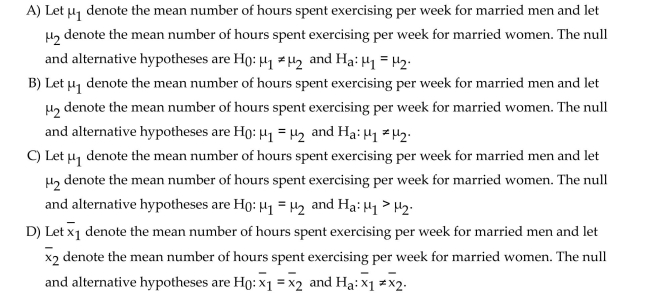
A researcher wants to use a paired sample to determine whether the mean number of hours spent exercising per week for married men differs from the mean number of hours spent exercising per
Week for married women.
Question
Determine the null and alternative hypotheses for the proposed hypothesis test.
The forced vital capacity (FVC)is often used by physicians to assess a person's ability to move air in and out of their lungs. It is the maximum amount of air that can be exhaled after a deep breath. A
Researcher wants to perform a hypothesis test to determine whether the mean forced vital capacity
For adults who are smokers is less than the mean forced vital capacity for adults who are former
Smokers. He will use a paired sample to determine whether forced vital capacity increases, on
Average, when adults stop smoking.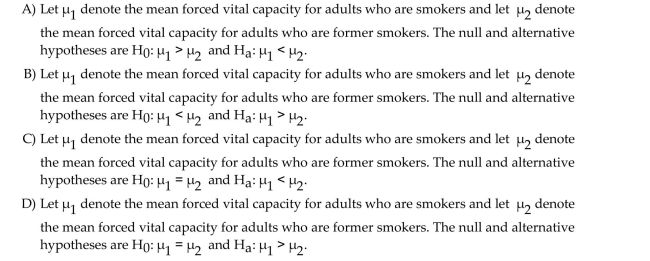
Question
Preliminary data analyses indicates that use of a paired t-test is reasonable. Perform the hypothesis test by using eitherthe critical-value approach or the P-value approach as indicated. Assume that the null hypothesis is 
A coach uses a new technique in training middle distance runners. The times, in seconds,
for 8 different athletes to run 800 meters before and after this training are shown below. At the 5% significance level, do the data provide sufficient evidence that the training helps
to improve times for the 800 meters? Use the critical-value approach.
A coach uses a new technique in training middle distance runners. The times, in seconds,
for 8 different athletes to run 800 meters before and after this training are shown below.
At the 5% significance level, do the data provide sufficient evidence that the training helpsto improve times for the 800 meters? Use the critical-value approach.
Question
Preliminary data analyses indicate that you can reasonably use nonpooled t-procedures on the given data. Apply anonpooled t-test to perform the required hypothesis test, using either the critical-value approach or the P-value approachas indicated.
A researcher was interested in comparing the salaries of female and male employees at a
particular company. Independent simple random samples of 8 female employees and 15
male employees yielded the following weekly salaries (in dollars).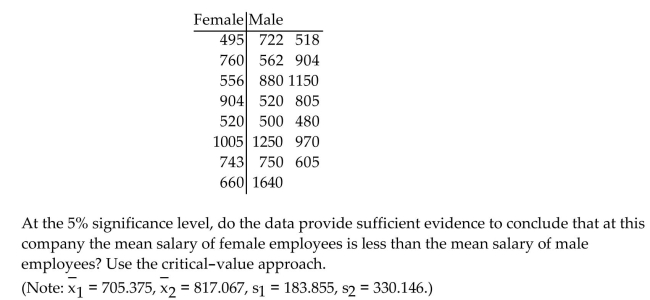
A researcher was interested in comparing the salaries of female and male employees at a
particular company. Independent simple random samples of 8 female employees and 15
male employees yielded the following weekly salaries (in dollars).
Question
Question
Determine the null and alternative hypotheses for the proposed hypothesis test.
A nutritionist wants to investigate whether her new diet will be effective in helping women aged 30-40 to lose weight. She will use a paired sample to determine whether the mean weight of
Women before going on this diet is greater than the mean weight of women after being on this diet
For two months.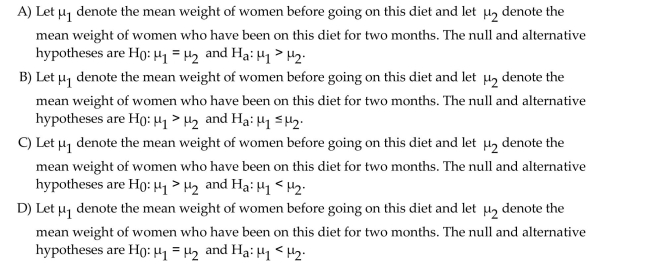
Question
Question
Perform the required hypothesis test by using a Mann-Whitney test. Use a normal approximation for M. Find the meanand standard deviation of M, the value of M and of the test statistic, the critical value(s), and state your conclusion.
Independent simple random samples of 11 female employees and 11 male employees are
selected from one company and the weekly salaries of the employees are recorded. The
salaries (in dollars)are shown below. Use a significance level of 0.10 to test whether the
mean salary for female employees differs from the mean salary for male employees.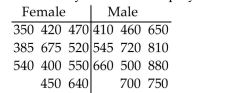
Question
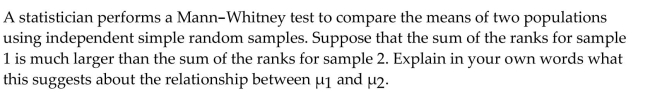
Preliminary data analyses indicate that you can reasonably consider the assumptions for using the Mann-Whitney testsatisfied. Assume that the null hypothesis is  . Use the Mann-Whitney test to carry out the requiredhypothesis test.
A researcher was interested in comparing the GPAs of students at two different colleges.
Independent simple random samples of 8 students from college A and 9 students from
college B yielded the following GPAs.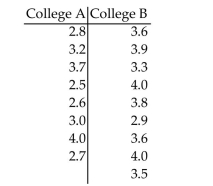 At the 10% significance level, do the data provide sufficient evidence to conclude that the
mean GPA of students at college A differs from the mean GPA of students at college B?
. Use the Mann-Whitney test to carry out the requiredhypothesis test.A researcher was interested in comparing the GPAs of students at two different colleges.
Independent simple random samples of 8 students from college A and 9 students from
college B yielded the following GPAs.
At the 10% significance level, do the data provide sufficient evidence to conclude that themean GPA of students at college A differs from the mean GPA of students at college B?
Question
Question
Provide an appropriate response.
Question
Question
Preliminary data analyses indicates that use of a paired t-test is reasonable. Perform the hypothesis test by using eitherthe critical-value approach or the P-value approach as indicated. Assume that the null hypothesis is 
Ten different families are tested for the number of gallons of water a day they use before
and after viewing a conservation video. The results are shown below. At the 5% significance level, do the data provide sufficient evidence to conclude that the
mean amount of water use after the viewing differs from the mean amount of water use
before the viewing? Use the critical-value approach.
Ten different families are tested for the number of gallons of water a day they use before
and after viewing a conservation video. The results are shown below.
At the 5% significance level, do the data provide sufficient evidence to conclude that themean amount of water use after the viewing differs from the mean amount of water use
before the viewing? Use the critical-value approach.
Question
Preliminary data analyses indicate that you can reasonably use nonpooled t-procedures on the given data. Apply anonpooled t-test to perform the required hypothesis test, using either the critical-value approach or the P-value approachas indicated.
A paint manufacturer wishes to compare the drying times of two different types of paint.
Independent random samples of 11 cans of type A and 9 cans of type B were selected and
applied to similar surfaces. The drying times (in minutes)were recorded. The summary
statistics are as follows.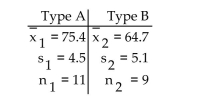 Do the data provide sufficient evidence to conclude that the mean drying time for type A
differs from the mean drying time for type B? Perform a t-test at the 1% significance level.
Use the P-value approach.
A paint manufacturer wishes to compare the drying times of two different types of paint.
Independent random samples of 11 cans of type A and 9 cans of type B were selected and
applied to similar surfaces. The drying times (in minutes)were recorded. The summary
statistics are as follows.
Do the data provide sufficient evidence to conclude that the mean drying time for type Adiffers from the mean drying time for type B? Perform a t-test at the 1% significance level.
Use the P-value approach.
Question
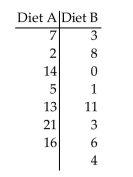
Preliminary data analyses indicates that use of a paired t-test is reasonable. Perform the hypothesis test by using eitherthe critical-value approach or the P-value approach as indicated. Assume that the null hypothesis is 
A test of abstract reasoning is given to a random sample of students before and after
completing a formal logic course. The results are shown below.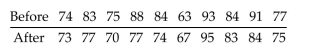 At the 5% significance level, do the data provide sufficient evidence to conclude that that
the mean score after the course differs from the mean score before the course? Use the
critical-value approach.
A test of abstract reasoning is given to a random sample of students before and after
completing a formal logic course. The results are shown below.
At the 5% significance level, do the data provide sufficient evidence to conclude that thatthe mean score after the course differs from the mean score before the course? Use the
critical-value approach.
Question
Question
Preliminary data analyses indicate that you can reasonably use nonpooled t-procedures on the given data. Apply anonpooled t-test to perform the required hypothesis test, using either the critical-value approach or the P-value approachas indicated.
A researcher was interested in comparing the amount of time spent watching television by
women and by men. Independent random samples of 14 women and 17 men were selected
and each person was asked how many hours he or she had watched television during the
previous week. The summary statistics are as follows: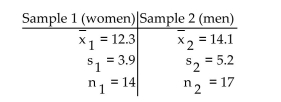 At the 5% significance level, do the data provide sufficient evidence to conclude that the
mean amount of time spent watching television by women is less than the mean amount of
time spent watching television by men? Use the P-value approach.
A researcher was interested in comparing the amount of time spent watching television by
women and by men. Independent random samples of 14 women and 17 men were selected
and each person was asked how many hours he or she had watched television during the
previous week. The summary statistics are as follows:
At the 5% significance level, do the data provide sufficient evidence to conclude that themean amount of time spent watching television by women is less than the mean amount of
time spent watching television by men? Use the P-value approach.
Question
Question
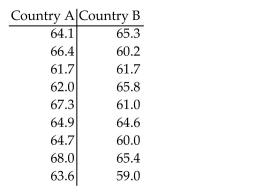
Preliminary data analyses indicate that you can reasonably consider the assumptions for using pooled t-proceduressatisfied. Perform the required hypothesis test by using either the critical-value approach or the P-value approach asindicated.
A researcher was interested in comparing the heights of women in two different countries.
Independent simple random samples of 9 women from country A and 9 women from
country B yielded the following heights (in inches).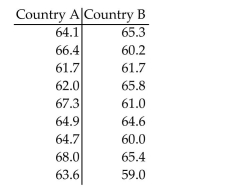 At the 10% significance level, do the data provide sufficient evidence to conclude that the
mean height of women in country A is greater than the mean height of women in country
B? Use the P-value approach.
A researcher was interested in comparing the heights of women in two different countries.
Independent simple random samples of 9 women from country A and 9 women from
country B yielded the following heights (in inches).
At the 10% significance level, do the data provide sufficient evidence to conclude that themean height of women in country A is greater than the mean height of women in country
B? Use the P-value approach.
Question
Preliminary data analyses indicates that use of a paired t-test is reasonable. Perform the hypothesis test by using eitherthe critical-value approach or the P-value approach as indicated. Assume that the null hypothesis is 
A coach uses a new technique to train gymnasts. 7 gymnasts were randomly selected and
their competition scores were recorded before and after the training. The results are shown
below. At the 1% significance level, do the data provide sufficient evidence to conclude that the
training technique is effective in raising scores? Use the P-value approach.
A coach uses a new technique to train gymnasts. 7 gymnasts were randomly selected and
their competition scores were recorded before and after the training. The results are shown
below.
At the 1% significance level, do the data provide sufficient evidence to conclude that thetraining technique is effective in raising scores? Use the P-value approach.
Question
Preliminary data analyses indicate that you can reasonably consider the assumptions for using the Mann-Whitney testsatisfied. Assume that the null hypothesis is  . Use the Mann-Whitney test to carry out the requiredhypothesis test.
A researcher was interested in investigating how much people read in their spare time and,
in particular, whether people who own a personal computer read less in their spare time
than those who do not own a computer. She selected independent simple random samples
of 7 computer owners and 9 noncomputer owners, and she asked each person how many
hours he or she had spent reading non-work-related books during the previous week. The
results are as follows.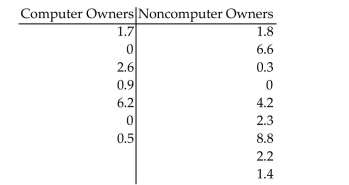 At the 2.5% significance level, do the data provide sufficient evidence to conclude that the
mean weekly reading time for computer owners is lower than the mean weekly reading
time for noncomputer owners?
. Use the Mann-Whitney test to carry out the requiredhypothesis test.A researcher was interested in investigating how much people read in their spare time and,
in particular, whether people who own a personal computer read less in their spare time
than those who do not own a computer. She selected independent simple random samples
of 7 computer owners and 9 noncomputer owners, and she asked each person how many
hours he or she had spent reading non-work-related books during the previous week. The
results are as follows.
At the 2.5% significance level, do the data provide sufficient evidence to conclude that themean weekly reading time for computer owners is lower than the mean weekly reading
time for noncomputer owners?
Question
Preliminary data analyses indicates that use of a paired Wilcoxon signed-rank test is reasonable. Perform the hypothesistest by using a paired Wilcoxon signed-rank test. Assume that the null hypothesis is 
In a study of the effectiveness of physical exercise in weight reduction, 12 subjects followed
a program of physical exercise for two months. Their weights (in pounds)before and after
this program are shown in the following table. At the 5% significance level, do the data provide sufficient evidence to conclude that the
exercise program is effective in reducing weight?
In a study of the effectiveness of physical exercise in weight reduction, 12 subjects followed
a program of physical exercise for two months. Their weights (in pounds)before and after
this program are shown in the following table.
At the 5% significance level, do the data provide sufficient evidence to conclude that theexercise program is effective in reducing weight?
Question
Preliminary data analyses indicates that use of a paired Wilcoxon signed-rank test is reasonable. Perform the hypothesistest by using a paired Wilcoxon signed-rank test. Assume that the null hypothesis is 
Students take a math test before and after tutoring. The data for a random sample of
students is given below. At the 2.5% level of significance, do the data provide sufficient evidence to conclude that
the mean score before the tutoring is lower than the mean score after the tutoring?
Students take a math test before and after tutoring. The data for a random sample of
students is given below.
At the 2.5% level of significance, do the data provide sufficient evidence to conclude thatthe mean score before the tutoring is lower than the mean score after the tutoring?
Question
Preliminary data analyses indicates that use of a paired Wilcoxon signed-rank test is reasonable. Perform the hypothesistest by using a paired Wilcoxon signed-rank test. Assume that the null hypothesis is 
The systolic blood pressure readings of ten subjects before and after following a particular
diet for a month are shown in the following table.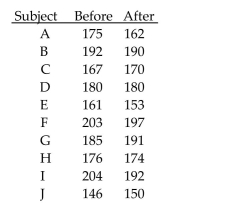 At the 1% level of significance, do the data provide sufficient evidence to conclude that the
diet has an effect on systolic blood pressure?
The systolic blood pressure readings of ten subjects before and after following a particular
diet for a month are shown in the following table.
At the 1% level of significance, do the data provide sufficient evidence to conclude that thediet has an effect on systolic blood pressure?
Question
Question
Preliminary data analyses indicate that you can reasonably use nonpooled t-procedures on the given data. Apply anonpooled t-test to perform the required hypothesis test, using either the critical-value approach or the P-value approachas indicated.
A researcher was interested in comparing the GPAs of students at two different colleges.
Independent simple random samples of 8 students from college A and 13 students from
college B yielded the following GPAs.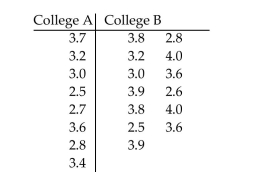 At the 10% significance level, do the data provide sufficient evidence to conclude that the
mean GPA of students at college A differs from the mean GPA of students at college B?
Use the critical-value approach.
A researcher was interested in comparing the GPAs of students at two different colleges.
Independent simple random samples of 8 students from college A and 13 students from
college B yielded the following GPAs.
At the 10% significance level, do the data provide sufficient evidence to conclude that themean GPA of students at college A differs from the mean GPA of students at college B?
Use the critical-value approach.
Question
Question
Provide an appropriate response.
A researcher wishes to compare the incomes of men and women. She selects a random
sample of 80 married women. She records the weekly income of each of these women.
Using the husbands of these women as the sample of men, she also records the weekly
income of each man. She obtains the following summary statistics.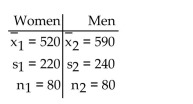 Incomes are known to be normally distributed for both populations (women and men).
Furthermore, the two population standard deviations are known to be equal. Is it
reasonable to use the pooled t-test on these data? Explain your answer.
A researcher wishes to compare the incomes of men and women. She selects a random
sample of 80 married women. She records the weekly income of each of these women.
Using the husbands of these women as the sample of men, she also records the weekly
income of each man. She obtains the following summary statistics.
Incomes are known to be normally distributed for both populations (women and men).Furthermore, the two population standard deviations are known to be equal. Is it
reasonable to use the pooled t-test on these data? Explain your answer.
Question
Provide an appropriate response.
Question
Preliminary data analyses indicate that you can reasonably consider the assumptions for using pooled t-proceduressatisfied. Perform the required hypothesis test by using either the critical-value approach or the P-value approach asindicated.
A researcher was interested in comparing the heights of women in two different countries.
Independent simple random samples of 9 women from country A and 9 women from
country B yielded the following heights (in inches).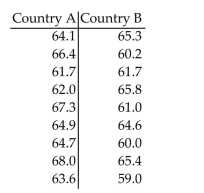 At the 10% significance level, do the data provide sufficient evidence to conclude that the
mean height of women in country A is greater than the mean height of women in country
B? Use the critical-value approach.
A researcher was interested in comparing the heights of women in two different countries.
Independent simple random samples of 9 women from country A and 9 women from
country B yielded the following heights (in inches).
At the 10% significance level, do the data provide sufficient evidence to conclude that themean height of women in country A is greater than the mean height of women in country
B? Use the critical-value approach.
Question
Question
Preliminary data analyses indicates that use of a paired Wilcoxon signed-rank test is reasonable. Perform the hypothesistest by using a paired Wilcoxon signed-rank test. Assume that the null hypothesis is
Eleven runners are timed in the 100-meter dash and are timed again one month later after
following a new training program. The times (in seconds)are shown in the following table.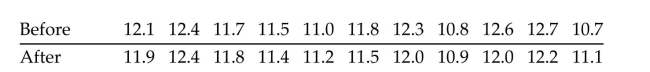 At the 10% significance level, do the data provide sufficient evidence to conclude that the
training is effective in reducing times in the 100-meter dash?
Eleven runners are timed in the 100-meter dash and are timed again one month later after
following a new training program. The times (in seconds)are shown in the following table.
At the 10% significance level, do the data provide sufficient evidence to conclude that thetraining is effective in reducing times in the 100-meter dash?
Question
Provide an appropriate response.
Question
Question
Question
Preliminary data analyses indicates that use of a paired t-test is reasonable. Perform the hypothesis test by using eitherthe critical-value approach or the P-value approach as indicated. Assume that the null hypothesis is 
Five students took a math test before and after tutoring. Their scores were as follows.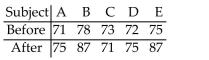 At the 1% significance level, do the data provide sufficient evidence to conclude that the
mean score before tutoring differs from the mean score after tutoring? Use the P-value
approach.
Five students took a math test before and after tutoring. Their scores were as follows.
At the 1% significance level, do the data provide sufficient evidence to conclude that themean score before tutoring differs from the mean score after tutoring? Use the P-value
approach.
Question
 Provide an appropriate response.
Suppose that you want to perform a hypothesis test based on independent simple random
samples to compare the means of two populations. Assume that the variable under
consideration is uniformly distributed on both of the populations and that the two
population standard deviations are equal. Both sample sizes are small. Identify the
procedures that could be used to carry out the hypothesis test, that is, the procedures
whose assumptions are satisfied. If more than one procedure could be used, which one
would be the best? Explain your answer.
Question
Question
Preliminary data analyses indicate that you can reasonably use nonpooled t-procedures on the given data. Apply anonpooled t-test to perform the required hypothesis test, using either the critical-value approach or the P-value approachas indicated.
A researcher was interested in comparing the GPAs of students at two different colleges.
Independent random samples of 8 students from college A and 13 students from college B
yielded the following GPAs: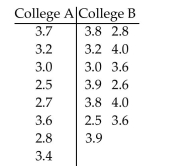 At the 10% significance level, do the data provide sufficient evidence to conclude that the
mean GPA of students at college A differs from the mean GPA of students at college B?
Use the P-value approach.
A researcher was interested in comparing the GPAs of students at two different colleges.
Independent random samples of 8 students from college A and 13 students from college B
yielded the following GPAs:
At the 10% significance level, do the data provide sufficient evidence to conclude that themean GPA of students at college A differs from the mean GPA of students at college B?
Use the P-value approach.
Question
Question
Question
Preliminary data analyses indicate that you can reasonably use nonpooled t-procedures on the given data. Apply anonpooled t-test to perform the required hypothesis test, using either the critical-value approach or the P-value approachas indicated.
A researcher was interested in comparing the resting pulse rates of people who exercise
regularly and people who do not exercise regularly. Independent simple random samples
of 16 people ages 30-40 who do not exercise regularly and 12 people ages 30-40 who
exercise regularly were selected, and the resting pulse rate (in beats per minute)of each
person was measured. The summary statistics are as follows.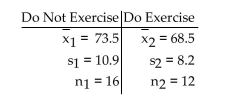 At the 2.5% significance level, do the data provide sufficient evidence to conclude that the
mean resting pulse rate of people who do not exercise regularly is greater than the mean
resting pulse rate of people who exercise regularly? Use the critical-value approach.
A researcher was interested in comparing the resting pulse rates of people who exercise
regularly and people who do not exercise regularly. Independent simple random samples
of 16 people ages 30-40 who do not exercise regularly and 12 people ages 30-40 who
exercise regularly were selected, and the resting pulse rate (in beats per minute)of each
person was measured. The summary statistics are as follows.
At the 2.5% significance level, do the data provide sufficient evidence to conclude that themean resting pulse rate of people who do not exercise regularly is greater than the mean
resting pulse rate of people who exercise regularly? Use the critical-value approach.
Question
Preliminary data analyses indicate that you can reasonably consider the assumptions for using pooled t-proceduressatisfied. Perform the required hypothesis test by using either the critical-value approach or the P-value approach asindicated.
A researcher was interested in comparing the GPAs of students at two different colleges.
Independent simple random samples of 8 students from college A and 13 students from
college B yielded the following GPAs.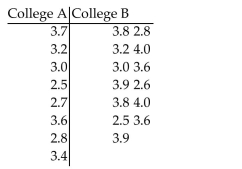 At the 10% significance level, do the data provide sufficient evidence to conclude that the
mean GPA of students at college A differs from the mean GPA of students at college B?
Use the critical-value approach.
A researcher was interested in comparing the GPAs of students at two different colleges.
Independent simple random samples of 8 students from college A and 13 students from
college B yielded the following GPAs.
At the 10% significance level, do the data provide sufficient evidence to conclude that themean GPA of students at college A differs from the mean GPA of students at college B?
Use the critical-value approach.
Question
Question
Question
Preliminary data analyses indicates that use of a paired t-test is reasonable. Perform the hypothesis test by using eitherthe critical-value approach or the P-value approach as indicated. Assume that the null hypothesis is 
Five students took a math test before and after tutoring. Their scores were as follows.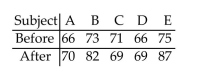 At the 1% significance level, do the data provide sufficient evidence to conclude that the
mean score before tutoring differs from the mean score after tutoring? Use the
critical-value approach.
Five students took a math test before and after tutoring. Their scores were as follows.
At the 1% significance level, do the data provide sufficient evidence to conclude that themean score before tutoring differs from the mean score after tutoring? Use the
critical-value approach.
Question
Perform the required hypothesis test by using a Mann-Whitney test. Use a normal approximation for M. Find the meanand standard deviation of M, the value of M and of the test statistic, the critical value(s), and state your conclusion.
Test whether the mean grade for students from college A differs from the mean grade for
students from College B. Independent simple random samples of 11 students from College
A and 11 students from College B are selected. Grades of the students are shown in the
table. Use a 0.05 level of significance.
Question
Preliminary data analyses indicates that use of a paired t-test is reasonable. Perform the hypothesis test by using eitherthe critical-value approach or the P-value approach as indicated. Assume that the null hypothesis is 
The table below shows the weights, in pounds, of seven subjects before and after following
a particular diet for two months.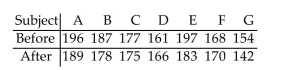 At the 1% significance level, do the data provide sufficient evidence to conclude that the
diet is effective in reducing weight? Use the critical-value approach.
The table below shows the weights, in pounds, of seven subjects before and after following
a particular diet for two months.
At the 1% significance level, do the data provide sufficient evidence to conclude that thediet is effective in reducing weight? Use the critical-value approach.
Question
Preliminary data analyses indicate that you can reasonably use nonpooled t-procedures on the given data. Apply anonpooled t-test to perform the required hypothesis test, using either the critical-value approach or the P-value approachas indicated.
A paint manufacturer wished to compare the drying times of two different types of paint.
Independent simple random samples of 11 cans of type A and 9 cans of type B were
selected and applied to similar surfaces. The drying times, in hours, were recorded. The
summary statistics are as follows.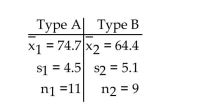 At the 1% significance level, do the data provide sufficient evidence to conclude that the
mean drying time for type A differs from the mean drying time for type B? Use the
critical-value approach.
A paint manufacturer wished to compare the drying times of two different types of paint.
Independent simple random samples of 11 cans of type A and 9 cans of type B were
selected and applied to similar surfaces. The drying times, in hours, were recorded. The
summary statistics are as follows.
At the 1% significance level, do the data provide sufficient evidence to conclude that themean drying time for type A differs from the mean drying time for type B? Use the
critical-value approach.
Question
Preliminary data analyses indicate that you can reasonably use nonpooled t-procedures on the given data. Apply anonpooled t-test to perform the required hypothesis test, using either the critical-value approach or the P-value approachas indicated.
A researcher was interested in comparing the response times of two different cab
companies. Companies A and B were each called at 50 randomly selected times. The calls
to company A were made independently of the calls to company B. The response times for
each call were recorded. The summary statistics were as follows: At the 0.02 level of significance, do the data provide sufficient evidence to conclude that
the mean response time for company A differs from the mean response time for company
B? Use the P-value approach.
A researcher was interested in comparing the response times of two different cab
companies. Companies A and B were each called at 50 randomly selected times. The calls
to company A were made independently of the calls to company B. The response times for
each call were recorded. The summary statistics were as follows:
At the 0.02 level of significance, do the data provide sufficient evidence to conclude thatthe mean response time for company A differs from the mean response time for company
B? Use the P-value approach.
Question
Question
Question

A researcher was interested in comparing the heights of women in two different countries.
Independent simple random samples of 9 women from country A and 9 women from
country B yielded the following heights (in inches).
 At the 2.5% significance level, do the data provide sufficient evidence to conclude that
women in country A are, on average, taller than women in country B?
Question
Perform the required hypothesis test by using a Mann-Whitney test. Use a normal approximation for M. Find the meanand standard deviation of M, the value of M and of the test statistic, the critical value(s), and state your conclusion.
A teacher uses two different CAI programs to remediate students. Independent simple
random samples of 11 students from program I and 14 students from program II are
selected. Results for each group on a standardized test are listed in the table below. At the
0.05 level of significance, do the data provide sufficient evidence to conclude that the mean
score for students going through program I differs from the mean score for students going
through program II?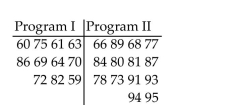
Question
Preliminary data analyses indicates that use of a paired t-test is reasonable. Perform the hypothesis test by using eitherthe critical-value approach or the P-value approach as indicated. Assume that the null hypothesis is 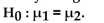
A coach uses a new technique in training middle distance runners. The times, in seconds,
for 8 different athletes to run 800 meters before and after this training are shown below. At the 5% significance level, do the data provide sufficient evidence that the training helps
to improve times for the 800 meters? Use the P-value approach.
A coach uses a new technique in training middle distance runners. The times, in seconds,
for 8 different athletes to run 800 meters before and after this training are shown below.
At the 5% significance level, do the data provide sufficient evidence that the training helpsto improve times for the 800 meters? Use the P-value approach.
Question
Question

A researcher was interested in comparing the weight losses over a two-month period for
people on two different diets. Independent simple random samples of 7 people on Diet A
and 8 people on Diet B yielded the following weight losses (in pounds).
 At the 10% significance level, do the data provide sufficient evidence to conclude that the
mean weight loss for people on diet A differs from the mean weight loss for people on diet
B?
Question
Preliminary data analyses indicates that use of a paired t-test is reasonable. Perform the hypothesis test by using eitherthe critical-value approach or the P-value approach as indicated. Assume that the null hypothesis is 
The table below shows the weights, in pounds, of seven subjects before and after following
a particular diet for two months.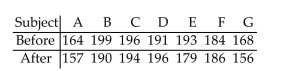 At the 1% significance level, do the data provide sufficient evidence to conclude that the
diet is effective in reducing weight? Use the P-value approach.
The table below shows the weights, in pounds, of seven subjects before and after following
a particular diet for two months.
At the 1% significance level, do the data provide sufficient evidence to conclude that thediet is effective in reducing weight? Use the P-value approach.
Question
Preliminary data analyses indicate that you can reasonably consider the assumptions for using pooled t-proceduressatisfied. Perform the required hypothesis test by using either the critical-value approach or the P-value approach asindicated.
A researcher was interested in comparing the salaries of female and male employees at a
particular company. Independent simple random samples of 8 female employees and 15
male employees yielded the following weekly salaries (in dollars).
A researcher was interested in comparing the salaries of female and male employees at a
particular company. Independent simple random samples of 8 female employees and 15
male employees yielded the following weekly salaries (in dollars).
Question
Summary statistics are given for independent simple random samples from two populations. Use the pooled t-intervalprocedure to obtain the specified confidence interval.
Question
Preliminary data analyses indicates that use of a paired t-test is reasonable. Perform the hypothesis test by using eitherthe critical-value approach or the P-value approach as indicated. Assume that the null hypothesis is
A coach uses a new technique to train gymnasts. 7 gymnasts were randomly selected and
their competition scores were recorded before and after the training. The results are shown
below.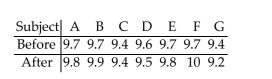 At the 1% significance level, do the data provide sufficient evidence to conclude that the
training technique is effective in raising scores? Use the critical-value approach.
A coach uses a new technique to train gymnasts. 7 gymnasts were randomly selected and
their competition scores were recorded before and after the training. The results are shown
below.
At the 1% significance level, do the data provide sufficient evidence to conclude that thetraining technique is effective in raising scores? Use the critical-value approach.
Question
Preliminary data analyses indicate that you can reasonably use nonpooled t-procedures on the given data. Apply anonpooled t-test to perform the required hypothesis test, using either the critical-value approach or the P-value approachas indicated.
A researcher wishes to determine whether the systolic blood pressure of people who
follow a vegetarian diet is, on average, lower than the systolic blood pressure of those who
do not follow a vegetarian diet.
Independent simple random samples of 85 vegetarians and 75 nonvegetarians yielded the
following sample statistics: Use a significance level of 0.01 to test the claim that the mean systolic blood pressure for
vegetarians is lower than the mean systolic blood pressure for nonvegetarians. Use the
P-value approach.
A researcher wishes to determine whether the systolic blood pressure of people who
follow a vegetarian diet is, on average, lower than the systolic blood pressure of those who
do not follow a vegetarian diet.
Independent simple random samples of 85 vegetarians and 75 nonvegetarians yielded the
following sample statistics:
Use a significance level of 0.01 to test the claim that the mean systolic blood pressure forvegetarians is lower than the mean systolic blood pressure for nonvegetarians. Use the
P-value approach.
Question
Question
Preliminary data analyses indicate that you can reasonably consider the assumptions for using the Mann-Whitney testsatisfied. Assume that the null hypothesis is  . Use the Mann-Whitney test to carry out the requiredhypothesis test.
A researcher was interested in comparing the salaries of female and male employees at a
particular company. Independent simple random samples of 8 female employees and 9
male employees yielded the following weekly salaries (in dollars).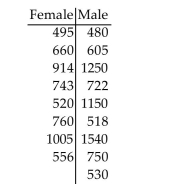 At the 5% significance level, do the data provide sufficient evidence to conclude that at this
company the mean salary of female employees is lower than the mean salary of male
employees?
. Use the Mann-Whitney test to carry out the requiredhypothesis test.A researcher was interested in comparing the salaries of female and male employees at a
particular company. Independent simple random samples of 8 female employees and 9
male employees yielded the following weekly salaries (in dollars).
At the 5% significance level, do the data provide sufficient evidence to conclude that at thiscompany the mean salary of female employees is lower than the mean salary of male
employees?
Question
Question
Provide an appropriate response.
Students take a math test before and after tutoring. The data for a random sample of
students is given below. Suppose that you want to use these data to perform a hypothesis test to determine whether
the mean score before the tutoring is lower than the mean score after the tutoring. Conduct
preliminary graphical data analyses to decide whether it is reasonable to apply the paired
t-test and whether it is reasonable to apply the paired Wilcoxon signed-rank test or
whether neither test is reasonable. If both tests are reasonable,which test would be
preferable? Explain your thinking.
Students take a math test before and after tutoring. The data for a random sample of
students is given below.
Suppose that you want to use these data to perform a hypothesis test to determine whetherthe mean score before the tutoring is lower than the mean score after the tutoring. Conduct
preliminary graphical data analyses to decide whether it is reasonable to apply the paired
t-test and whether it is reasonable to apply the paired Wilcoxon signed-rank test or
whether neither test is reasonable. If both tests are reasonable,which test would be
preferable? Explain your thinking.
Question
Question
Preliminary data analyses indicate that you can reasonably consider the assumptions for using pooled t-proceduressatisfied. Perform the required hypothesis test by using either the critical-value approach or the P-value approach asindicated.
A researcher wishes to determine whether the systolic blood pressure of people who
follow a vegetarian diet is, on average, lower than the systolic blood pressure of those who
follow a nonvegetarian diet.
Independent simple random samples of 85 vegetarians and 75 nonvegetarians yielded the
following sample statistics: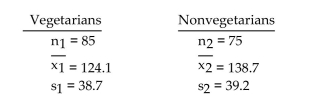 Use the sample data to test the claim that the mean systolic blood pressure for vegetarians
is lower than the mean systolic blood pressure for nonvegetarians. Test the claim using a
significance level of 0.01. Use the P-value approach.
A researcher wishes to determine whether the systolic blood pressure of people who
follow a vegetarian diet is, on average, lower than the systolic blood pressure of those who
follow a nonvegetarian diet.
Independent simple random samples of 85 vegetarians and 75 nonvegetarians yielded the
following sample statistics:
Use the sample data to test the claim that the mean systolic blood pressure for vegetariansis lower than the mean systolic blood pressure for nonvegetarians. Test the claim using a
significance level of 0.01. Use the P-value approach.
Question
Provide an appropriate response.
A statistician performs a paired Wilcoxon signed-rank test to compare the means of two
populations using a paired sample. Suppose that the sum of the positive ranks is much
larger than the sum of the negative ranks. Explain in your own words why this suggests
that
A statistician performs a paired Wilcoxon signed-rank test to compare the means of two
populations using a paired sample. Suppose that the sum of the positive ranks is much
larger than the sum of the negative ranks. Explain in your own words why this suggests
that
Question
Preliminary data analyses indicate that you can reasonably consider the assumptions for using pooled t-proceduressatisfied. Perform the required hypothesis test by using either the critical-value approach or the P-value approach asindicated.
A researcher was interested in comparing the amount of time spent watching television by
women and by men. Independent simple random samples of 14 women and 17 men were
selected, and each person was asked how many hours he or she had watched television
during the previous week. The summary statistics are as follows.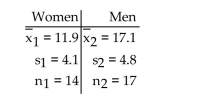 At the 5% significance level, do the data provide sufficient evidence to conclude that the
mean time spent watching television by women is less than the mean time spent watching
television by men? Use the critical-value approach.
A researcher was interested in comparing the amount of time spent watching television by
women and by men. Independent simple random samples of 14 women and 17 men were
selected, and each person was asked how many hours he or she had watched television
during the previous week. The summary statistics are as follows.
At the 5% significance level, do the data provide sufficient evidence to conclude that themean time spent watching television by women is less than the mean time spent watching
television by men? Use the critical-value approach.
Question
Preliminary data analyses indicate that you can reasonably consider the assumptions for using pooled t-proceduressatisfied. Perform the required hypothesis test by using either the critical-value approach or the P-value approach asindicated.
A researcher was interested in comparing the resting pulse rate of people who exercise
regularly and people who do not exercise regularly. Independent simple random samples
of 16 people ages 30-40 who do not exercise regularly and 12 people ages 30-40 who do
exercise regularly were selected and the resting pulse rate of each person was measured.
The summary statistics are as follows.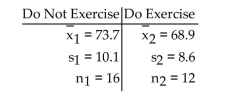 At the 2.5% significance level, do the data provide sufficient evidence to conclude that the
mean resting pulse rate of people who do not exercise regularly is greater than the mean
resting pulse rate of people who exercise regularly? Use the critical-value approach.
A researcher was interested in comparing the resting pulse rate of people who exercise
regularly and people who do not exercise regularly. Independent simple random samples
of 16 people ages 30-40 who do not exercise regularly and 12 people ages 30-40 who do
exercise regularly were selected and the resting pulse rate of each person was measured.
The summary statistics are as follows.
At the 2.5% significance level, do the data provide sufficient evidence to conclude that themean resting pulse rate of people who do not exercise regularly is greater than the mean
resting pulse rate of people who exercise regularly? Use the critical-value approach.
Question

Unlock Deck
Sign up to unlock the cards in this deck!
Unlock Deck
Unlock Deck
1/103
Play
Full screen (f)
Deck 10: Inferences for Two Population Means
1
Determine the null and alternative hypotheses for the proposed hypothesis test.
A company which designs sports shoes has made an improvement to their popular running shoe. They hope that athletes wearing the new running shoe will be able to run faster over short
Distances. They will use a paired sample to determine whether the mean time to run 100 meters for
Sprinters wearing the new running shoe is less than the mean time to run the 100 meters for
Sprinters wearing the old running shoe.
B
2
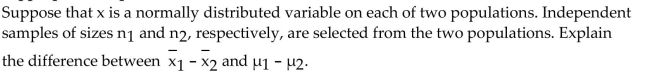
Provide an appropriate response.
Suppose that x is a normally distributed variable on each of two populations. Independent samples of sizes n1 and n2, respectively, are selected from the two populations. The mean of all possible
Differences between the two sample means is equal to which of the following?
A)The sum of the two sample means
B)The difference between the two sample means
C)The sum of the two population means
D)The difference between the two population means
D
3
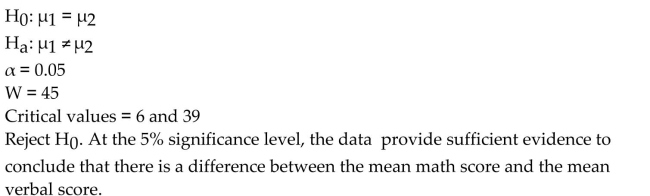
Preliminary data analyses indicates that use of a paired Wilcoxon signed-rank test is reasonable. Perform the hypothesistest by using a paired Wilcoxon signed-rank test. Assume that the null hypothesis is
Students are given scores on both the mathematics section and the verbal section of a
standardized test. The data for a random sample of students is given below. At the 5% significance level, do the data provide sufficient evidence to conclude that there
is a difference between the mean math score and the mean verbal score?
Students are given scores on both the mathematics section and the verbal section of a
standardized test. The data for a random sample of students is given below.
At the 5% significance level, do the data provide sufficient evidence to conclude that thereis a difference between the mean math score and the mean verbal score?
4
Perform the required hypothesis test by using a Mann-Whitney test. Use a normal approximation for M. Find the meanand standard deviation of M, the value of M and of the test statistic, the critical value(s), and state your conclusion.
A person who commutes to work is choosing between two different routes. He tries the
first route 11 times and the second route 12 times and records the time of each trip. The
results (in minutes)are shown below. Use a significance level of 0.01 to test whether the
mean time for route 1 differs from the mean time for route 2.
Unlock Deck
Unlock for access to all 103 flashcards in this deck.
Unlock Deck
k this deck
5
Provide an appropriate response.
Which of the following statements regarding the equal-standard-deviations assumption of the pooled t-test is the most accurate?
A)The pooled t-test is robust to moderate violations of the assumption provided the sample sizes are large.
B)The pooled t-test is robust to moderate violations of the assumption provided the sample sizes are roughly equal.
C)The pooled t-test is robust to moderate violations of the assumption regardless of the sample sizes.
D)The pooled t-test is extremely nonrobust to violations of the assumption.
Unlock Deck
Unlock for access to all 103 flashcards in this deck.
Unlock Deck
k this deck
6
Determine the null and alternative hypotheses for the proposed hypothesis test.
A pharmaceutical company wants to determine whether its new antianxiety medication has any effect on resting pulse rate. They will use a paired sample to determine whether the mean resting
Pulse rate for adults not taking the antianxiety medication differs from the mean resting pulse rate
For adults who are taking the antianxiety medication.
Unlock Deck
Unlock for access to all 103 flashcards in this deck.
Unlock Deck
k this deck
7
Preliminary data analyses indicate that you can reasonably use nonpooled t-procedures on the given data. Apply anonpooled t-test to perform the required hypothesis test, using either the critical-value approach or the P-value approachas indicated.
A researcher was interested in comparing the amount of time spent watching television by
women and by men. Independent simple random samples of 14 women and 17 men were
selected, and each person was asked how many hours he or she had watched television
during the previous week. The summary statistics are as follows. At the 5% significance level, do the data provide sufficient evidence to conclude that the
mean amount of time spent watching television by women is less than the mean amount of
time spent watching television by men? Use the critical-value approach.
A researcher was interested in comparing the amount of time spent watching television by
women and by men. Independent simple random samples of 14 women and 17 men were
selected, and each person was asked how many hours he or she had watched television
during the previous week. The summary statistics are as follows.
At the 5% significance level, do the data provide sufficient evidence to conclude that themean amount of time spent watching television by women is less than the mean amount of
time spent watching television by men? Use the critical-value approach.
Unlock Deck
Unlock for access to all 103 flashcards in this deck.
Unlock Deck
k this deck
8
Preliminary data analyses indicate that you can reasonably consider the assumptions for using pooled t-proceduressatisfied. Perform the required hypothesis test by using either the critical-value approach or the P-value approach asindicated.
A researcher was interested in comparing the response times of two different cab
companies. Companies A and B were each called at 50 randomly selected times. The calls
to company A were made independently of the calls to company B. The response times for
each call were recorded. The summary statistics were as follows: At the 0.02 level of significance, do the data provide sufficient evidence to conclude that
the mean response time for company A differs from the mean response time for company
B? Use the P-value approach.
A researcher was interested in comparing the response times of two different cab
companies. Companies A and B were each called at 50 randomly selected times. The calls
to company A were made independently of the calls to company B. The response times for
each call were recorded. The summary statistics were as follows:
At the 0.02 level of significance, do the data provide sufficient evidence to conclude thatthe mean response time for company A differs from the mean response time for company
B? Use the P-value approach.
Unlock Deck
Unlock for access to all 103 flashcards in this deck.
Unlock Deck
k this deck
9
Determine the null and alternative hypotheses for the proposed hypothesis test.
A researcher wants to use a paired sample to determine whether the mean number of hours spent exercising per week for married men differs from the mean number of hours spent exercising per
Week for married women.
A researcher wants to use a paired sample to determine whether the mean number of hours spent exercising per week for married men differs from the mean number of hours spent exercising per
Week for married women.
Unlock Deck
Unlock for access to all 103 flashcards in this deck.
Unlock Deck
k this deck
10
Determine the null and alternative hypotheses for the proposed hypothesis test.
The forced vital capacity (FVC)is often used by physicians to assess a person's ability to move air in and out of their lungs. It is the maximum amount of air that can be exhaled after a deep breath. A
Researcher wants to perform a hypothesis test to determine whether the mean forced vital capacity
For adults who are smokers is less than the mean forced vital capacity for adults who are former
Smokers. He will use a paired sample to determine whether forced vital capacity increases, on
Average, when adults stop smoking.
Unlock Deck
Unlock for access to all 103 flashcards in this deck.
Unlock Deck
k this deck
11
Preliminary data analyses indicates that use of a paired t-test is reasonable. Perform the hypothesis test by using eitherthe critical-value approach or the P-value approach as indicated. Assume that the null hypothesis is
A coach uses a new technique in training middle distance runners. The times, in seconds,
for 8 different athletes to run 800 meters before and after this training are shown below. At the 5% significance level, do the data provide sufficient evidence that the training helps
to improve times for the 800 meters? Use the critical-value approach.
A coach uses a new technique in training middle distance runners. The times, in seconds,
for 8 different athletes to run 800 meters before and after this training are shown below.
At the 5% significance level, do the data provide sufficient evidence that the training helpsto improve times for the 800 meters? Use the critical-value approach.
Unlock Deck
Unlock for access to all 103 flashcards in this deck.
Unlock Deck
k this deck
12
Preliminary data analyses indicate that you can reasonably use nonpooled t-procedures on the given data. Apply anonpooled t-test to perform the required hypothesis test, using either the critical-value approach or the P-value approachas indicated.
A researcher was interested in comparing the salaries of female and male employees at a
particular company. Independent simple random samples of 8 female employees and 15
male employees yielded the following weekly salaries (in dollars).
A researcher was interested in comparing the salaries of female and male employees at a
particular company. Independent simple random samples of 8 female employees and 15
male employees yielded the following weekly salaries (in dollars).
Unlock Deck
Unlock for access to all 103 flashcards in this deck.
Unlock Deck
k this deck
13
Provide an appropriate response.
A teacher is interested in performing a hypothesis test to compare the mean math score of
the girls and the mean math score of the boys. She randomly selects 10 girls from the class
and then randomly selects 10 boys. She arranges the girls' names alphabetically and uses
this list to assign each girl a number between 1 and 10. She does the same thing for the
boys. She pairs each girl with the boy having the same number. She then performs a paired
t-test. Do you think that in this situation a paired t-test is appropriate? Explain your
answer.
Unlock Deck
Unlock for access to all 103 flashcards in this deck.
Unlock Deck
k this deck
14
Determine the null and alternative hypotheses for the proposed hypothesis test.
A nutritionist wants to investigate whether her new diet will be effective in helping women aged 30-40 to lose weight. She will use a paired sample to determine whether the mean weight of
Women before going on this diet is greater than the mean weight of women after being on this diet
For two months.
Unlock Deck
Unlock for access to all 103 flashcards in this deck.
Unlock Deck
k this deck
15
Provide an appropriate response.
A researcher would like to conduct a hypothesis test to compare the mean SAT scores of students who have received extra coaching and the mean test score of students who have not received extra
Coaching. He will randomly select 15 students and will use the difference between the student's
Score after coaching and the student's score before coaching as the paired-difference variable. He
Obtains some normal probability plots of the sample data to determine whether it would be
Reasonable to use a paired t-test. In which of the following situations would it be reasonable to use
A paired t-test ?
A: The distribution of the before test scores appears normal, the distribution of the after test scores
Appears normal, however the distribution of the paired differences does not appear normal.
B: The distribution of the before test scores is nonnormal, the distribution of the after test scores is
Nonnormal, however the distribution of the paired differences appears normal.
A)A only
B)B only
C)A and B
D)Neither A nor B
Unlock Deck
Unlock for access to all 103 flashcards in this deck.
Unlock Deck
k this deck
16
Perform the required hypothesis test by using a Mann-Whitney test. Use a normal approximation for M. Find the meanand standard deviation of M, the value of M and of the test statistic, the critical value(s), and state your conclusion.
Independent simple random samples of 11 female employees and 11 male employees are
selected from one company and the weekly salaries of the employees are recorded. The
salaries (in dollars)are shown below. Use a significance level of 0.10 to test whether the
mean salary for female employees differs from the mean salary for male employees.
Unlock Deck
Unlock for access to all 103 flashcards in this deck.
Unlock Deck
k this deck
17
Preliminary data analyses indicate that you can reasonably consider the assumptions for using the Mann-Whitney testsatisfied. Assume that the null hypothesis is . Use the Mann-Whitney test to carry out the requiredhypothesis test.
A researcher was interested in comparing the GPAs of students at two different colleges.
Independent simple random samples of 8 students from college A and 9 students from
college B yielded the following GPAs. At the 10% significance level, do the data provide sufficient evidence to conclude that the
mean GPA of students at college A differs from the mean GPA of students at college B?
. Use the Mann-Whitney test to carry out the requiredhypothesis test.A researcher was interested in comparing the GPAs of students at two different colleges.
Independent simple random samples of 8 students from college A and 9 students from
college B yielded the following GPAs.
At the 10% significance level, do the data provide sufficient evidence to conclude that themean GPA of students at college A differs from the mean GPA of students at college B?
Unlock Deck
Unlock for access to all 103 flashcards in this deck.
Unlock Deck
k this deck
18
Provide an appropriate response.
Suppose that you want to perform a hypothesis test to compare the means of two populations using independent simple random samples. In which of the situations below is it reasonable to use
The Mann-Whitney test?
A)The distributions of the variable are not normal, and they do not have the same shape.
B)The distributions of the variable are not normal, and they have the same shape.
C)The distributions of the variable are normal, and the population standard deviations are not equal.
D)A and B
Unlock Deck
Unlock for access to all 103 flashcards in this deck.
Unlock Deck
k this deck
19
Provide an appropriate response.
Unlock Deck
Unlock for access to all 103 flashcards in this deck.
Unlock Deck
k this deck
20
Provide an appropriate response.
Suppose that you want to perform a hypothesis test based on independent simple random
samples to compare the means of two populations. Normal probability plots for the two
samples are linear and therefore suggest that the variable under consideration is normally
distributed on each population. Is it then reasonable to proceed with a pooled t-test? If not,
what additional information is required and what methods might be used to obtain this
information?
Unlock Deck
Unlock for access to all 103 flashcards in this deck.
Unlock Deck
k this deck
21
Preliminary data analyses indicates that use of a paired t-test is reasonable. Perform the hypothesis test by using eitherthe critical-value approach or the P-value approach as indicated. Assume that the null hypothesis is
Ten different families are tested for the number of gallons of water a day they use before
and after viewing a conservation video. The results are shown below. At the 5% significance level, do the data provide sufficient evidence to conclude that the
mean amount of water use after the viewing differs from the mean amount of water use
before the viewing? Use the critical-value approach.
Ten different families are tested for the number of gallons of water a day they use before
and after viewing a conservation video. The results are shown below.
At the 5% significance level, do the data provide sufficient evidence to conclude that themean amount of water use after the viewing differs from the mean amount of water use
before the viewing? Use the critical-value approach.
Unlock Deck
Unlock for access to all 103 flashcards in this deck.
Unlock Deck
k this deck
22
Preliminary data analyses indicate that you can reasonably use nonpooled t-procedures on the given data. Apply anonpooled t-test to perform the required hypothesis test, using either the critical-value approach or the P-value approachas indicated.
A paint manufacturer wishes to compare the drying times of two different types of paint.
Independent random samples of 11 cans of type A and 9 cans of type B were selected and
applied to similar surfaces. The drying times (in minutes)were recorded. The summary
statistics are as follows. Do the data provide sufficient evidence to conclude that the mean drying time for type A
differs from the mean drying time for type B? Perform a t-test at the 1% significance level.
Use the P-value approach.
A paint manufacturer wishes to compare the drying times of two different types of paint.
Independent random samples of 11 cans of type A and 9 cans of type B were selected and
applied to similar surfaces. The drying times (in minutes)were recorded. The summary
statistics are as follows.
Do the data provide sufficient evidence to conclude that the mean drying time for type Adiffers from the mean drying time for type B? Perform a t-test at the 1% significance level.
Use the P-value approach.
Unlock Deck
Unlock for access to all 103 flashcards in this deck.
Unlock Deck
k this deck
23
Preliminary data analyses indicates that use of a paired t-test is reasonable. Perform the hypothesis test by using eitherthe critical-value approach or the P-value approach as indicated. Assume that the null hypothesis is
A test of abstract reasoning is given to a random sample of students before and after
completing a formal logic course. The results are shown below. At the 5% significance level, do the data provide sufficient evidence to conclude that that
the mean score after the course differs from the mean score before the course? Use the
critical-value approach.
A test of abstract reasoning is given to a random sample of students before and after
completing a formal logic course. The results are shown below.
At the 5% significance level, do the data provide sufficient evidence to conclude that thatthe mean score after the course differs from the mean score before the course? Use the
critical-value approach.
Unlock Deck
Unlock for access to all 103 flashcards in this deck.
Unlock Deck
k this deck
24
Provide an appropriate response.
Suppose that you want to perform a hypothesis test based on a simple random paired
sample to compare the means of two populations. Two procedures are available, namely,
the paired t-test and the paired Wilcoxon signed-rank test. Give circumstances for which
the Wilcoxon signed-rank test would be the more appropriate procedure. Be sure to
comment on the size of the sample and the distribution of the paired-difference variable.
Unlock Deck
Unlock for access to all 103 flashcards in this deck.
Unlock Deck
k this deck
25
Preliminary data analyses indicate that you can reasonably use nonpooled t-procedures on the given data. Apply anonpooled t-test to perform the required hypothesis test, using either the critical-value approach or the P-value approachas indicated.
A researcher was interested in comparing the amount of time spent watching television by
women and by men. Independent random samples of 14 women and 17 men were selected
and each person was asked how many hours he or she had watched television during the
previous week. The summary statistics are as follows: At the 5% significance level, do the data provide sufficient evidence to conclude that the
mean amount of time spent watching television by women is less than the mean amount of
time spent watching television by men? Use the P-value approach.
A researcher was interested in comparing the amount of time spent watching television by
women and by men. Independent random samples of 14 women and 17 men were selected
and each person was asked how many hours he or she had watched television during the
previous week. The summary statistics are as follows:
At the 5% significance level, do the data provide sufficient evidence to conclude that themean amount of time spent watching television by women is less than the mean amount of
time spent watching television by men? Use the P-value approach.
Unlock Deck
Unlock for access to all 103 flashcards in this deck.
Unlock Deck
k this deck
26
Provide an appropriate response.
In comparing the means of two populations, some methods are based on independent
samples and some are based on paired samples. Explain the difference between
independent and paired samples. Give an example of each type of sample.
In comparing the means of two populations, some methods are based on independent
samples and some are based on paired samples. Explain the difference between
independent and paired samples. Give an example of each type of sample.
Unlock Deck
Unlock for access to all 103 flashcards in this deck.
Unlock Deck
k this deck
27
Preliminary data analyses indicate that you can reasonably consider the assumptions for using pooled t-proceduressatisfied. Perform the required hypothesis test by using either the critical-value approach or the P-value approach asindicated.
A researcher was interested in comparing the heights of women in two different countries.
Independent simple random samples of 9 women from country A and 9 women from
country B yielded the following heights (in inches). At the 10% significance level, do the data provide sufficient evidence to conclude that the
mean height of women in country A is greater than the mean height of women in country
B? Use the P-value approach.
A researcher was interested in comparing the heights of women in two different countries.
Independent simple random samples of 9 women from country A and 9 women from
country B yielded the following heights (in inches).
At the 10% significance level, do the data provide sufficient evidence to conclude that themean height of women in country A is greater than the mean height of women in country
B? Use the P-value approach.
Unlock Deck
Unlock for access to all 103 flashcards in this deck.
Unlock Deck
k this deck
28
Preliminary data analyses indicates that use of a paired t-test is reasonable. Perform the hypothesis test by using eitherthe critical-value approach or the P-value approach as indicated. Assume that the null hypothesis is
A coach uses a new technique to train gymnasts. 7 gymnasts were randomly selected and
their competition scores were recorded before and after the training. The results are shown
below. At the 1% significance level, do the data provide sufficient evidence to conclude that the
training technique is effective in raising scores? Use the P-value approach.
A coach uses a new technique to train gymnasts. 7 gymnasts were randomly selected and
their competition scores were recorded before and after the training. The results are shown
below.
At the 1% significance level, do the data provide sufficient evidence to conclude that thetraining technique is effective in raising scores? Use the P-value approach.
Unlock Deck
Unlock for access to all 103 flashcards in this deck.
Unlock Deck
k this deck
29
Preliminary data analyses indicate that you can reasonably consider the assumptions for using the Mann-Whitney testsatisfied. Assume that the null hypothesis is . Use the Mann-Whitney test to carry out the requiredhypothesis test.
A researcher was interested in investigating how much people read in their spare time and,
in particular, whether people who own a personal computer read less in their spare time
than those who do not own a computer. She selected independent simple random samples
of 7 computer owners and 9 noncomputer owners, and she asked each person how many
hours he or she had spent reading non-work-related books during the previous week. The
results are as follows. At the 2.5% significance level, do the data provide sufficient evidence to conclude that the
mean weekly reading time for computer owners is lower than the mean weekly reading
time for noncomputer owners?
. Use the Mann-Whitney test to carry out the requiredhypothesis test.A researcher was interested in investigating how much people read in their spare time and,
in particular, whether people who own a personal computer read less in their spare time
than those who do not own a computer. She selected independent simple random samples
of 7 computer owners and 9 noncomputer owners, and she asked each person how many
hours he or she had spent reading non-work-related books during the previous week. The
results are as follows.
At the 2.5% significance level, do the data provide sufficient evidence to conclude that themean weekly reading time for computer owners is lower than the mean weekly reading
time for noncomputer owners?
Unlock Deck
Unlock for access to all 103 flashcards in this deck.
Unlock Deck
k this deck
30
Preliminary data analyses indicates that use of a paired Wilcoxon signed-rank test is reasonable. Perform the hypothesistest by using a paired Wilcoxon signed-rank test. Assume that the null hypothesis is
In a study of the effectiveness of physical exercise in weight reduction, 12 subjects followed
a program of physical exercise for two months. Their weights (in pounds)before and after
this program are shown in the following table. At the 5% significance level, do the data provide sufficient evidence to conclude that the
exercise program is effective in reducing weight?
In a study of the effectiveness of physical exercise in weight reduction, 12 subjects followed
a program of physical exercise for two months. Their weights (in pounds)before and after
this program are shown in the following table.
At the 5% significance level, do the data provide sufficient evidence to conclude that theexercise program is effective in reducing weight?
Unlock Deck
Unlock for access to all 103 flashcards in this deck.
Unlock Deck
k this deck
31
Preliminary data analyses indicates that use of a paired Wilcoxon signed-rank test is reasonable. Perform the hypothesistest by using a paired Wilcoxon signed-rank test. Assume that the null hypothesis is
Students take a math test before and after tutoring. The data for a random sample of
students is given below. At the 2.5% level of significance, do the data provide sufficient evidence to conclude that
the mean score before the tutoring is lower than the mean score after the tutoring?
Students take a math test before and after tutoring. The data for a random sample of
students is given below.
At the 2.5% level of significance, do the data provide sufficient evidence to conclude thatthe mean score before the tutoring is lower than the mean score after the tutoring?
Unlock Deck
Unlock for access to all 103 flashcards in this deck.
Unlock Deck
k this deck
32
Preliminary data analyses indicates that use of a paired Wilcoxon signed-rank test is reasonable. Perform the hypothesistest by using a paired Wilcoxon signed-rank test. Assume that the null hypothesis is
The systolic blood pressure readings of ten subjects before and after following a particular
diet for a month are shown in the following table. At the 1% level of significance, do the data provide sufficient evidence to conclude that the
diet has an effect on systolic blood pressure?
The systolic blood pressure readings of ten subjects before and after following a particular
diet for a month are shown in the following table.
At the 1% level of significance, do the data provide sufficient evidence to conclude that thediet has an effect on systolic blood pressure?
Unlock Deck
Unlock for access to all 103 flashcards in this deck.
Unlock Deck
k this deck
33
Provide an appropriate response.
A researcher wishes to compare the incomes of men and women. She selects a random
sample of 80 married women. She records the weekly income of each of these women.
Using the husbands of these women as the sample of men, she also records the weekly
income of each man. Incomes are known to be normally distributed for both populations
(women and men). Furthermore, the two population standard deviations are known to be
equal. Is it reasonable to use the Mann-Whitney test on these data? Explain your answer.
Unlock Deck
Unlock for access to all 103 flashcards in this deck.
Unlock Deck
k this deck
34
Preliminary data analyses indicate that you can reasonably use nonpooled t-procedures on the given data. Apply anonpooled t-test to perform the required hypothesis test, using either the critical-value approach or the P-value approachas indicated.
A researcher was interested in comparing the GPAs of students at two different colleges.
Independent simple random samples of 8 students from college A and 13 students from
college B yielded the following GPAs. At the 10% significance level, do the data provide sufficient evidence to conclude that the
mean GPA of students at college A differs from the mean GPA of students at college B?
Use the critical-value approach.
A researcher was interested in comparing the GPAs of students at two different colleges.
Independent simple random samples of 8 students from college A and 13 students from
college B yielded the following GPAs.
At the 10% significance level, do the data provide sufficient evidence to conclude that themean GPA of students at college A differs from the mean GPA of students at college B?
Use the critical-value approach.
Unlock Deck
Unlock for access to all 103 flashcards in this deck.
Unlock Deck
k this deck
35
Provide an appropriate response.
Suppose that you want to perform a hypothesis test based on independent simple random
samples to compare the means of two populations. Several procedures are available,
namely, the pooled t-test, the nonpooled t-test, and the Mann-Whitney test. Give
circumstances for which the Mann-Whitney test would be the most appropriate
procedure. Be sure to comment on the sizes of the samples, the distributions of the variable
under consideration on the populations, and the relative shapes of the distributions.
Unlock Deck
Unlock for access to all 103 flashcards in this deck.
Unlock Deck
k this deck
36
Provide an appropriate response.
A researcher wishes to compare the incomes of men and women. She selects a random
sample of 80 married women. She records the weekly income of each of these women.
Using the husbands of these women as the sample of men, she also records the weekly
income of each man. She obtains the following summary statistics. Incomes are known to be normally distributed for both populations (women and men).
Furthermore, the two population standard deviations are known to be equal. Is it
reasonable to use the pooled t-test on these data? Explain your answer.
A researcher wishes to compare the incomes of men and women. She selects a random
sample of 80 married women. She records the weekly income of each of these women.
Using the husbands of these women as the sample of men, she also records the weekly
income of each man. She obtains the following summary statistics.
Incomes are known to be normally distributed for both populations (women and men).Furthermore, the two population standard deviations are known to be equal. Is it
reasonable to use the pooled t-test on these data? Explain your answer.
Unlock Deck
Unlock for access to all 103 flashcards in this deck.
Unlock Deck
k this deck
37
Provide an appropriate response.
Unlock Deck
Unlock for access to all 103 flashcards in this deck.
Unlock Deck
k this deck
38
Preliminary data analyses indicate that you can reasonably consider the assumptions for using pooled t-proceduressatisfied. Perform the required hypothesis test by using either the critical-value approach or the P-value approach asindicated.
A researcher was interested in comparing the heights of women in two different countries.
Independent simple random samples of 9 women from country A and 9 women from
country B yielded the following heights (in inches). At the 10% significance level, do the data provide sufficient evidence to conclude that the
mean height of women in country A is greater than the mean height of women in country
B? Use the critical-value approach.
A researcher was interested in comparing the heights of women in two different countries.
Independent simple random samples of 9 women from country A and 9 women from
country B yielded the following heights (in inches).
At the 10% significance level, do the data provide sufficient evidence to conclude that themean height of women in country A is greater than the mean height of women in country
B? Use the critical-value approach.
Unlock Deck
Unlock for access to all 103 flashcards in this deck.
Unlock Deck
k this deck
39
Provide an appropriate response.
Suppose that you want to perform a hypothesis test based on independent simple random
samples to compare the means of two populations. Assume that the variable under
consideration is uniformly distributed on one of the populations and that on the other
population it is skewed to the right. Both sample sizes are large. Identify the procedures
that could be used to carry out the hypothesis test, that is, the procedures whose
assumptions are satisfied. If more than one procedure could be used, which one would be
the best? Explain your answer.
Unlock Deck
Unlock for access to all 103 flashcards in this deck.
Unlock Deck
k this deck
40
Preliminary data analyses indicates that use of a paired Wilcoxon signed-rank test is reasonable. Perform the hypothesistest by using a paired Wilcoxon signed-rank test. Assume that the null hypothesis is
Eleven runners are timed in the 100-meter dash and are timed again one month later after
following a new training program. The times (in seconds)are shown in the following table. At the 10% significance level, do the data provide sufficient evidence to conclude that the
training is effective in reducing times in the 100-meter dash?
Eleven runners are timed in the 100-meter dash and are timed again one month later after
following a new training program. The times (in seconds)are shown in the following table.
At the 10% significance level, do the data provide sufficient evidence to conclude that thetraining is effective in reducing times in the 100-meter dash?
Unlock Deck
Unlock for access to all 103 flashcards in this deck.
Unlock Deck
k this deck
41
Provide an appropriate response.
Unlock Deck
Unlock for access to all 103 flashcards in this deck.
Unlock Deck
k this deck
42
Provide an appropriate response.
Independent simple random samples of sizes 120 and 150 are taken from two populations
with the intent of performing a hypothesis test to compare the means. Prior data analyses
have indicated that the two population standard deviations are equal; however, the
variable under consideration is not normally distributed on either population. Is it
reasonable to use the pooled t-test in this situation? Explain your answer.
Unlock Deck
Unlock for access to all 103 flashcards in this deck.
Unlock Deck
k this deck
43
Provide an appropriate response.
A researcher wants to compare the mean systolic blood pressures for adults ages 20-29 and
adults ages 30-39. Identify the variable under consideration and the two populations.
Suppose the researcher wants to perform a hypothesis test to decide whether the mean
systolic blood pressure for adults aged 20-29 is lower than the mean systolic blood
pressure for adults aged 30-39. State the null and alternative hypotheses for the hypothesis
test.
Unlock Deck
Unlock for access to all 103 flashcards in this deck.
Unlock Deck
k this deck
44
Preliminary data analyses indicates that use of a paired t-test is reasonable. Perform the hypothesis test by using eitherthe critical-value approach or the P-value approach as indicated. Assume that the null hypothesis is
Five students took a math test before and after tutoring. Their scores were as follows. At the 1% significance level, do the data provide sufficient evidence to conclude that the
mean score before tutoring differs from the mean score after tutoring? Use the P-value
approach.
Five students took a math test before and after tutoring. Their scores were as follows.
At the 1% significance level, do the data provide sufficient evidence to conclude that themean score before tutoring differs from the mean score after tutoring? Use the P-value
approach.
Unlock Deck
Unlock for access to all 103 flashcards in this deck.
Unlock Deck
k this deck
45
Provide an appropriate response.Suppose that you want to perform a hypothesis test based on independent simple random
samples to compare the means of two populations. Assume that the variable under
consideration is uniformly distributed on both of the populations and that the two
population standard deviations are equal. Both sample sizes are small. Identify the
procedures that could be used to carry out the hypothesis test, that is, the procedures
whose assumptions are satisfied. If more than one procedure could be used, which one
would be the best? Explain your answer.
Unlock Deck
Unlock for access to all 103 flashcards in this deck.
Unlock Deck
k this deck
46
Provide an appropriate response.
Suppose that you want to perform a hypothesis test to compare the means of two
populations using paired samples. How would you decide between the paired t-test and
the paired Wilcoxon signed-rank test?
Suppose that you want to perform a hypothesis test to compare the means of two
populations using paired samples. How would you decide between the paired t-test and
the paired Wilcoxon signed-rank test?
Unlock Deck
Unlock for access to all 103 flashcards in this deck.
Unlock Deck
k this deck
47
Preliminary data analyses indicate that you can reasonably use nonpooled t-procedures on the given data. Apply anonpooled t-test to perform the required hypothesis test, using either the critical-value approach or the P-value approachas indicated.
A researcher was interested in comparing the GPAs of students at two different colleges.
Independent random samples of 8 students from college A and 13 students from college B
yielded the following GPAs: At the 10% significance level, do the data provide sufficient evidence to conclude that the
mean GPA of students at college A differs from the mean GPA of students at college B?
Use the P-value approach.
A researcher was interested in comparing the GPAs of students at two different colleges.
Independent random samples of 8 students from college A and 13 students from college B
yielded the following GPAs:
At the 10% significance level, do the data provide sufficient evidence to conclude that themean GPA of students at college A differs from the mean GPA of students at college B?
Use the P-value approach.
Unlock Deck
Unlock for access to all 103 flashcards in this deck.
Unlock Deck
k this deck
48
Provide an appropriate response.
Suppose that you want to perform a hypothesis test to compare the means of two
populations using independent simple random samples. The two distributions of the
variable under consideration have the same shape. How would you decide between the
pooled t-test and the Mann-Whitney test?
Suppose that you want to perform a hypothesis test to compare the means of two
populations using independent simple random samples. The two distributions of the
variable under consideration have the same shape. How would you decide between the
pooled t-test and the Mann-Whitney test?
Unlock Deck
Unlock for access to all 103 flashcards in this deck.
Unlock Deck
k this deck
49
Provide an appropriate response.
Suppose that you want to perform a hypothesis test to compare the means of two
populations using a paired sample. Preliminary data analyses of the sample of paired
differences suggest that the distribution of the paired-difference variable is skewed to the
right . The sample of 20 paired differences contains an outlier. If it is not legitimate to
remove the outlier, is it reasonable to use a paired t-test? Is it reasonable to use a paired
Wilcoxon signed-rank test? Explain your thinking
Unlock Deck
Unlock for access to all 103 flashcards in this deck.
Unlock Deck
k this deck
50
Preliminary data analyses indicate that you can reasonably use nonpooled t-procedures on the given data. Apply anonpooled t-test to perform the required hypothesis test, using either the critical-value approach or the P-value approachas indicated.
A researcher was interested in comparing the resting pulse rates of people who exercise
regularly and people who do not exercise regularly. Independent simple random samples
of 16 people ages 30-40 who do not exercise regularly and 12 people ages 30-40 who
exercise regularly were selected, and the resting pulse rate (in beats per minute)of each
person was measured. The summary statistics are as follows. At the 2.5% significance level, do the data provide sufficient evidence to conclude that the
mean resting pulse rate of people who do not exercise regularly is greater than the mean
resting pulse rate of people who exercise regularly? Use the critical-value approach.
A researcher was interested in comparing the resting pulse rates of people who exercise
regularly and people who do not exercise regularly. Independent simple random samples
of 16 people ages 30-40 who do not exercise regularly and 12 people ages 30-40 who
exercise regularly were selected, and the resting pulse rate (in beats per minute)of each
person was measured. The summary statistics are as follows.
At the 2.5% significance level, do the data provide sufficient evidence to conclude that themean resting pulse rate of people who do not exercise regularly is greater than the mean
resting pulse rate of people who exercise regularly? Use the critical-value approach.
Unlock Deck
Unlock for access to all 103 flashcards in this deck.
Unlock Deck
k this deck
51
Preliminary data analyses indicate that you can reasonably consider the assumptions for using pooled t-proceduressatisfied. Perform the required hypothesis test by using either the critical-value approach or the P-value approach asindicated.
A researcher was interested in comparing the GPAs of students at two different colleges.
Independent simple random samples of 8 students from college A and 13 students from
college B yielded the following GPAs. At the 10% significance level, do the data provide sufficient evidence to conclude that the
mean GPA of students at college A differs from the mean GPA of students at college B?
Use the critical-value approach.
A researcher was interested in comparing the GPAs of students at two different colleges.
Independent simple random samples of 8 students from college A and 13 students from
college B yielded the following GPAs.
At the 10% significance level, do the data provide sufficient evidence to conclude that themean GPA of students at college A differs from the mean GPA of students at college B?
Use the critical-value approach.
Unlock Deck
Unlock for access to all 103 flashcards in this deck.
Unlock Deck
k this deck
52
Provide an appropriate response.
Suppose a researcher wants to perform a hypothesis test to decide whether the mean
systolic blood pressure for adults aged 20-29 is lower than the mean systolic blood
pressure for adults aged 30-39. State the null and alternative hypotheses for the hypothesis
test. Discuss the basic strategy for performing this hypothesis test, based on independent
samples.
Unlock Deck
Unlock for access to all 103 flashcards in this deck.
Unlock Deck
k this deck
53
Provide an appropriate response.
The pooled t-test requires the assumption that the two population standard deviations be
equal. What methods are available for checking this assumption? Which of these methods
is not recommended and why is it not recommended?
The pooled t-test requires the assumption that the two population standard deviations be
equal. What methods are available for checking this assumption? Which of these methods
is not recommended and why is it not recommended?
Unlock Deck
Unlock for access to all 103 flashcards in this deck.
Unlock Deck
k this deck
54
Preliminary data analyses indicates that use of a paired t-test is reasonable. Perform the hypothesis test by using eitherthe critical-value approach or the P-value approach as indicated. Assume that the null hypothesis is
Five students took a math test before and after tutoring. Their scores were as follows. At the 1% significance level, do the data provide sufficient evidence to conclude that the
mean score before tutoring differs from the mean score after tutoring? Use the
critical-value approach.
Five students took a math test before and after tutoring. Their scores were as follows.
At the 1% significance level, do the data provide sufficient evidence to conclude that themean score before tutoring differs from the mean score after tutoring? Use the
critical-value approach.
Unlock Deck
Unlock for access to all 103 flashcards in this deck.
Unlock Deck
k this deck
55
Perform the required hypothesis test by using a Mann-Whitney test. Use a normal approximation for M. Find the meanand standard deviation of M, the value of M and of the test statistic, the critical value(s), and state your conclusion.
Test whether the mean grade for students from college A differs from the mean grade for
students from College B. Independent simple random samples of 11 students from College
A and 11 students from College B are selected. Grades of the students are shown in the
table. Use a 0.05 level of significance.
Unlock Deck
Unlock for access to all 103 flashcards in this deck.
Unlock Deck
k this deck
56
Preliminary data analyses indicates that use of a paired t-test is reasonable. Perform the hypothesis test by using eitherthe critical-value approach or the P-value approach as indicated. Assume that the null hypothesis is
The table below shows the weights, in pounds, of seven subjects before and after following
a particular diet for two months. At the 1% significance level, do the data provide sufficient evidence to conclude that the
diet is effective in reducing weight? Use the critical-value approach.
The table below shows the weights, in pounds, of seven subjects before and after following
a particular diet for two months.
At the 1% significance level, do the data provide sufficient evidence to conclude that thediet is effective in reducing weight? Use the critical-value approach.
Unlock Deck
Unlock for access to all 103 flashcards in this deck.
Unlock Deck
k this deck
57
Preliminary data analyses indicate that you can reasonably use nonpooled t-procedures on the given data. Apply anonpooled t-test to perform the required hypothesis test, using either the critical-value approach or the P-value approachas indicated.
A paint manufacturer wished to compare the drying times of two different types of paint.
Independent simple random samples of 11 cans of type A and 9 cans of type B were
selected and applied to similar surfaces. The drying times, in hours, were recorded. The
summary statistics are as follows. At the 1% significance level, do the data provide sufficient evidence to conclude that the
mean drying time for type A differs from the mean drying time for type B? Use the
critical-value approach.
A paint manufacturer wished to compare the drying times of two different types of paint.
Independent simple random samples of 11 cans of type A and 9 cans of type B were
selected and applied to similar surfaces. The drying times, in hours, were recorded. The
summary statistics are as follows.
At the 1% significance level, do the data provide sufficient evidence to conclude that themean drying time for type A differs from the mean drying time for type B? Use the
critical-value approach.
Unlock Deck
Unlock for access to all 103 flashcards in this deck.
Unlock Deck
k this deck
58
Preliminary data analyses indicate that you can reasonably use nonpooled t-procedures on the given data. Apply anonpooled t-test to perform the required hypothesis test, using either the critical-value approach or the P-value approachas indicated.
A researcher was interested in comparing the response times of two different cab
companies. Companies A and B were each called at 50 randomly selected times. The calls
to company A were made independently of the calls to company B. The response times for
each call were recorded. The summary statistics were as follows: At the 0.02 level of significance, do the data provide sufficient evidence to conclude that
the mean response time for company A differs from the mean response time for company
B? Use the P-value approach.
A researcher was interested in comparing the response times of two different cab
companies. Companies A and B were each called at 50 randomly selected times. The calls
to company A were made independently of the calls to company B. The response times for
each call were recorded. The summary statistics were as follows:
At the 0.02 level of significance, do the data provide sufficient evidence to conclude thatthe mean response time for company A differs from the mean response time for company
B? Use the P-value approach.
Unlock Deck
Unlock for access to all 103 flashcards in this deck.
Unlock Deck
k this deck
59
Provide an appropriate response.
Suppose that you want to perform a hypothesis test based on independent simple random
samples to compare the means of two populations. Further suppose that the variable under
consideration is normally distributed on each of the two populations and that the
population standard deviations are unknown. If the sample standard deviations are 3.8
and 6.1, respectively, and the sample sizes are 25 and 60, respectively, would you use the
pooled or the nonpooled t-test? Explain your answer.
Unlock Deck
Unlock for access to all 103 flashcards in this deck.
Unlock Deck
k this deck
60
Provide an appropriate response.
Suppose that you want to perform a hypothesis test to compare the means of two
populations. Several procedures are available, namely, the pooled t-test, the nonpooled
t-test, the Mann-Whitney test, the paired t-test, and the Wilcoxon signed-rank test. Before
selecting the appropriate procedure, you need to look at the sample data to ascertain
distribution type. What methods are available for doing this?
Unlock Deck
Unlock for access to all 103 flashcards in this deck.
Unlock Deck
k this deck
61
A researcher was interested in comparing the heights of women in two different countries.
Independent simple random samples of 9 women from country A and 9 women from
country B yielded the following heights (in inches).
At the 2.5% significance level, do the data provide sufficient evidence to conclude thatwomen in country A are, on average, taller than women in country B?
Unlock Deck
Unlock for access to all 103 flashcards in this deck.
Unlock Deck
k this deck
62
Perform the required hypothesis test by using a Mann-Whitney test. Use a normal approximation for M. Find the meanand standard deviation of M, the value of M and of the test statistic, the critical value(s), and state your conclusion.
A teacher uses two different CAI programs to remediate students. Independent simple
random samples of 11 students from program I and 14 students from program II are
selected. Results for each group on a standardized test are listed in the table below. At the
0.05 level of significance, do the data provide sufficient evidence to conclude that the mean
score for students going through program I differs from the mean score for students going
through program II?
Unlock Deck
Unlock for access to all 103 flashcards in this deck.
Unlock Deck
k this deck
63
Preliminary data analyses indicates that use of a paired t-test is reasonable. Perform the hypothesis test by using eitherthe critical-value approach or the P-value approach as indicated. Assume that the null hypothesis is
A coach uses a new technique in training middle distance runners. The times, in seconds,
for 8 different athletes to run 800 meters before and after this training are shown below. At the 5% significance level, do the data provide sufficient evidence that the training helps
to improve times for the 800 meters? Use the P-value approach.
A coach uses a new technique in training middle distance runners. The times, in seconds,
for 8 different athletes to run 800 meters before and after this training are shown below.
At the 5% significance level, do the data provide sufficient evidence that the training helpsto improve times for the 800 meters? Use the P-value approach.
Unlock Deck
Unlock for access to all 103 flashcards in this deck.
Unlock Deck
k this deck
64
Provide an appropriate response.
Suppose that you want to perform a hypothesis test based on independent simple random
samples to compare the means of two populations. Assume that the variable under
consideration is skewed to the right on both populations , that the two population standard
deviations are equal, and that the sample sizes are large. Identify the procedures that could
be used to carry out the hypothesis test, that is, the procedures whose assumptions are
satisfied. If more than one procedure could be used, which one would be the best? Explain
your answer.
Unlock Deck
Unlock for access to all 103 flashcards in this deck.
Unlock Deck
k this deck
65
A researcher was interested in comparing the weight losses over a two-month period for
people on two different diets. Independent simple random samples of 7 people on Diet A
and 8 people on Diet B yielded the following weight losses (in pounds).
At the 10% significance level, do the data provide sufficient evidence to conclude that themean weight loss for people on diet A differs from the mean weight loss for people on diet
B?
Unlock Deck
Unlock for access to all 103 flashcards in this deck.
Unlock Deck
k this deck
66
Preliminary data analyses indicates that use of a paired t-test is reasonable. Perform the hypothesis test by using eitherthe critical-value approach or the P-value approach as indicated. Assume that the null hypothesis is
The table below shows the weights, in pounds, of seven subjects before and after following
a particular diet for two months. At the 1% significance level, do the data provide sufficient evidence to conclude that the
diet is effective in reducing weight? Use the P-value approach.
The table below shows the weights, in pounds, of seven subjects before and after following
a particular diet for two months.
At the 1% significance level, do the data provide sufficient evidence to conclude that thediet is effective in reducing weight? Use the P-value approach.
Unlock Deck
Unlock for access to all 103 flashcards in this deck.
Unlock Deck
k this deck
67
Preliminary data analyses indicate that you can reasonably consider the assumptions for using pooled t-proceduressatisfied. Perform the required hypothesis test by using either the critical-value approach or the P-value approach asindicated.
A researcher was interested in comparing the salaries of female and male employees at a
particular company. Independent simple random samples of 8 female employees and 15
male employees yielded the following weekly salaries (in dollars).
A researcher was interested in comparing the salaries of female and male employees at a
particular company. Independent simple random samples of 8 female employees and 15
male employees yielded the following weekly salaries (in dollars).
Unlock Deck
Unlock for access to all 103 flashcards in this deck.
Unlock Deck
k this deck
68
Summary statistics are given for independent simple random samples from two populations. Use the pooled t-intervalprocedure to obtain the specified confidence interval.
Unlock Deck
Unlock for access to all 103 flashcards in this deck.
Unlock Deck
k this deck
69
Preliminary data analyses indicates that use of a paired t-test is reasonable. Perform the hypothesis test by using eitherthe critical-value approach or the P-value approach as indicated. Assume that the null hypothesis is
A coach uses a new technique to train gymnasts. 7 gymnasts were randomly selected and
their competition scores were recorded before and after the training. The results are shown
below. At the 1% significance level, do the data provide sufficient evidence to conclude that the
training technique is effective in raising scores? Use the critical-value approach.
A coach uses a new technique to train gymnasts. 7 gymnasts were randomly selected and
their competition scores were recorded before and after the training. The results are shown
below.
At the 1% significance level, do the data provide sufficient evidence to conclude that thetraining technique is effective in raising scores? Use the critical-value approach.
Unlock Deck
Unlock for access to all 103 flashcards in this deck.
Unlock Deck
k this deck
70
Preliminary data analyses indicate that you can reasonably use nonpooled t-procedures on the given data. Apply anonpooled t-test to perform the required hypothesis test, using either the critical-value approach or the P-value approachas indicated.
A researcher wishes to determine whether the systolic blood pressure of people who
follow a vegetarian diet is, on average, lower than the systolic blood pressure of those who
do not follow a vegetarian diet.
Independent simple random samples of 85 vegetarians and 75 nonvegetarians yielded the
following sample statistics: Use a significance level of 0.01 to test the claim that the mean systolic blood pressure for
vegetarians is lower than the mean systolic blood pressure for nonvegetarians. Use the
P-value approach.
A researcher wishes to determine whether the systolic blood pressure of people who
follow a vegetarian diet is, on average, lower than the systolic blood pressure of those who
do not follow a vegetarian diet.
Independent simple random samples of 85 vegetarians and 75 nonvegetarians yielded the
following sample statistics:
Use a significance level of 0.01 to test the claim that the mean systolic blood pressure forvegetarians is lower than the mean systolic blood pressure for nonvegetarians. Use the
P-value approach.
Unlock Deck
Unlock for access to all 103 flashcards in this deck.
Unlock Deck
k this deck
71
Provide an appropriate response.
Manufacturer X has designed athletic footwear which it hopes will improve the
performance of athletes running the 100-meter sprint. It wishes to perform a hypothesis
test to compare the mean times of athletes in the 100-meter sprint running with
Manufacturer X's footwear and with other shoes. Do you think that a paired t-test or a
pooled t-test would be more appropriate in this situation? Why? If you think that a paired
test is preferable, explain what would constitute a pair.
Unlock Deck
Unlock for access to all 103 flashcards in this deck.
Unlock Deck
k this deck
72
Preliminary data analyses indicate that you can reasonably consider the assumptions for using the Mann-Whitney testsatisfied. Assume that the null hypothesis is . Use the Mann-Whitney test to carry out the requiredhypothesis test.
A researcher was interested in comparing the salaries of female and male employees at a
particular company. Independent simple random samples of 8 female employees and 9
male employees yielded the following weekly salaries (in dollars). At the 5% significance level, do the data provide sufficient evidence to conclude that at this
company the mean salary of female employees is lower than the mean salary of male
employees?
. Use the Mann-Whitney test to carry out the requiredhypothesis test.A researcher was interested in comparing the salaries of female and male employees at a
particular company. Independent simple random samples of 8 female employees and 9
male employees yielded the following weekly salaries (in dollars).
At the 5% significance level, do the data provide sufficient evidence to conclude that at thiscompany the mean salary of female employees is lower than the mean salary of male
employees?
Unlock Deck
Unlock for access to all 103 flashcards in this deck.
Unlock Deck
k this deck
73
Provide an appropriate response.
Suppose that you want to perform a hypothesis test based on a simple random paired
sample to compare the means of two populations. Assume that the paired-difference
variable has a symmetric bimodal distribution and that the sample size is 40. Identify the
procedures that could be used to carry out the hypothesis test, that is, the procedures
whose assumptions are satisfied. If more than one procedure could be used, which one
would be the best? Explain your answer.
Unlock Deck
Unlock for access to all 103 flashcards in this deck.
Unlock Deck
k this deck
74
Provide an appropriate response.
Students take a math test before and after tutoring. The data for a random sample of
students is given below. Suppose that you want to use these data to perform a hypothesis test to determine whether
the mean score before the tutoring is lower than the mean score after the tutoring. Conduct
preliminary graphical data analyses to decide whether it is reasonable to apply the paired
t-test and whether it is reasonable to apply the paired Wilcoxon signed-rank test or
whether neither test is reasonable. If both tests are reasonable,which test would be
preferable? Explain your thinking.
Students take a math test before and after tutoring. The data for a random sample of
students is given below.
Suppose that you want to use these data to perform a hypothesis test to determine whetherthe mean score before the tutoring is lower than the mean score after the tutoring. Conduct
preliminary graphical data analyses to decide whether it is reasonable to apply the paired
t-test and whether it is reasonable to apply the paired Wilcoxon signed-rank test or
whether neither test is reasonable. If both tests are reasonable,which test would be
preferable? Explain your thinking.
Unlock Deck
Unlock for access to all 103 flashcards in this deck.
Unlock Deck
k this deck
75
Preliminary data analyses indicate that you can reasonably consider the assumptions for using pooled t-proceduressatisfied. Perform the required hypothesis test by using either the critical-value approach or the P-value approach asindicated.
The forced vital capacity (FVC)is often used by physicians to assess a person's ability to move air in and out of their lungs. It is the maximum amount of air that can be exhaled after a deep breath. A
Researcher wants to perform a hypothesis test to determine whether the mean forced vital capacity
For adults who are smokers is less than the mean forced vital capacity for adults who are former
Smokers. He will use a paired sample to determine whether forced vital capacity increases, on
Average, when adults stop smoking.
A)Two tailed
B)Left tailed
C)Right tailed
Unlock Deck
Unlock for access to all 103 flashcards in this deck.
Unlock Deck
k this deck
76
Preliminary data analyses indicate that you can reasonably consider the assumptions for using pooled t-proceduressatisfied. Perform the required hypothesis test by using either the critical-value approach or the P-value approach asindicated.
A researcher wishes to determine whether the systolic blood pressure of people who
follow a vegetarian diet is, on average, lower than the systolic blood pressure of those who
follow a nonvegetarian diet.
Independent simple random samples of 85 vegetarians and 75 nonvegetarians yielded the
following sample statistics: Use the sample data to test the claim that the mean systolic blood pressure for vegetarians
is lower than the mean systolic blood pressure for nonvegetarians. Test the claim using a
significance level of 0.01. Use the P-value approach.
A researcher wishes to determine whether the systolic blood pressure of people who
follow a vegetarian diet is, on average, lower than the systolic blood pressure of those who
follow a nonvegetarian diet.
Independent simple random samples of 85 vegetarians and 75 nonvegetarians yielded the
following sample statistics:
Use the sample data to test the claim that the mean systolic blood pressure for vegetariansis lower than the mean systolic blood pressure for nonvegetarians. Test the claim using a
significance level of 0.01. Use the P-value approach.
Unlock Deck
Unlock for access to all 103 flashcards in this deck.
Unlock Deck
k this deck
77
Provide an appropriate response.
A statistician performs a paired Wilcoxon signed-rank test to compare the means of two
populations using a paired sample. Suppose that the sum of the positive ranks is much
larger than the sum of the negative ranks. Explain in your own words why this suggests
that
A statistician performs a paired Wilcoxon signed-rank test to compare the means of two
populations using a paired sample. Suppose that the sum of the positive ranks is much
larger than the sum of the negative ranks. Explain in your own words why this suggests
that
Unlock Deck
Unlock for access to all 103 flashcards in this deck.
Unlock Deck
k this deck
78
Preliminary data analyses indicate that you can reasonably consider the assumptions for using pooled t-proceduressatisfied. Perform the required hypothesis test by using either the critical-value approach or the P-value approach asindicated.
A researcher was interested in comparing the amount of time spent watching television by
women and by men. Independent simple random samples of 14 women and 17 men were
selected, and each person was asked how many hours he or she had watched television
during the previous week. The summary statistics are as follows. At the 5% significance level, do the data provide sufficient evidence to conclude that the
mean time spent watching television by women is less than the mean time spent watching
television by men? Use the critical-value approach.
A researcher was interested in comparing the amount of time spent watching television by
women and by men. Independent simple random samples of 14 women and 17 men were
selected, and each person was asked how many hours he or she had watched television
during the previous week. The summary statistics are as follows.
At the 5% significance level, do the data provide sufficient evidence to conclude that themean time spent watching television by women is less than the mean time spent watching
television by men? Use the critical-value approach.
Unlock Deck
Unlock for access to all 103 flashcards in this deck.
Unlock Deck
k this deck
79
Preliminary data analyses indicate that you can reasonably consider the assumptions for using pooled t-proceduressatisfied. Perform the required hypothesis test by using either the critical-value approach or the P-value approach asindicated.
A researcher was interested in comparing the resting pulse rate of people who exercise
regularly and people who do not exercise regularly. Independent simple random samples
of 16 people ages 30-40 who do not exercise regularly and 12 people ages 30-40 who do
exercise regularly were selected and the resting pulse rate of each person was measured.
The summary statistics are as follows. At the 2.5% significance level, do the data provide sufficient evidence to conclude that the
mean resting pulse rate of people who do not exercise regularly is greater than the mean
resting pulse rate of people who exercise regularly? Use the critical-value approach.
A researcher was interested in comparing the resting pulse rate of people who exercise
regularly and people who do not exercise regularly. Independent simple random samples
of 16 people ages 30-40 who do not exercise regularly and 12 people ages 30-40 who do
exercise regularly were selected and the resting pulse rate of each person was measured.
The summary statistics are as follows.
At the 2.5% significance level, do the data provide sufficient evidence to conclude that themean resting pulse rate of people who do not exercise regularly is greater than the mean
resting pulse rate of people who exercise regularly? Use the critical-value approach.
Unlock Deck
Unlock for access to all 103 flashcards in this deck.
Unlock Deck
k this deck
80
Provide an appropriate response.
Suppose that you want to perform a hypothesis test based on independent simple random
samples to compare the means of two populations. Several procedures are available,
namely, the pooled t-test, the nonpooled t-test, and the Mann-Whitney test. Give
circumstances for which the nonpooled t-test would be the most appropriate procedure.
Be sure to comment on the sizes of the samples, the distributions of the variable under
consideration on the populations, and the relative standard deviations of the distributions.
Unlock Deck
Unlock for access to all 103 flashcards in this deck.
Unlock Deck
k this deck
Unlock Deck
Unlock for access to all 103 flashcards in this deck.


