Deck 12: Chi-Square and Nonparametric
Full screen (f)
Question
Question
Question
Question
SCENARIO 12-4
A computer used by a 24-hour banking service is supposed to randomly assign each transaction to
one of 5 memory locations.A check at the end of a day's transactions gave the counts shown in the
table to each of the 5 memory locations, along with the number of reported errors.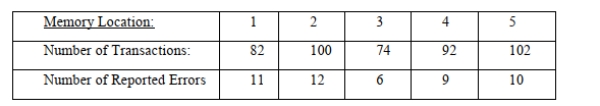 The bank manager wanted to test whether the proportion of errors in transactions assigned to each of
the 5 memory locations differ.
Referring to Scenario 12-4, which test would be used to properly analyze the data in this
Experiment?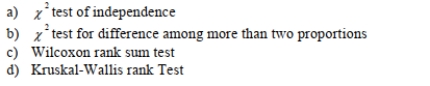
A computer used by a 24-hour banking service is supposed to randomly assign each transaction to
one of 5 memory locations.A check at the end of a day's transactions gave the counts shown in the
table to each of the 5 memory locations, along with the number of reported errors.
The bank manager wanted to test whether the proportion of errors in transactions assigned to each ofthe 5 memory locations differ.
Referring to Scenario 12-4, which test would be used to properly analyze the data in this
Experiment?
Question
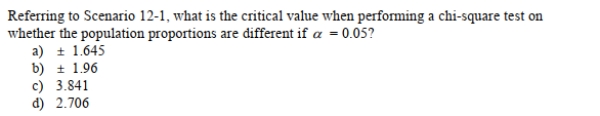
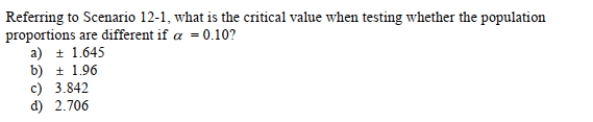
SCENARIO 12-1 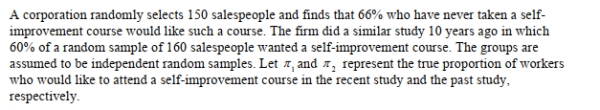
Referring to Scenario 12-1, the company tests to determine at the 0.05 level whether the
Population proportion has changed from the previous study.Which of the following is most
Correct?
A) Reject the null hypothesis and conclude that the proportion of employees who are interested in a self-improvement course has changed over the intervening 10 years.
B) Do not reject the null hypothesis and conclude that the proportion of employees who are interested in a self-improvement course has not changed over the intervening 10 years.
C) Reject the null hypothesis and conclude that the proportion of employees who are interested in a self-improvement course has increased over the intervening 10 years.
D) Do not reject the null hypothesis and conclude that the proportion of employees who are interested in a self-improvement course has increased over the intervening 10 years.
Question
SCENARIO 12-3 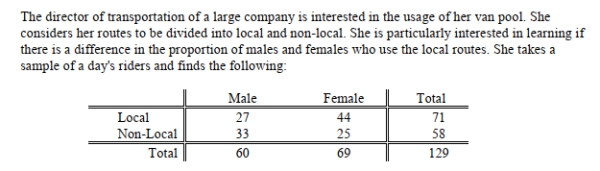 She will use this information to perform a chi-square hypothesis test using a level of significance of
True or False: Referring to Scenario 12-3, the decision made suggests that there is a difference
between the proportion of males and females who ride local versus non-local routes.
She will use this information to perform a chi-square hypothesis test using a level of significance ofTrue or False: Referring to Scenario 12-3, the decision made suggests that there is a difference
between the proportion of males and females who ride local versus non-local routes.
Question
SCENARIO 12-1
Question
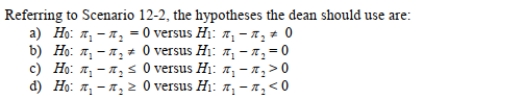
SCENARIO 12-2
The dean of a college is interested in the proportion of graduates from his college who have a job
offer on graduation day.He is particularly interested in seeing if there is a difference in this
proportion for accounting and economics majors.In a random sample of 100 of each type of major at
graduation, he found that 65 accounting majors and 52 economics majors had job offers.If the
accounting majors are designated as "Group 1" and the economics majors are designated as "Group
2," perform the appropriate hypothesis test using a level of significance of 0.05.
Question
In testing a hypothesis using the  test, the theoretical frequencies are based on the
A) null hypothesis.
B) alternative hypothesis.
C) normal distribution.
D) None of the above.
test, the theoretical frequencies are based on theA) null hypothesis.
B) alternative hypothesis.
C) normal distribution.
D) None of the above.
Question
SCENARIO 12-1
Question
If we use the  method of analysis to test for the differences among 4 proportions, the degrees
Of freedom are equal to:
A) 3
B) 4
C) 5
D) 1
method of analysis to test for the differences among 4 proportions, the degreesOf freedom are equal to:
A) 3
B) 4
C) 5
D) 1
Question
Question
Question
Question
Question
If we wish to determine whether there is evidence that the proportion of items of interest is the
Same in group 1 as in group 2, the appropriate test to use is
Same in group 1 as in group 2, the appropriate test to use is
Question
Question
SCENARIO 12-1
Question
SCENARIO 12-3 She will use this information to perform a chi-square hypothesis test using a level of significance of
True or False: Referring to Scenario 12-3, the null hypothesis will be rejected.
She will use this information to perform a chi-square hypothesis test using a level of significance ofTrue or False: Referring to Scenario 12-3, the null hypothesis will be rejected.
Question
Question
SCENARIO 12-5
Four surgical procedures currently are used to install pacemakers.If the patient does not need to
return for follow-up surgery, the operation is called a "clear" operation.A heart center wants to
compare the proportion of clear operations for the 4 procedures, and collects the following numbers
of patients from their own records: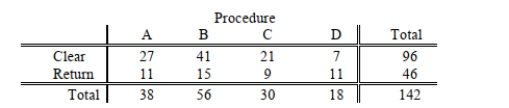 They will use this information to test for a difference among the proportion of clear operations using
a chi-square test with a level of significance of 0.05.
True or False: Referring to Scenario 12-5, the decision made suggests that the 4 procedures do
not all have the same proportion of clear operations.
Four surgical procedures currently are used to install pacemakers.If the patient does not need to
return for follow-up surgery, the operation is called a "clear" operation.A heart center wants to
compare the proportion of clear operations for the 4 procedures, and collects the following numbers
of patients from their own records:
They will use this information to test for a difference among the proportion of clear operations usinga chi-square test with a level of significance of 0.05.
True or False: Referring to Scenario 12-5, the decision made suggests that the 4 procedures do
not all have the same proportion of clear operations.
Question
SCENARIO 12-5
Four surgical procedures currently are used to install pacemakers.If the patient does not need to
return for follow-up surgery, the operation is called a "clear" operation.A heart center wants to
compare the proportion of clear operations for the 4 procedures, and collects the following numbers
of patients from their own records: They will use this information to test for a difference among the proportion of clear operations using
a chi-square test with a level of significance of 0.05.
Referring to Scenario 12-5, the test will involve _________ degrees of freedom.
Four surgical procedures currently are used to install pacemakers.If the patient does not need to
return for follow-up surgery, the operation is called a "clear" operation.A heart center wants to
compare the proportion of clear operations for the 4 procedures, and collects the following numbers
of patients from their own records:
They will use this information to test for a difference among the proportion of clear operations usinga chi-square test with a level of significance of 0.05.
Referring to Scenario 12-5, the test will involve _________ degrees of freedom.
Question
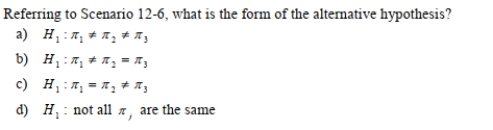
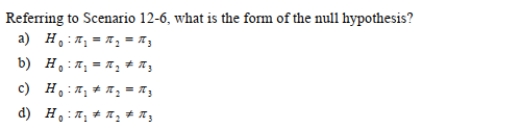
Scenario 12-6
According to an article in Marketing News, fewer checks are being written at the grocery store
checkout than in the past.To determine whether there is a difference in the proportion of shoppers
who pay by check among three consecutive years at a 0.05 level of significance, the results of a
survey of 500 shoppers in three consecutive years are obtained and presented below.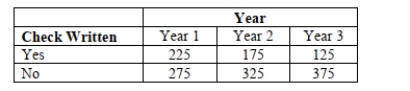
Referring to Scenario 12-6, what are the degrees of freedom of the test statistic?
Question
SCENARIO 12-7 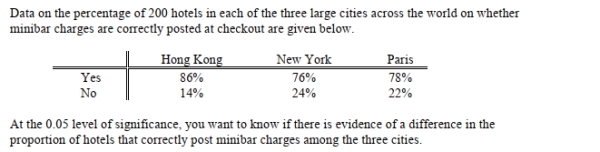 .
.
Referring to Scenario 12-7, the test will involve _________ degrees of freedom.
.Referring to Scenario 12-7, the test will involve _________ degrees of freedom.
Question
SCENARIO 12-7 .
Referring to Scenario 12-7, the expected cell frequency for the Hong Kong/Yes cell is
__________.
.Referring to Scenario 12-7, the expected cell frequency for the Hong Kong/Yes cell is
__________.
Question
Scenario 12-6
According to an article in Marketing News, fewer checks are being written at the grocery store
checkout than in the past.To determine whether there is a difference in the proportion of shoppers
who pay by check among three consecutive years at a 0.05 level of significance, the results of a
survey of 500 shoppers in three consecutive years are obtained and presented below.
True or False: Referring to Scenario 12-6, the assumptions needed to perform the test are
satisfied.
Question
SCENARIO 12-5
Four surgical procedures currently are used to install pacemakers.If the patient does not need to
return for follow-up surgery, the operation is called a "clear" operation.A heart center wants to
compare the proportion of clear operations for the 4 procedures, and collects the following numbers
of patients from their own records: They will use this information to test for a difference among the proportion of clear operations using
a chi-square test with a level of significance of 0.05.
True or False: Referring to Scenario 12-5, the null hypothesis will be rejected.
Four surgical procedures currently are used to install pacemakers.If the patient does not need to
return for follow-up surgery, the operation is called a "clear" operation.A heart center wants to
compare the proportion of clear operations for the 4 procedures, and collects the following numbers
of patients from their own records:
They will use this information to test for a difference among the proportion of clear operations usinga chi-square test with a level of significance of 0.05.
True or False: Referring to Scenario 12-5, the null hypothesis will be rejected.
Question
Scenario 12-6
According to an article in Marketing News, fewer checks are being written at the grocery store
checkout than in the past.To determine whether there is a difference in the proportion of shoppers
who pay by check among three consecutive years at a 0.05 level of significance, the results of a
survey of 500 shoppers in three consecutive years are obtained and presented below.
True or False: Referring to Scenario 12-6, there is sufficient evidence to conclude that the
proportions between year 1 and year 2 are different at a 0.05 level of significance.
Question
Scenario 12-6
According to an article in Marketing News, fewer checks are being written at the grocery store
checkout than in the past.To determine whether there is a difference in the proportion of shoppers
who pay by check among three consecutive years at a 0.05 level of significance, the results of a
survey of 500 shoppers in three consecutive years are obtained and presented below.
Referring to Scenario 12-6, what is the expected number of shoppers who pay by check in year
1 if there is no difference in the proportion of shoppers who pay by check among the three years?
Question
SCENARIO 12-4
A computer used by a 24-hour banking service is supposed to randomly assign each transaction to
one of 5 memory locations.A check at the end of a day's transactions gave the counts shown in the
table to each of the 5 memory locations, along with the number of reported errors. The bank manager wanted to test whether the proportion of errors in transactions assigned to each of
the 5 memory locations differ.
Referring to Scenario 12-4, the critical value of the test statistic at 1% level of significance is
A) 7.7794
B) 13.2767
C) 20.0902
D) 23.2093
A computer used by a 24-hour banking service is supposed to randomly assign each transaction to
one of 5 memory locations.A check at the end of a day's transactions gave the counts shown in the
table to each of the 5 memory locations, along with the number of reported errors.
The bank manager wanted to test whether the proportion of errors in transactions assigned to each ofthe 5 memory locations differ.
Referring to Scenario 12-4, the critical value of the test statistic at 1% level of significance is
A) 7.7794
B) 13.2767
C) 20.0902
D) 23.2093
Question
Scenario 12-6
According to an article in Marketing News, fewer checks are being written at the grocery store
checkout than in the past.To determine whether there is a difference in the proportion of shoppers
who pay by check among three consecutive years at a 0.05 level of significance, the results of a
survey of 500 shoppers in three consecutive years are obtained and presented below.
True or False: Referring to Scenario 12-6, there is insufficient evidence to conclude that the
proportions between year 1 and year 3 are different at a 0.05 level of significance.
Question
Scenario 12-6
According to an article in Marketing News, fewer checks are being written at the grocery store
checkout than in the past.To determine whether there is a difference in the proportion of shoppers
who pay by check among three consecutive years at a 0.05 level of significance, the results of a
survey of 500 shoppers in three consecutive years are obtained and presented below.
Referring to Scenario 12-6, what is the expected number of shoppers who do not pay by check
in year 3 if there is no difference in the proportion of shoppers who pay by check among the
three years?
Question
Scenario 12-6
According to an article in Marketing News, fewer checks are being written at the grocery store
checkout than in the past.To determine whether there is a difference in the proportion of shoppers
who pay by check among three consecutive years at a 0.05 level of significance, the results of a
survey of 500 shoppers in three consecutive years are obtained and presented below.
Question
SCENARIO 12-4
A computer used by a 24-hour banking service is supposed to randomly assign each transaction to
one of 5 memory locations.A check at the end of a day's transactions gave the counts shown in the
table to each of the 5 memory locations, along with the number of reported errors. The bank manager wanted to test whether the proportion of errors in transactions assigned to each of
the 5 memory locations differ.
Referring to Scenario 12-4, at 1% level of significance
A) there is sufficient evidence to conclude that the proportions of errors in transactions assigned to each of the 5 memory locations are all different.
B) there is insufficient evidence to conclude that the proportions of errors in transactions assigned to each of the 5 memory locations are all different.
C) there is sufficient evidence to conclude that the proportion of errors in transactions assigned to each of the 5 memory locations are not all the same.
D) there is insufficient evidence to conclude that the proportion of errors in transactions assigned to each of the 5 memory locations are not all the same.
A computer used by a 24-hour banking service is supposed to randomly assign each transaction to
one of 5 memory locations.A check at the end of a day's transactions gave the counts shown in the
table to each of the 5 memory locations, along with the number of reported errors.
The bank manager wanted to test whether the proportion of errors in transactions assigned to each ofthe 5 memory locations differ.
Referring to Scenario 12-4, at 1% level of significance
A) there is sufficient evidence to conclude that the proportions of errors in transactions assigned to each of the 5 memory locations are all different.
B) there is insufficient evidence to conclude that the proportions of errors in transactions assigned to each of the 5 memory locations are all different.
C) there is sufficient evidence to conclude that the proportion of errors in transactions assigned to each of the 5 memory locations are not all the same.
D) there is insufficient evidence to conclude that the proportion of errors in transactions assigned to each of the 5 memory locations are not all the same.
Question
Scenario 12-6
According to an article in Marketing News, fewer checks are being written at the grocery store
checkout than in the past.To determine whether there is a difference in the proportion of shoppers
who pay by check among three consecutive years at a 0.05 level of significance, the results of a
survey of 500 shoppers in three consecutive years are obtained and presented below.
True or False: Referring to Scenario 12-6, there is sufficient evidence to conclude that the
proportions between year 2 and year 3 are different at a 0.05 level of significance.
Question
Question
Scenario 12-6
According to an article in Marketing News, fewer checks are being written at the grocery store
checkout than in the past.To determine whether there is a difference in the proportion of shoppers
who pay by check among three consecutive years at a 0.05 level of significance, the results of a
survey of 500 shoppers in three consecutive years are obtained and presented below.
Question
SCENARIO 12-4
A computer used by a 24-hour banking service is supposed to randomly assign each transaction to
one of 5 memory locations.A check at the end of a day's transactions gave the counts shown in the
table to each of the 5 memory locations, along with the number of reported errors. The bank manager wanted to test whether the proportion of errors in transactions assigned to each of
the 5 memory locations differ.
Referring to Scenario 12-4, the degrees of freedom of the test statistic is
A) 4
B) 8
C) 10
D) 448
A computer used by a 24-hour banking service is supposed to randomly assign each transaction to
one of 5 memory locations.A check at the end of a day's transactions gave the counts shown in the
table to each of the 5 memory locations, along with the number of reported errors.
The bank manager wanted to test whether the proportion of errors in transactions assigned to each ofthe 5 memory locations differ.
Referring to Scenario 12-4, the degrees of freedom of the test statistic is
A) 4
B) 8
C) 10
D) 448
Question
SCENARIO 12-5
Four surgical procedures currently are used to install pacemakers.If the patient does not need to
return for follow-up surgery, the operation is called a "clear" operation.A heart center wants to
compare the proportion of clear operations for the 4 procedures, and collects the following numbers
of patients from their own records: They will use this information to test for a difference among the proportion of clear operations using
a chi-square test with a level of significance of 0.05.
True or False: Referring to Scenario 12-5, the decision made suggests that the 4 procedures all
have different proportions of clear operations.
Four surgical procedures currently are used to install pacemakers.If the patient does not need to
return for follow-up surgery, the operation is called a "clear" operation.A heart center wants to
compare the proportion of clear operations for the 4 procedures, and collects the following numbers
of patients from their own records:
They will use this information to test for a difference among the proportion of clear operations usinga chi-square test with a level of significance of 0.05.
True or False: Referring to Scenario 12-5, the decision made suggests that the 4 procedures all
have different proportions of clear operations.
Question
SCENARIO 12-4
A computer used by a 24-hour banking service is supposed to randomly assign each transaction to
one of 5 memory locations.A check at the end of a day's transactions gave the counts shown in the
table to each of the 5 memory locations, along with the number of reported errors. The bank manager wanted to test whether the proportion of errors in transactions assigned to each of
the 5 memory locations differ.
Referring to Scenario 12-4, the calculated value of the test statistic is
A) -0.1777
B) -0.0185
C) 1.4999
D) 1.5190
A computer used by a 24-hour banking service is supposed to randomly assign each transaction to
one of 5 memory locations.A check at the end of a day's transactions gave the counts shown in the
table to each of the 5 memory locations, along with the number of reported errors.
The bank manager wanted to test whether the proportion of errors in transactions assigned to each ofthe 5 memory locations differ.
Referring to Scenario 12-4, the calculated value of the test statistic is
A) -0.1777
B) -0.0185
C) 1.4999
D) 1.5190
Question
SCENARIO 12-7 .
True or False: Referring to Scenario 12-7, the decision made suggests that the 3 cities all have
different proportions of hotels that correctly post minibar charges.
.True or False: Referring to Scenario 12-7, the decision made suggests that the 3 cities all have
different proportions of hotels that correctly post minibar charges.
Question
SCENARIO 12-9
Many companies use well-known celebrities as spokespersons in their TV advertisements.A study
was conducted to determine whether brand awareness of female TV viewers and the gender of the
spokesperson are independent.Each in a sample of 300 female TV viewers was asked to identify a
product advertised by a celebrity spokesperson.The gender of the spokesperson and whether or not
the viewer could identify the product was recorded.The numbers in each category are given below.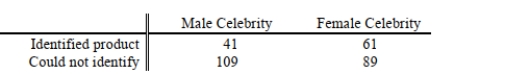
Referring to Scenario 12-9, at 5% level of significance, the conclusion is that
A) brand awareness of female TV viewers and the gender of the spokesperson are independent.
B) brand awareness of female TV viewers and the gender of the spokesperson are not independent.
C) brand awareness of female TV viewers and the gender of the spokesperson are related.
D) Both (b) and (c) .
Question
SCENARIO 12-8 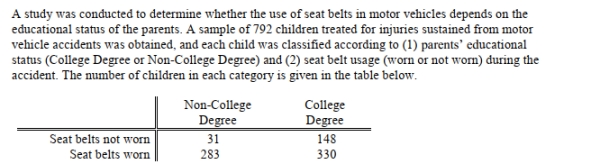
Referring to Scenario 12-8, at 5% level of significance, there is sufficient evidence to conclude
That
A) use of seat belts in motor vehicles is related to the educational status of the parents.
B) use of seat belts in motor vehicles depends on the educational status of the parents.
C) use of seat belts in motor vehicles is associated with the educational status of the parents.
D) All of the above.
Question
SCENARIO 12-8
Referring to Scenario 12-8, at 5% level of significance, the critical value of the test statistic is
A) 3.8415
B) 5.9914
C) 9.4877
D) 13.2767
Referring to Scenario 12-8, at 5% level of significance, the critical value of the test statistic is
A) 3.8415
B) 5.9914
C) 9.4877
D) 13.2767
Question
SCENARIO 12-10 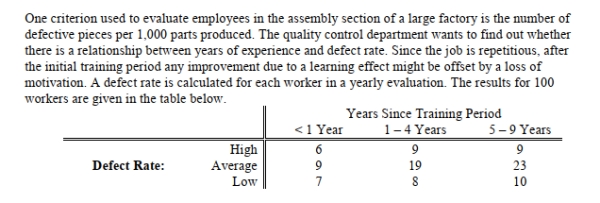
Referring to Scenario 12-10, what is the expected number of employees with less than 1 year of
Training time and a high defect rate?
A) 4.17
B) 4.60
C) 5.28
D) 9.17
Referring to Scenario 12-10, what is the expected number of employees with less than 1 year of
Training time and a high defect rate?
A) 4.17
B) 4.60
C) 5.28
D) 9.17
Question
SCENARIO 12-10
Referring to Scenario 12-10, find the rejection region necessary for testing at the 0.05 level of
Significance whether there is a relationship between defect rate and years of experience.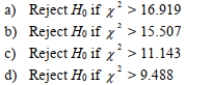
Referring to Scenario 12-10, find the rejection region necessary for testing at the 0.05 level of
Significance whether there is a relationship between defect rate and years of experience.
Question
SCENARIO 12-9
Many companies use well-known celebrities as spokespersons in their TV advertisements.A study
was conducted to determine whether brand awareness of female TV viewers and the gender of the
spokesperson are independent.Each in a sample of 300 female TV viewers was asked to identify a
product advertised by a celebrity spokesperson.The gender of the spokesperson and whether or not
the viewer could identify the product was recorded.The numbers in each category are given below.
Referring to Scenario 12-9, which test would be used to properly analyze the data in this
Experiment?
A) test for independence
B) test for differences among more than two proportions
C) Wilcoxon rank sum test for independent populations
D) Kruskal-Wallis rank test
Many companies use well-known celebrities as spokespersons in their TV advertisements.A study
was conducted to determine whether brand awareness of female TV viewers and the gender of the
spokesperson are independent.Each in a sample of 300 female TV viewers was asked to identify a
product advertised by a celebrity spokesperson.The gender of the spokesperson and whether or not
the viewer could identify the product was recorded.The numbers in each category are given below.
Referring to Scenario 12-9, which test would be used to properly analyze the data in this
Experiment?
A)
test for independenceB)
test for differences among more than two proportionsC) Wilcoxon rank sum test for independent populations
D) Kruskal-Wallis rank test
Question
SCENARIO 12-10
Referring to Scenario 12-10, for the cell with 1 to 4 years of training time and a high defect
Rate, what is the contribution to the overall
Statistic for the independence test?
A) 0.36
B) 0.1296
C) 0.015
D) 0.0144
Referring to Scenario 12-10, for the cell with 1 to 4 years of training time and a high defect
Rate, what is the contribution to the overall
Statistic for the independence test?
A) 0.36
B) 0.1296
C) 0.015
D) 0.0144
Question
SCENARIO 12-7 .
True or False: Referring to Scenario 12-7, the null hypothesis will be rejected.
.True or False: Referring to Scenario 12-7, the null hypothesis will be rejected.
Question
SCENARIO 12-10
Referring to Scenario 12-10, which test would be used to properly analyze the data in this
Experiment to determine whether there is a relationship between defect rate and years of
Experience?
A) test for independence
B) test for differences among more than two proportions
C) Wilcoxon rank sum test for independent populations
D) Kruskal-Wallis rank test
Referring to Scenario 12-10, which test would be used to properly analyze the data in this
Experiment to determine whether there is a relationship between defect rate and years of
Experience?
A)
test for independenceB)
test for differences among more than two proportionsC) Wilcoxon rank sum test for independent populations
D) Kruskal-Wallis rank test
Question
SCENARIO 12-10
Referring to Scenario 12-10, what is the expected number of employees with 1 to 4 years of
Training time and a high defect rate?
A) 12.00
B) 8.64
C) 6.67
D) 6.00
Referring to Scenario 12-10, what is the expected number of employees with 1 to 4 years of
Training time and a high defect rate?
A) 12.00
B) 8.64
C) 6.67
D) 6.00
Question
SCENARIO 12-9
Many companies use well-known celebrities as spokespersons in their TV advertisements.A study
was conducted to determine whether brand awareness of female TV viewers and the gender of the
spokesperson are independent.Each in a sample of 300 female TV viewers was asked to identify a
product advertised by a celebrity spokesperson.The gender of the spokesperson and whether or not
the viewer could identify the product was recorded.The numbers in each category are given below.
Referring to Scenario 12-9, the calculated test statistic is
A) -0.1006
B) 0.00
C) 5.9418
D) 6.1194
Question
SCENARIO 12-9
Many companies use well-known celebrities as spokespersons in their TV advertisements.A study
was conducted to determine whether brand awareness of female TV viewers and the gender of the
spokesperson are independent.Each in a sample of 300 female TV viewers was asked to identify a
product advertised by a celebrity spokesperson.The gender of the spokesperson and whether or not
the viewer could identify the product was recorded.The numbers in each category are given below.
Referring to Scenario 12-9, the degrees of freedom of the test statistic are
A) 1
B) 2
C) 4
D) 299
Question
SCENARIO 12-7 .
True or False: Referring to Scenario 12-7, the decision made suggests that the 3 cities do not all
have the same proportion of hotels that correctly post minibar charges.
.True or False: Referring to Scenario 12-7, the decision made suggests that the 3 cities do not all
have the same proportion of hotels that correctly post minibar charges.
Question
SCENARIO 12-9
Many companies use well-known celebrities as spokespersons in their TV advertisements.A study
was conducted to determine whether brand awareness of female TV viewers and the gender of the
spokesperson are independent.Each in a sample of 300 female TV viewers was asked to identify a
product advertised by a celebrity spokesperson.The gender of the spokesperson and whether or not
the viewer could identify the product was recorded.The numbers in each category are given below.
Referring to Scenario 12-9, at 5% level of significance, the critical value of the test statistic is
A) 3.8415
B) 5.9914
C) 9.4877
D) 13.2767
Question
SCENARIO 12-7 .
Referring to Scenario 12-7, the expected cell frequency for the Paris/No cell is __________.
.Referring to Scenario 12-7, the expected cell frequency for the Paris/No cell is __________.
Question
SCENARIO 12-8
Referring to Scenario 12-8, which test would be used to properly analyze the data in this
Experiment?
A) test for independence
B) test for differences among more than two proportions
C) Wilcoxon rank sum test for independent populations
D) Kruskal-Wallis rank test
Referring to Scenario 12-8, which test would be used to properly analyze the data in this
Experiment?
A)
test for independenceB)
test for differences among more than two proportionsC) Wilcoxon rank sum test for independent populations
D) Kruskal-Wallis rank test
Question
Question
Question
SCENARIO 12-8
Referring to Scenario 12-8, the calculated test statistic is
A) -0.9991
B) -0.1368
C) 48.1849
D) 72.8063
Referring to Scenario 12-8, the calculated test statistic is
A) -0.9991
B) -0.1368
C) 48.1849
D) 72.8063
Question
SCENARIO 12-12
Parents complain that children read too few storybooks and watch too much television nowadays.A
survey of 1,000 children reveals the following information on average time spent watching TV and
average time spent reading storybooks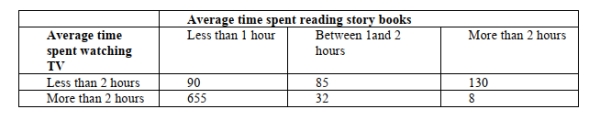
Referring to Scenario 12-12, suppose we want to constrain the probability of committing a
Type I error to 5% when testing whether there is any relationship between average time spent
Watching TV and average time spent reading story books, the critical value will be
A) 5.991
B) 7.378
C) 12.592
D) 14.449
Question
SCENARIO 12-12
Parents complain that children read too few storybooks and watch too much television nowadays.A
survey of 1,000 children reveals the following information on average time spent watching TV and
average time spent reading storybooks
Referring to Scenario 12-12, to test whether there is any relationship between average time
Spent watching TV and average time spent reading story books, the value of the measured test
Statistic is
A) -12.59
B) 1.61
C) 481.49
D) 1,368.06
Question
SCENARIO 12-10
Referring to Scenario 12-10, a test was conducted to determine if a relationship exists between
Defect rate and years of experience.Which of the following p-values would indicate that defect
Rate and years of experience are dependent? Assume you are testing at
= 0)05.
A) 0.045
B) 0.055
C) 0.074
D) 0.080
Question
SCENARIO 12-13
Recent studies have found that American children are more obese than in the past.The amount of
time children spent watching television has received much of the blame.A survey of 100 ten-year-
olds revealed the following with regards to weights and average number of hours a day spent
watching television.We are interested in testing whether the mean number of hours spent watching
TV and weights are independent at 1% level of significance.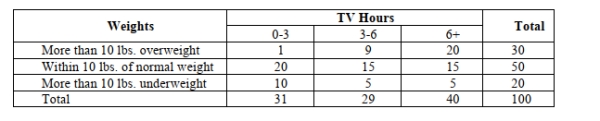
12-30 Chi-Square and Nonparametric Tests
Referring to Scenario 12-13, if there is no connection between weights and average number of
Hours spent watching TV, we should expect how many children to be spending no more than 6
Hours on average watching TV and are more than 10 lbs.underweight?
A) 5.8
B) 6.2
C) 8
D) 12
Question
SCENARIO 12-12
Parents complain that children read too few storybooks and watch too much television nowadays.A
survey of 1,000 children reveals the following information on average time spent watching TV and
average time spent reading storybooks
Referring to Scenario 12-12, if the null hypothesis of no connection between time spent
Watching TV and time spent reading story books is true, how many children watching less than 2
Hours of TV and reading no more than 2 hours of story books on average can we expect?
A) 35.69
B) 227.23
C) 262.91
D) 969.75
Question
SCENARIO 12-11
The director of admissions at a state college is interested in seeing if admissions status (admitted,
waiting list, denied admission)at his college is independent of the type of community in which an
applicant resides.He takes a sample of recent admissions decisions and forms the following table: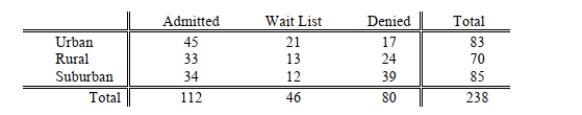 He will use this table to do a chi-square test of independence with a level of significance of 0.01.
True or False: Referring to Scenario 12-11, the null hypothesis will be rejected.
The director of admissions at a state college is interested in seeing if admissions status (admitted,
waiting list, denied admission)at his college is independent of the type of community in which an
applicant resides.He takes a sample of recent admissions decisions and forms the following table:
He will use this table to do a chi-square test of independence with a level of significance of 0.01.True or False: Referring to Scenario 12-11, the null hypothesis will be rejected.
Question
SCENARIO 12-11
The director of admissions at a state college is interested in seeing if admissions status (admitted,
waiting list, denied admission)at his college is independent of the type of community in which an
applicant resides.He takes a sample of recent admissions decisions and forms the following table: He will use this table to do a chi-square test of independence with a level of significance of 0.01.
True or False: Referring to Scenario 12-11, the null hypothesis claims that "there is no
association between admission status at the college and the type of community in which an
applicant resides."
The director of admissions at a state college is interested in seeing if admissions status (admitted,
waiting list, denied admission)at his college is independent of the type of community in which an
applicant resides.He takes a sample of recent admissions decisions and forms the following table:
He will use this table to do a chi-square test of independence with a level of significance of 0.01.True or False: Referring to Scenario 12-11, the null hypothesis claims that "there is no
association between admission status at the college and the type of community in which an
applicant resides."
Question
SCENARIO 12-11
The director of admissions at a state college is interested in seeing if admissions status (admitted,
waiting list, denied admission)at his college is independent of the type of community in which an
applicant resides.He takes a sample of recent admissions decisions and forms the following table: He will use this table to do a chi-square test of independence with a level of significance of 0.01.
True or False: Referring to Scenario 12-11, the decision made suggests that admissions status
at the college is independent of the type of community in which an applicant resides.
The director of admissions at a state college is interested in seeing if admissions status (admitted,
waiting list, denied admission)at his college is independent of the type of community in which an
applicant resides.He takes a sample of recent admissions decisions and forms the following table:
He will use this table to do a chi-square test of independence with a level of significance of 0.01.True or False: Referring to Scenario 12-11, the decision made suggests that admissions status
at the college is independent of the type of community in which an applicant resides.
Question
Question
SCENARIO 12-12
Parents complain that children read too few storybooks and watch too much television nowadays.A
survey of 1,000 children reveals the following information on average time spent watching TV and
average time spent reading storybooks
Referring to Scenario 12-12, if the null hypothesis of no connection between time spent
Watching TV and time spent reading story books is true, how many children watching less than 2
Hours of TV and reading more than 2 hours of story books on average can we expect?
A) 42.09
B) 155.25
C) 262.92
D) 987.75
Question
SCENARIO 12-12
Parents complain that children read too few storybooks and watch too much television nowadays.A
survey of 1,000 children reveals the following information on average time spent watching TV and
average time spent reading storybooks
Referring to Scenario 12-12, how many children in the survey spent less than 2 hours watching
TV and no more than 2 hours reading storybooks on average?
A) 8
B) 130
C) 175
D) 687
Question
SCENARIO 12-11
The director of admissions at a state college is interested in seeing if admissions status (admitted,
waiting list, denied admission)at his college is independent of the type of community in which an
applicant resides.He takes a sample of recent admissions decisions and forms the following table: He will use this table to do a chi-square test of independence with a level of significance of 0.01.
True or False: Referring to Scenario 12-11, the alternative hypothesis claims that "there is
some connection between admission status at the college and the type of community in which an
applicant resides."
The director of admissions at a state college is interested in seeing if admissions status (admitted,
waiting list, denied admission)at his college is independent of the type of community in which an
applicant resides.He takes a sample of recent admissions decisions and forms the following table:
He will use this table to do a chi-square test of independence with a level of significance of 0.01.True or False: Referring to Scenario 12-11, the alternative hypothesis claims that "there is
some connection between admission status at the college and the type of community in which an
applicant resides."
Question
SCENARIO 12-12
Parents complain that children read too few storybooks and watch too much television nowadays.A
survey of 1,000 children reveals the following information on average time spent watching TV and
average time spent reading storybooks
Referring to Scenario 12-12, how many children in the survey spent less than 2 hours watching
TV and more than 2 hours reading story books on average?
A) 8
B) 130
C) 175
D) 687
Question
SCENARIO 12-12
Parents complain that children read too few storybooks and watch too much television nowadays.A
survey of 1,000 children reveals the following information on average time spent watching TV and
average time spent reading storybooks
Referring to Scenario 12-12, we want to test whether there is any relationship between average
Time spent watching TV and average time spent reading storybooks.Suppose the value of the
Test statistic was 164 (which is not the correct answer)and the critical value was 19.00 (which is
Not the correct answer), then we could conclude that
A) There is a connection between time spent reading storybooks and time spent watching TV.
B) There is no connection between time spent reading storybooks and time spent watching TV.
C) More time spent reading storybooks leads to less time spent watching TV.
D) More time spent watching TV leads to less time spent reading storybooks.
Question
SCENARIO 12-11
The director of admissions at a state college is interested in seeing if admissions status (admitted,
waiting list, denied admission)at his college is independent of the type of community in which an
applicant resides.He takes a sample of recent admissions decisions and forms the following table: He will use this table to do a chi-square test of independence with a level of significance of 0.01.
Referring to Scenario 12-11, the test will involve _________ degrees of freedom.
The director of admissions at a state college is interested in seeing if admissions status (admitted,
waiting list, denied admission)at his college is independent of the type of community in which an
applicant resides.He takes a sample of recent admissions decisions and forms the following table:
He will use this table to do a chi-square test of independence with a level of significance of 0.01.Referring to Scenario 12-11, the test will involve _________ degrees of freedom.
Question
Question
SCENARIO 12-11
The director of admissions at a state college is interested in seeing if admissions status (admitted,
waiting list, denied admission)at his college is independent of the type of community in which an
applicant resides.He takes a sample of recent admissions decisions and forms the following table: He will use this table to do a chi-square test of independence with a level of significance of 0.01.
True or False: Referring to Scenario 12-11, the same decision would be made with this test if
the level of significance had been 0.005.
The director of admissions at a state college is interested in seeing if admissions status (admitted,
waiting list, denied admission)at his college is independent of the type of community in which an
applicant resides.He takes a sample of recent admissions decisions and forms the following table:
He will use this table to do a chi-square test of independence with a level of significance of 0.01.True or False: Referring to Scenario 12-11, the same decision would be made with this test if
the level of significance had been 0.005.
Question
SCENARIO 12-13
Recent studies have found that American children are more obese than in the past.The amount of
time children spent watching television has received much of the blame.A survey of 100 ten-year-
olds revealed the following with regards to weights and average number of hours a day spent
watching television.We are interested in testing whether the mean number of hours spent watching
TV and weights are independent at 1% level of significance.
12-30 Chi-Square and Nonparametric Tests
Referring to Scenario 12-13, if there is no connection between weights and average number of
Hours spent watching TV, we should expect how many children to be spending 3-6 hours on
Average watching TV and are more than 10 lbs.underweight?
A) 5
B) 5.8
C) 6.2
D) 8
Question
SCENARIO 12-11
The director of admissions at a state college is interested in seeing if admissions status (admitted,
waiting list, denied admission)at his college is independent of the type of community in which an
applicant resides.He takes a sample of recent admissions decisions and forms the following table: He will use this table to do a chi-square test of independence with a level of significance of 0.01.
True or False: Referring to Scenario 12-11, the same decision would be made with this test if
the level of significance had been 0.05.
The director of admissions at a state college is interested in seeing if admissions status (admitted,
waiting list, denied admission)at his college is independent of the type of community in which an
applicant resides.He takes a sample of recent admissions decisions and forms the following table:
He will use this table to do a chi-square test of independence with a level of significance of 0.01.True or False: Referring to Scenario 12-11, the same decision would be made with this test if
the level of significance had been 0.05.
Question
SCENARIO 12-11
The director of admissions at a state college is interested in seeing if admissions status (admitted,
waiting list, denied admission)at his college is independent of the type of community in which an
applicant resides.He takes a sample of recent admissions decisions and forms the following table: He will use this table to do a chi-square test of independence with a level of significance of 0.01.
True or False: Referring to Scenario 12-11, the p-value of this test is greater than 0.01.
The director of admissions at a state college is interested in seeing if admissions status (admitted,
waiting list, denied admission)at his college is independent of the type of community in which an
applicant resides.He takes a sample of recent admissions decisions and forms the following table:
He will use this table to do a chi-square test of independence with a level of significance of 0.01.True or False: Referring to Scenario 12-11, the p-value of this test is greater than 0.01.

Unlock Deck
Sign up to unlock the cards in this deck!
Unlock Deck
Unlock Deck
1/100
Play
Full screen (f)
Deck 12: Chi-Square and Nonparametric
1
SCENARIO 12-2
The dean of a college is interested in the proportion of graduates from his college who have a job
offer on graduation day.He is particularly interested in seeing if there is a difference in this
proportion for accounting and economics majors.In a random sample of 100 of each type of major at
graduation, he found that 65 accounting majors and 52 economics majors had job offers.If the
accounting majors are designated as "Group 1" and the economics majors are designated as "Group
2," perform the appropriate hypothesis test using a level of significance of 0.05.
True or False: Referring to Scenario 12-2, the null hypothesis should be rejected.
False
2
True or False: A test for whether one proportion is higher than the other can be performed using
the chi-square distribution.
the chi-square distribution.
False
3
SCENARIO 12-2
The dean of a college is interested in the proportion of graduates from his college who have a job
offer on graduation day.He is particularly interested in seeing if there is a difference in this
proportion for accounting and economics majors.In a random sample of 100 of each type of major at
graduation, he found that 65 accounting majors and 52 economics majors had job offers.If the
accounting majors are designated as "Group 1" and the economics majors are designated as "Group
2," perform the appropriate hypothesis test using a level of significance of 0.05.
True or False: Referring to Scenario 12-2, the same decision would be made with this test if the
level of significance had been 0.01 rather than 0.05.
True
4
SCENARIO 12-4
A computer used by a 24-hour banking service is supposed to randomly assign each transaction to
one of 5 memory locations.A check at the end of a day's transactions gave the counts shown in the
table to each of the 5 memory locations, along with the number of reported errors. The bank manager wanted to test whether the proportion of errors in transactions assigned to each of
the 5 memory locations differ.
Referring to Scenario 12-4, which test would be used to properly analyze the data in this
Experiment?
A computer used by a 24-hour banking service is supposed to randomly assign each transaction to
one of 5 memory locations.A check at the end of a day's transactions gave the counts shown in the
table to each of the 5 memory locations, along with the number of reported errors.
The bank manager wanted to test whether the proportion of errors in transactions assigned to each ofthe 5 memory locations differ.
Referring to Scenario 12-4, which test would be used to properly analyze the data in this
Experiment?
Unlock Deck
Unlock for access to all 100 flashcards in this deck.
Unlock Deck
k this deck
5
SCENARIO 12-1
Referring to Scenario 12-1, the company tests to determine at the 0.05 level whether the
Population proportion has changed from the previous study.Which of the following is most
Correct?
A) Reject the null hypothesis and conclude that the proportion of employees who are interested in a self-improvement course has changed over the intervening 10 years.
B) Do not reject the null hypothesis and conclude that the proportion of employees who are interested in a self-improvement course has not changed over the intervening 10 years.
C) Reject the null hypothesis and conclude that the proportion of employees who are interested in a self-improvement course has increased over the intervening 10 years.
D) Do not reject the null hypothesis and conclude that the proportion of employees who are interested in a self-improvement course has increased over the intervening 10 years.
Unlock Deck
Unlock for access to all 100 flashcards in this deck.
Unlock Deck
k this deck
6
SCENARIO 12-3 She will use this information to perform a chi-square hypothesis test using a level of significance of
True or False: Referring to Scenario 12-3, the decision made suggests that there is a difference
between the proportion of males and females who ride local versus non-local routes.
She will use this information to perform a chi-square hypothesis test using a level of significance ofTrue or False: Referring to Scenario 12-3, the decision made suggests that there is a difference
between the proportion of males and females who ride local versus non-local routes.
Unlock Deck
Unlock for access to all 100 flashcards in this deck.
Unlock Deck
k this deck
7
SCENARIO 12-1
Unlock Deck
Unlock for access to all 100 flashcards in this deck.
Unlock Deck
k this deck
8
SCENARIO 12-2
The dean of a college is interested in the proportion of graduates from his college who have a job
offer on graduation day.He is particularly interested in seeing if there is a difference in this
proportion for accounting and economics majors.In a random sample of 100 of each type of major at
graduation, he found that 65 accounting majors and 52 economics majors had job offers.If the
accounting majors are designated as "Group 1" and the economics majors are designated as "Group
2," perform the appropriate hypothesis test using a level of significance of 0.05.
Unlock Deck
Unlock for access to all 100 flashcards in this deck.
Unlock Deck
k this deck
9
In testing a hypothesis using the test, the theoretical frequencies are based on the
A) null hypothesis.
B) alternative hypothesis.
C) normal distribution.
D) None of the above.
test, the theoretical frequencies are based on theA) null hypothesis.
B) alternative hypothesis.
C) normal distribution.
D) None of the above.
Unlock Deck
Unlock for access to all 100 flashcards in this deck.
Unlock Deck
k this deck
10
SCENARIO 12-1
Unlock Deck
Unlock for access to all 100 flashcards in this deck.
Unlock Deck
k this deck
11
If we use the method of analysis to test for the differences among 4 proportions, the degrees
Of freedom are equal to:
A) 3
B) 4
C) 5
D) 1
method of analysis to test for the differences among 4 proportions, the degreesOf freedom are equal to:
A) 3
B) 4
C) 5
D) 1
Unlock Deck
Unlock for access to all 100 flashcards in this deck.
Unlock Deck
k this deck
12
SCENARIO 12-2
The dean of a college is interested in the proportion of graduates from his college who have a job
offer on graduation day.He is particularly interested in seeing if there is a difference in this
proportion for accounting and economics majors.In a random sample of 100 of each type of major at
graduation, he found that 65 accounting majors and 52 economics majors had job offers.If the
accounting majors are designated as "Group 1" and the economics majors are designated as "Group
2," perform the appropriate hypothesis test using a level of significance of 0.05.
Referring to Scenario 12-2, the null hypothesis will be rejected if the test statistic is ________.
Unlock Deck
Unlock for access to all 100 flashcards in this deck.
Unlock Deck
k this deck
13
SCENARIO 12-2
The dean of a college is interested in the proportion of graduates from his college who have a job
offer on graduation day.He is particularly interested in seeing if there is a difference in this
proportion for accounting and economics majors.In a random sample of 100 of each type of major at
graduation, he found that 65 accounting majors and 52 economics majors had job offers.If the
accounting majors are designated as "Group 1" and the economics majors are designated as "Group
2," perform the appropriate hypothesis test using a level of significance of 0.05.
True or False: Referring to Scenario 12-2, the same decision would be made with this test if the
level of significance had been 0.10 rather than 0.05.
Unlock Deck
Unlock for access to all 100 flashcards in this deck.
Unlock Deck
k this deck
14
SCENARIO 12-2
The dean of a college is interested in the proportion of graduates from his college who have a job
offer on graduation day.He is particularly interested in seeing if there is a difference in this
proportion for accounting and economics majors.In a random sample of 100 of each type of major at
graduation, he found that 65 accounting majors and 52 economics majors had job offers.If the
accounting majors are designated as "Group 1" and the economics majors are designated as "Group
2," perform the appropriate hypothesis test using a level of significance of 0.05.
Referring to Scenario 12-2, the value of the test statistic is ________.
Unlock Deck
Unlock for access to all 100 flashcards in this deck.
Unlock Deck
k this deck
15
True or False: The squared difference between the observed and theoretical frequencies should
be large if there is no significant difference between the proportions.
be large if there is no significant difference between the proportions.
Unlock Deck
Unlock for access to all 100 flashcards in this deck.
Unlock Deck
k this deck
16
If we wish to determine whether there is evidence that the proportion of items of interest is the
Same in group 1 as in group 2, the appropriate test to use is
Same in group 1 as in group 2, the appropriate test to use is
Unlock Deck
Unlock for access to all 100 flashcards in this deck.
Unlock Deck
k this deck
17
True or False: A test for the difference between two proportions can be performed using the chi-
square distribution.
square distribution.
Unlock Deck
Unlock for access to all 100 flashcards in this deck.
Unlock Deck
k this deck
18
SCENARIO 12-1
Unlock Deck
Unlock for access to all 100 flashcards in this deck.
Unlock Deck
k this deck
19
SCENARIO 12-3 She will use this information to perform a chi-square hypothesis test using a level of significance of
True or False: Referring to Scenario 12-3, the null hypothesis will be rejected.
She will use this information to perform a chi-square hypothesis test using a level of significance ofTrue or False: Referring to Scenario 12-3, the null hypothesis will be rejected.
Unlock Deck
Unlock for access to all 100 flashcards in this deck.
Unlock Deck
k this deck
20
True or False: In testing the difference between two proportions using the normal distribution,
we may use either a one-tail Chi-square test or two-tail Z test.
we may use either a one-tail Chi-square test or two-tail Z test.
Unlock Deck
Unlock for access to all 100 flashcards in this deck.
Unlock Deck
k this deck
21
SCENARIO 12-5
Four surgical procedures currently are used to install pacemakers.If the patient does not need to
return for follow-up surgery, the operation is called a "clear" operation.A heart center wants to
compare the proportion of clear operations for the 4 procedures, and collects the following numbers
of patients from their own records: They will use this information to test for a difference among the proportion of clear operations using
a chi-square test with a level of significance of 0.05.
True or False: Referring to Scenario 12-5, the decision made suggests that the 4 procedures do
not all have the same proportion of clear operations.
Four surgical procedures currently are used to install pacemakers.If the patient does not need to
return for follow-up surgery, the operation is called a "clear" operation.A heart center wants to
compare the proportion of clear operations for the 4 procedures, and collects the following numbers
of patients from their own records:
They will use this information to test for a difference among the proportion of clear operations usinga chi-square test with a level of significance of 0.05.
True or False: Referring to Scenario 12-5, the decision made suggests that the 4 procedures do
not all have the same proportion of clear operations.
Unlock Deck
Unlock for access to all 100 flashcards in this deck.
Unlock Deck
k this deck
22
SCENARIO 12-5
Four surgical procedures currently are used to install pacemakers.If the patient does not need to
return for follow-up surgery, the operation is called a "clear" operation.A heart center wants to
compare the proportion of clear operations for the 4 procedures, and collects the following numbers
of patients from their own records: They will use this information to test for a difference among the proportion of clear operations using
a chi-square test with a level of significance of 0.05.
Referring to Scenario 12-5, the test will involve _________ degrees of freedom.
Four surgical procedures currently are used to install pacemakers.If the patient does not need to
return for follow-up surgery, the operation is called a "clear" operation.A heart center wants to
compare the proportion of clear operations for the 4 procedures, and collects the following numbers
of patients from their own records:
They will use this information to test for a difference among the proportion of clear operations usinga chi-square test with a level of significance of 0.05.
Referring to Scenario 12-5, the test will involve _________ degrees of freedom.
Unlock Deck
Unlock for access to all 100 flashcards in this deck.
Unlock Deck
k this deck
23
Scenario 12-6
According to an article in Marketing News, fewer checks are being written at the grocery store
checkout than in the past.To determine whether there is a difference in the proportion of shoppers
who pay by check among three consecutive years at a 0.05 level of significance, the results of a
survey of 500 shoppers in three consecutive years are obtained and presented below.
Referring to Scenario 12-6, what are the degrees of freedom of the test statistic?
Unlock Deck
Unlock for access to all 100 flashcards in this deck.
Unlock Deck
k this deck
24
SCENARIO 12-7 .
Referring to Scenario 12-7, the test will involve _________ degrees of freedom.
.Referring to Scenario 12-7, the test will involve _________ degrees of freedom.
Unlock Deck
Unlock for access to all 100 flashcards in this deck.
Unlock Deck
k this deck
25
SCENARIO 12-7 .
Referring to Scenario 12-7, the expected cell frequency for the Hong Kong/Yes cell is
__________.
.Referring to Scenario 12-7, the expected cell frequency for the Hong Kong/Yes cell is
__________.
Unlock Deck
Unlock for access to all 100 flashcards in this deck.
Unlock Deck
k this deck
26
Scenario 12-6
According to an article in Marketing News, fewer checks are being written at the grocery store
checkout than in the past.To determine whether there is a difference in the proportion of shoppers
who pay by check among three consecutive years at a 0.05 level of significance, the results of a
survey of 500 shoppers in three consecutive years are obtained and presented below.
True or False: Referring to Scenario 12-6, the assumptions needed to perform the test are
satisfied.
Unlock Deck
Unlock for access to all 100 flashcards in this deck.
Unlock Deck
k this deck
27
SCENARIO 12-5
Four surgical procedures currently are used to install pacemakers.If the patient does not need to
return for follow-up surgery, the operation is called a "clear" operation.A heart center wants to
compare the proportion of clear operations for the 4 procedures, and collects the following numbers
of patients from their own records: They will use this information to test for a difference among the proportion of clear operations using
a chi-square test with a level of significance of 0.05.
True or False: Referring to Scenario 12-5, the null hypothesis will be rejected.
Four surgical procedures currently are used to install pacemakers.If the patient does not need to
return for follow-up surgery, the operation is called a "clear" operation.A heart center wants to
compare the proportion of clear operations for the 4 procedures, and collects the following numbers
of patients from their own records:
They will use this information to test for a difference among the proportion of clear operations usinga chi-square test with a level of significance of 0.05.
True or False: Referring to Scenario 12-5, the null hypothesis will be rejected.
Unlock Deck
Unlock for access to all 100 flashcards in this deck.
Unlock Deck
k this deck
28
Scenario 12-6
According to an article in Marketing News, fewer checks are being written at the grocery store
checkout than in the past.To determine whether there is a difference in the proportion of shoppers
who pay by check among three consecutive years at a 0.05 level of significance, the results of a
survey of 500 shoppers in three consecutive years are obtained and presented below.
True or False: Referring to Scenario 12-6, there is sufficient evidence to conclude that the
proportions between year 1 and year 2 are different at a 0.05 level of significance.
Unlock Deck
Unlock for access to all 100 flashcards in this deck.
Unlock Deck
k this deck
29
Scenario 12-6
According to an article in Marketing News, fewer checks are being written at the grocery store
checkout than in the past.To determine whether there is a difference in the proportion of shoppers
who pay by check among three consecutive years at a 0.05 level of significance, the results of a
survey of 500 shoppers in three consecutive years are obtained and presented below.
Referring to Scenario 12-6, what is the expected number of shoppers who pay by check in year
1 if there is no difference in the proportion of shoppers who pay by check among the three years?
Unlock Deck
Unlock for access to all 100 flashcards in this deck.
Unlock Deck
k this deck
30
SCENARIO 12-4
A computer used by a 24-hour banking service is supposed to randomly assign each transaction to
one of 5 memory locations.A check at the end of a day's transactions gave the counts shown in the
table to each of the 5 memory locations, along with the number of reported errors. The bank manager wanted to test whether the proportion of errors in transactions assigned to each of
the 5 memory locations differ.
Referring to Scenario 12-4, the critical value of the test statistic at 1% level of significance is
A) 7.7794
B) 13.2767
C) 20.0902
D) 23.2093
A computer used by a 24-hour banking service is supposed to randomly assign each transaction to
one of 5 memory locations.A check at the end of a day's transactions gave the counts shown in the
table to each of the 5 memory locations, along with the number of reported errors.
The bank manager wanted to test whether the proportion of errors in transactions assigned to each ofthe 5 memory locations differ.
Referring to Scenario 12-4, the critical value of the test statistic at 1% level of significance is
A) 7.7794
B) 13.2767
C) 20.0902
D) 23.2093
Unlock Deck
Unlock for access to all 100 flashcards in this deck.
Unlock Deck
k this deck
31
Scenario 12-6
According to an article in Marketing News, fewer checks are being written at the grocery store
checkout than in the past.To determine whether there is a difference in the proportion of shoppers
who pay by check among three consecutive years at a 0.05 level of significance, the results of a
survey of 500 shoppers in three consecutive years are obtained and presented below.
True or False: Referring to Scenario 12-6, there is insufficient evidence to conclude that the
proportions between year 1 and year 3 are different at a 0.05 level of significance.
Unlock Deck
Unlock for access to all 100 flashcards in this deck.
Unlock Deck
k this deck
32
Scenario 12-6
According to an article in Marketing News, fewer checks are being written at the grocery store
checkout than in the past.To determine whether there is a difference in the proportion of shoppers
who pay by check among three consecutive years at a 0.05 level of significance, the results of a
survey of 500 shoppers in three consecutive years are obtained and presented below.
Referring to Scenario 12-6, what is the expected number of shoppers who do not pay by check
in year 3 if there is no difference in the proportion of shoppers who pay by check among the
three years?
Unlock Deck
Unlock for access to all 100 flashcards in this deck.
Unlock Deck
k this deck
33
Scenario 12-6
According to an article in Marketing News, fewer checks are being written at the grocery store
checkout than in the past.To determine whether there is a difference in the proportion of shoppers
who pay by check among three consecutive years at a 0.05 level of significance, the results of a
survey of 500 shoppers in three consecutive years are obtained and presented below.
Unlock Deck
Unlock for access to all 100 flashcards in this deck.
Unlock Deck
k this deck
34
SCENARIO 12-4
A computer used by a 24-hour banking service is supposed to randomly assign each transaction to
one of 5 memory locations.A check at the end of a day's transactions gave the counts shown in the
table to each of the 5 memory locations, along with the number of reported errors. The bank manager wanted to test whether the proportion of errors in transactions assigned to each of
the 5 memory locations differ.
Referring to Scenario 12-4, at 1% level of significance
A) there is sufficient evidence to conclude that the proportions of errors in transactions assigned to each of the 5 memory locations are all different.
B) there is insufficient evidence to conclude that the proportions of errors in transactions assigned to each of the 5 memory locations are all different.
C) there is sufficient evidence to conclude that the proportion of errors in transactions assigned to each of the 5 memory locations are not all the same.
D) there is insufficient evidence to conclude that the proportion of errors in transactions assigned to each of the 5 memory locations are not all the same.
A computer used by a 24-hour banking service is supposed to randomly assign each transaction to
one of 5 memory locations.A check at the end of a day's transactions gave the counts shown in the
table to each of the 5 memory locations, along with the number of reported errors.
The bank manager wanted to test whether the proportion of errors in transactions assigned to each ofthe 5 memory locations differ.
Referring to Scenario 12-4, at 1% level of significance
A) there is sufficient evidence to conclude that the proportions of errors in transactions assigned to each of the 5 memory locations are all different.
B) there is insufficient evidence to conclude that the proportions of errors in transactions assigned to each of the 5 memory locations are all different.
C) there is sufficient evidence to conclude that the proportion of errors in transactions assigned to each of the 5 memory locations are not all the same.
D) there is insufficient evidence to conclude that the proportion of errors in transactions assigned to each of the 5 memory locations are not all the same.
Unlock Deck
Unlock for access to all 100 flashcards in this deck.
Unlock Deck
k this deck
35
Scenario 12-6
According to an article in Marketing News, fewer checks are being written at the grocery store
checkout than in the past.To determine whether there is a difference in the proportion of shoppers
who pay by check among three consecutive years at a 0.05 level of significance, the results of a
survey of 500 shoppers in three consecutive years are obtained and presented below.
True or False: Referring to Scenario 12-6, there is sufficient evidence to conclude that the
proportions between year 2 and year 3 are different at a 0.05 level of significance.
Unlock Deck
Unlock for access to all 100 flashcards in this deck.
Unlock Deck
k this deck
36
True or False: Referring to Scenario 12-5, there is sufficient evidence to conclude that the
proportions between procedure C and procedure D are different at a 0.05 level of significance.
proportions between procedure C and procedure D are different at a 0.05 level of significance.
Unlock Deck
Unlock for access to all 100 flashcards in this deck.
Unlock Deck
k this deck
37
Scenario 12-6
According to an article in Marketing News, fewer checks are being written at the grocery store
checkout than in the past.To determine whether there is a difference in the proportion of shoppers
who pay by check among three consecutive years at a 0.05 level of significance, the results of a
survey of 500 shoppers in three consecutive years are obtained and presented below.
Unlock Deck
Unlock for access to all 100 flashcards in this deck.
Unlock Deck
k this deck
38
SCENARIO 12-4
A computer used by a 24-hour banking service is supposed to randomly assign each transaction to
one of 5 memory locations.A check at the end of a day's transactions gave the counts shown in the
table to each of the 5 memory locations, along with the number of reported errors. The bank manager wanted to test whether the proportion of errors in transactions assigned to each of
the 5 memory locations differ.
Referring to Scenario 12-4, the degrees of freedom of the test statistic is
A) 4
B) 8
C) 10
D) 448
A computer used by a 24-hour banking service is supposed to randomly assign each transaction to
one of 5 memory locations.A check at the end of a day's transactions gave the counts shown in the
table to each of the 5 memory locations, along with the number of reported errors.
The bank manager wanted to test whether the proportion of errors in transactions assigned to each ofthe 5 memory locations differ.
Referring to Scenario 12-4, the degrees of freedom of the test statistic is
A) 4
B) 8
C) 10
D) 448
Unlock Deck
Unlock for access to all 100 flashcards in this deck.
Unlock Deck
k this deck
39
SCENARIO 12-5
Four surgical procedures currently are used to install pacemakers.If the patient does not need to
return for follow-up surgery, the operation is called a "clear" operation.A heart center wants to
compare the proportion of clear operations for the 4 procedures, and collects the following numbers
of patients from their own records: They will use this information to test for a difference among the proportion of clear operations using
a chi-square test with a level of significance of 0.05.
True or False: Referring to Scenario 12-5, the decision made suggests that the 4 procedures all
have different proportions of clear operations.
Four surgical procedures currently are used to install pacemakers.If the patient does not need to
return for follow-up surgery, the operation is called a "clear" operation.A heart center wants to
compare the proportion of clear operations for the 4 procedures, and collects the following numbers
of patients from their own records:
They will use this information to test for a difference among the proportion of clear operations usinga chi-square test with a level of significance of 0.05.
True or False: Referring to Scenario 12-5, the decision made suggests that the 4 procedures all
have different proportions of clear operations.
Unlock Deck
Unlock for access to all 100 flashcards in this deck.
Unlock Deck
k this deck
40
SCENARIO 12-4
A computer used by a 24-hour banking service is supposed to randomly assign each transaction to
one of 5 memory locations.A check at the end of a day's transactions gave the counts shown in the
table to each of the 5 memory locations, along with the number of reported errors. The bank manager wanted to test whether the proportion of errors in transactions assigned to each of
the 5 memory locations differ.
Referring to Scenario 12-4, the calculated value of the test statistic is
A) -0.1777
B) -0.0185
C) 1.4999
D) 1.5190
A computer used by a 24-hour banking service is supposed to randomly assign each transaction to
one of 5 memory locations.A check at the end of a day's transactions gave the counts shown in the
table to each of the 5 memory locations, along with the number of reported errors.
The bank manager wanted to test whether the proportion of errors in transactions assigned to each ofthe 5 memory locations differ.
Referring to Scenario 12-4, the calculated value of the test statistic is
A) -0.1777
B) -0.0185
C) 1.4999
D) 1.5190
Unlock Deck
Unlock for access to all 100 flashcards in this deck.
Unlock Deck
k this deck
41
SCENARIO 12-7 .
True or False: Referring to Scenario 12-7, the decision made suggests that the 3 cities all have
different proportions of hotels that correctly post minibar charges.
.True or False: Referring to Scenario 12-7, the decision made suggests that the 3 cities all have
different proportions of hotels that correctly post minibar charges.
Unlock Deck
Unlock for access to all 100 flashcards in this deck.
Unlock Deck
k this deck
42
SCENARIO 12-9
Many companies use well-known celebrities as spokespersons in their TV advertisements.A study
was conducted to determine whether brand awareness of female TV viewers and the gender of the
spokesperson are independent.Each in a sample of 300 female TV viewers was asked to identify a
product advertised by a celebrity spokesperson.The gender of the spokesperson and whether or not
the viewer could identify the product was recorded.The numbers in each category are given below.
Referring to Scenario 12-9, at 5% level of significance, the conclusion is that
A) brand awareness of female TV viewers and the gender of the spokesperson are independent.
B) brand awareness of female TV viewers and the gender of the spokesperson are not independent.
C) brand awareness of female TV viewers and the gender of the spokesperson are related.
D) Both (b) and (c) .
Unlock Deck
Unlock for access to all 100 flashcards in this deck.
Unlock Deck
k this deck
43
SCENARIO 12-8
Referring to Scenario 12-8, at 5% level of significance, there is sufficient evidence to conclude
That
A) use of seat belts in motor vehicles is related to the educational status of the parents.
B) use of seat belts in motor vehicles depends on the educational status of the parents.
C) use of seat belts in motor vehicles is associated with the educational status of the parents.
D) All of the above.
Unlock Deck
Unlock for access to all 100 flashcards in this deck.
Unlock Deck
k this deck
44
SCENARIO 12-8
Referring to Scenario 12-8, at 5% level of significance, the critical value of the test statistic is
A) 3.8415
B) 5.9914
C) 9.4877
D) 13.2767
Referring to Scenario 12-8, at 5% level of significance, the critical value of the test statistic is
A) 3.8415
B) 5.9914
C) 9.4877
D) 13.2767
Unlock Deck
Unlock for access to all 100 flashcards in this deck.
Unlock Deck
k this deck
45
SCENARIO 12-10
Referring to Scenario 12-10, what is the expected number of employees with less than 1 year of
Training time and a high defect rate?
A) 4.17
B) 4.60
C) 5.28
D) 9.17
Referring to Scenario 12-10, what is the expected number of employees with less than 1 year of
Training time and a high defect rate?
A) 4.17
B) 4.60
C) 5.28
D) 9.17
Unlock Deck
Unlock for access to all 100 flashcards in this deck.
Unlock Deck
k this deck
46
SCENARIO 12-10
Referring to Scenario 12-10, find the rejection region necessary for testing at the 0.05 level of
Significance whether there is a relationship between defect rate and years of experience.
Referring to Scenario 12-10, find the rejection region necessary for testing at the 0.05 level of
Significance whether there is a relationship between defect rate and years of experience.
Unlock Deck
Unlock for access to all 100 flashcards in this deck.
Unlock Deck
k this deck
47
SCENARIO 12-9
Many companies use well-known celebrities as spokespersons in their TV advertisements.A study
was conducted to determine whether brand awareness of female TV viewers and the gender of the
spokesperson are independent.Each in a sample of 300 female TV viewers was asked to identify a
product advertised by a celebrity spokesperson.The gender of the spokesperson and whether or not
the viewer could identify the product was recorded.The numbers in each category are given below.
Referring to Scenario 12-9, which test would be used to properly analyze the data in this
Experiment?
A) test for independence
B) test for differences among more than two proportions
C) Wilcoxon rank sum test for independent populations
D) Kruskal-Wallis rank test
Many companies use well-known celebrities as spokespersons in their TV advertisements.A study
was conducted to determine whether brand awareness of female TV viewers and the gender of the
spokesperson are independent.Each in a sample of 300 female TV viewers was asked to identify a
product advertised by a celebrity spokesperson.The gender of the spokesperson and whether or not
the viewer could identify the product was recorded.The numbers in each category are given below.
Referring to Scenario 12-9, which test would be used to properly analyze the data in this
Experiment?
A)
test for independenceB)
test for differences among more than two proportionsC) Wilcoxon rank sum test for independent populations
D) Kruskal-Wallis rank test
Unlock Deck
Unlock for access to all 100 flashcards in this deck.
Unlock Deck
k this deck
48
SCENARIO 12-10
Referring to Scenario 12-10, for the cell with 1 to 4 years of training time and a high defect
Rate, what is the contribution to the overall
Statistic for the independence test?
A) 0.36
B) 0.1296
C) 0.015
D) 0.0144
Referring to Scenario 12-10, for the cell with 1 to 4 years of training time and a high defect
Rate, what is the contribution to the overall
Statistic for the independence test?
A) 0.36
B) 0.1296
C) 0.015
D) 0.0144
Unlock Deck
Unlock for access to all 100 flashcards in this deck.
Unlock Deck
k this deck
49
SCENARIO 12-7 .
True or False: Referring to Scenario 12-7, the null hypothesis will be rejected.
.True or False: Referring to Scenario 12-7, the null hypothesis will be rejected.
Unlock Deck
Unlock for access to all 100 flashcards in this deck.
Unlock Deck
k this deck
50
SCENARIO 12-10
Referring to Scenario 12-10, which test would be used to properly analyze the data in this
Experiment to determine whether there is a relationship between defect rate and years of
Experience?
A) test for independence
B) test for differences among more than two proportions
C) Wilcoxon rank sum test for independent populations
D) Kruskal-Wallis rank test
Referring to Scenario 12-10, which test would be used to properly analyze the data in this
Experiment to determine whether there is a relationship between defect rate and years of
Experience?
A)
test for independenceB)
test for differences among more than two proportionsC) Wilcoxon rank sum test for independent populations
D) Kruskal-Wallis rank test
Unlock Deck
Unlock for access to all 100 flashcards in this deck.
Unlock Deck
k this deck
51
SCENARIO 12-10
Referring to Scenario 12-10, what is the expected number of employees with 1 to 4 years of
Training time and a high defect rate?
A) 12.00
B) 8.64
C) 6.67
D) 6.00
Referring to Scenario 12-10, what is the expected number of employees with 1 to 4 years of
Training time and a high defect rate?
A) 12.00
B) 8.64
C) 6.67
D) 6.00
Unlock Deck
Unlock for access to all 100 flashcards in this deck.
Unlock Deck
k this deck
52
SCENARIO 12-9
Many companies use well-known celebrities as spokespersons in their TV advertisements.A study
was conducted to determine whether brand awareness of female TV viewers and the gender of the
spokesperson are independent.Each in a sample of 300 female TV viewers was asked to identify a
product advertised by a celebrity spokesperson.The gender of the spokesperson and whether or not
the viewer could identify the product was recorded.The numbers in each category are given below.
Referring to Scenario 12-9, the calculated test statistic is
A) -0.1006
B) 0.00
C) 5.9418
D) 6.1194
Unlock Deck
Unlock for access to all 100 flashcards in this deck.
Unlock Deck
k this deck
53
SCENARIO 12-9
Many companies use well-known celebrities as spokespersons in their TV advertisements.A study
was conducted to determine whether brand awareness of female TV viewers and the gender of the
spokesperson are independent.Each in a sample of 300 female TV viewers was asked to identify a
product advertised by a celebrity spokesperson.The gender of the spokesperson and whether or not
the viewer could identify the product was recorded.The numbers in each category are given below.
Referring to Scenario 12-9, the degrees of freedom of the test statistic are
A) 1
B) 2
C) 4
D) 299
Unlock Deck
Unlock for access to all 100 flashcards in this deck.
Unlock Deck
k this deck
54
SCENARIO 12-7 .
True or False: Referring to Scenario 12-7, the decision made suggests that the 3 cities do not all
have the same proportion of hotels that correctly post minibar charges.
.True or False: Referring to Scenario 12-7, the decision made suggests that the 3 cities do not all
have the same proportion of hotels that correctly post minibar charges.
Unlock Deck
Unlock for access to all 100 flashcards in this deck.
Unlock Deck
k this deck
55
SCENARIO 12-9
Many companies use well-known celebrities as spokespersons in their TV advertisements.A study
was conducted to determine whether brand awareness of female TV viewers and the gender of the
spokesperson are independent.Each in a sample of 300 female TV viewers was asked to identify a
product advertised by a celebrity spokesperson.The gender of the spokesperson and whether or not
the viewer could identify the product was recorded.The numbers in each category are given below.
Referring to Scenario 12-9, at 5% level of significance, the critical value of the test statistic is
A) 3.8415
B) 5.9914
C) 9.4877
D) 13.2767
Unlock Deck
Unlock for access to all 100 flashcards in this deck.
Unlock Deck
k this deck
56
SCENARIO 12-7 .
Referring to Scenario 12-7, the expected cell frequency for the Paris/No cell is __________.
.Referring to Scenario 12-7, the expected cell frequency for the Paris/No cell is __________.
Unlock Deck
Unlock for access to all 100 flashcards in this deck.
Unlock Deck
k this deck
57
SCENARIO 12-8
Referring to Scenario 12-8, which test would be used to properly analyze the data in this
Experiment?
A) test for independence
B) test for differences among more than two proportions
C) Wilcoxon rank sum test for independent populations
D) Kruskal-Wallis rank test
Referring to Scenario 12-8, which test would be used to properly analyze the data in this
Experiment?
A)
test for independenceB)
test for differences among more than two proportionsC) Wilcoxon rank sum test for independent populations
D) Kruskal-Wallis rank test
Unlock Deck
Unlock for access to all 100 flashcards in this deck.
Unlock Deck
k this deck
58
When testing for independence in a contingency table with 3 rows and 4 columns, there are
________ degrees of freedom.
A) 5
B) 6
C) 7
D) 12
________ degrees of freedom.
A) 5
B) 6
C) 7
D) 12
Unlock Deck
Unlock for access to all 100 flashcards in this deck.
Unlock Deck
k this deck
59
True or False: If we use the chi-square method of analysis to test for the difference between
proportions, we must assume that there are at least 5 observed frequencies in each cell of the
contingency table.
proportions, we must assume that there are at least 5 observed frequencies in each cell of the
contingency table.
Unlock Deck
Unlock for access to all 100 flashcards in this deck.
Unlock Deck
k this deck
60
SCENARIO 12-8
Referring to Scenario 12-8, the calculated test statistic is
A) -0.9991
B) -0.1368
C) 48.1849
D) 72.8063
Referring to Scenario 12-8, the calculated test statistic is
A) -0.9991
B) -0.1368
C) 48.1849
D) 72.8063
Unlock Deck
Unlock for access to all 100 flashcards in this deck.
Unlock Deck
k this deck
61
SCENARIO 12-12
Parents complain that children read too few storybooks and watch too much television nowadays.A
survey of 1,000 children reveals the following information on average time spent watching TV and
average time spent reading storybooks
Referring to Scenario 12-12, suppose we want to constrain the probability of committing a
Type I error to 5% when testing whether there is any relationship between average time spent
Watching TV and average time spent reading story books, the critical value will be
A) 5.991
B) 7.378
C) 12.592
D) 14.449
Unlock Deck
Unlock for access to all 100 flashcards in this deck.
Unlock Deck
k this deck
62
SCENARIO 12-12
Parents complain that children read too few storybooks and watch too much television nowadays.A
survey of 1,000 children reveals the following information on average time spent watching TV and
average time spent reading storybooks
Referring to Scenario 12-12, to test whether there is any relationship between average time
Spent watching TV and average time spent reading story books, the value of the measured test
Statistic is
A) -12.59
B) 1.61
C) 481.49
D) 1,368.06
Unlock Deck
Unlock for access to all 100 flashcards in this deck.
Unlock Deck
k this deck
63
SCENARIO 12-10
Referring to Scenario 12-10, a test was conducted to determine if a relationship exists between
Defect rate and years of experience.Which of the following p-values would indicate that defect
Rate and years of experience are dependent? Assume you are testing at
= 0)05.
A) 0.045
B) 0.055
C) 0.074
D) 0.080
Unlock Deck
Unlock for access to all 100 flashcards in this deck.
Unlock Deck
k this deck
64
SCENARIO 12-13
Recent studies have found that American children are more obese than in the past.The amount of
time children spent watching television has received much of the blame.A survey of 100 ten-year-
olds revealed the following with regards to weights and average number of hours a day spent
watching television.We are interested in testing whether the mean number of hours spent watching
TV and weights are independent at 1% level of significance.
12-30 Chi-Square and Nonparametric Tests
Referring to Scenario 12-13, if there is no connection between weights and average number of
Hours spent watching TV, we should expect how many children to be spending no more than 6
Hours on average watching TV and are more than 10 lbs.underweight?
A) 5.8
B) 6.2
C) 8
D) 12
Unlock Deck
Unlock for access to all 100 flashcards in this deck.
Unlock Deck
k this deck
65
SCENARIO 12-12
Parents complain that children read too few storybooks and watch too much television nowadays.A
survey of 1,000 children reveals the following information on average time spent watching TV and
average time spent reading storybooks
Referring to Scenario 12-12, if the null hypothesis of no connection between time spent
Watching TV and time spent reading story books is true, how many children watching less than 2
Hours of TV and reading no more than 2 hours of story books on average can we expect?
A) 35.69
B) 227.23
C) 262.91
D) 969.75
Unlock Deck
Unlock for access to all 100 flashcards in this deck.
Unlock Deck
k this deck
66
SCENARIO 12-11
The director of admissions at a state college is interested in seeing if admissions status (admitted,
waiting list, denied admission)at his college is independent of the type of community in which an
applicant resides.He takes a sample of recent admissions decisions and forms the following table: He will use this table to do a chi-square test of independence with a level of significance of 0.01.
True or False: Referring to Scenario 12-11, the null hypothesis will be rejected.
The director of admissions at a state college is interested in seeing if admissions status (admitted,
waiting list, denied admission)at his college is independent of the type of community in which an
applicant resides.He takes a sample of recent admissions decisions and forms the following table:
He will use this table to do a chi-square test of independence with a level of significance of 0.01.True or False: Referring to Scenario 12-11, the null hypothesis will be rejected.
Unlock Deck
Unlock for access to all 100 flashcards in this deck.
Unlock Deck
k this deck
67
SCENARIO 12-11
The director of admissions at a state college is interested in seeing if admissions status (admitted,
waiting list, denied admission)at his college is independent of the type of community in which an
applicant resides.He takes a sample of recent admissions decisions and forms the following table: He will use this table to do a chi-square test of independence with a level of significance of 0.01.
True or False: Referring to Scenario 12-11, the null hypothesis claims that "there is no
association between admission status at the college and the type of community in which an
applicant resides."
The director of admissions at a state college is interested in seeing if admissions status (admitted,
waiting list, denied admission)at his college is independent of the type of community in which an
applicant resides.He takes a sample of recent admissions decisions and forms the following table:
He will use this table to do a chi-square test of independence with a level of significance of 0.01.True or False: Referring to Scenario 12-11, the null hypothesis claims that "there is no
association between admission status at the college and the type of community in which an
applicant resides."
Unlock Deck
Unlock for access to all 100 flashcards in this deck.
Unlock Deck
k this deck
68
SCENARIO 12-11
The director of admissions at a state college is interested in seeing if admissions status (admitted,
waiting list, denied admission)at his college is independent of the type of community in which an
applicant resides.He takes a sample of recent admissions decisions and forms the following table: He will use this table to do a chi-square test of independence with a level of significance of 0.01.
True or False: Referring to Scenario 12-11, the decision made suggests that admissions status
at the college is independent of the type of community in which an applicant resides.
The director of admissions at a state college is interested in seeing if admissions status (admitted,
waiting list, denied admission)at his college is independent of the type of community in which an
applicant resides.He takes a sample of recent admissions decisions and forms the following table:
He will use this table to do a chi-square test of independence with a level of significance of 0.01.True or False: Referring to Scenario 12-11, the decision made suggests that admissions status
at the college is independent of the type of community in which an applicant resides.
Unlock Deck
Unlock for access to all 100 flashcards in this deck.
Unlock Deck
k this deck
69
True or False: The chi-square test of independence requires that the expected frequency in each
cell to be at least 1.
cell to be at least 1.
Unlock Deck
Unlock for access to all 100 flashcards in this deck.
Unlock Deck
k this deck
70
SCENARIO 12-12
Parents complain that children read too few storybooks and watch too much television nowadays.A
survey of 1,000 children reveals the following information on average time spent watching TV and
average time spent reading storybooks
Referring to Scenario 12-12, if the null hypothesis of no connection between time spent
Watching TV and time spent reading story books is true, how many children watching less than 2
Hours of TV and reading more than 2 hours of story books on average can we expect?
A) 42.09
B) 155.25
C) 262.92
D) 987.75
Unlock Deck
Unlock for access to all 100 flashcards in this deck.
Unlock Deck
k this deck
71
SCENARIO 12-12
Parents complain that children read too few storybooks and watch too much television nowadays.A
survey of 1,000 children reveals the following information on average time spent watching TV and
average time spent reading storybooks
Referring to Scenario 12-12, how many children in the survey spent less than 2 hours watching
TV and no more than 2 hours reading storybooks on average?
A) 8
B) 130
C) 175
D) 687
Unlock Deck
Unlock for access to all 100 flashcards in this deck.
Unlock Deck
k this deck
72
SCENARIO 12-11
The director of admissions at a state college is interested in seeing if admissions status (admitted,
waiting list, denied admission)at his college is independent of the type of community in which an
applicant resides.He takes a sample of recent admissions decisions and forms the following table: He will use this table to do a chi-square test of independence with a level of significance of 0.01.
True or False: Referring to Scenario 12-11, the alternative hypothesis claims that "there is
some connection between admission status at the college and the type of community in which an
applicant resides."
The director of admissions at a state college is interested in seeing if admissions status (admitted,
waiting list, denied admission)at his college is independent of the type of community in which an
applicant resides.He takes a sample of recent admissions decisions and forms the following table:
He will use this table to do a chi-square test of independence with a level of significance of 0.01.True or False: Referring to Scenario 12-11, the alternative hypothesis claims that "there is
some connection between admission status at the college and the type of community in which an
applicant resides."
Unlock Deck
Unlock for access to all 100 flashcards in this deck.
Unlock Deck
k this deck
73
SCENARIO 12-12
Parents complain that children read too few storybooks and watch too much television nowadays.A
survey of 1,000 children reveals the following information on average time spent watching TV and
average time spent reading storybooks
Referring to Scenario 12-12, how many children in the survey spent less than 2 hours watching
TV and more than 2 hours reading story books on average?
A) 8
B) 130
C) 175
D) 687
Unlock Deck
Unlock for access to all 100 flashcards in this deck.
Unlock Deck
k this deck
74
SCENARIO 12-12
Parents complain that children read too few storybooks and watch too much television nowadays.A
survey of 1,000 children reveals the following information on average time spent watching TV and
average time spent reading storybooks
Referring to Scenario 12-12, we want to test whether there is any relationship between average
Time spent watching TV and average time spent reading storybooks.Suppose the value of the
Test statistic was 164 (which is not the correct answer)and the critical value was 19.00 (which is
Not the correct answer), then we could conclude that
A) There is a connection between time spent reading storybooks and time spent watching TV.
B) There is no connection between time spent reading storybooks and time spent watching TV.
C) More time spent reading storybooks leads to less time spent watching TV.
D) More time spent watching TV leads to less time spent reading storybooks.
Unlock Deck
Unlock for access to all 100 flashcards in this deck.
Unlock Deck
k this deck
75
SCENARIO 12-11
The director of admissions at a state college is interested in seeing if admissions status (admitted,
waiting list, denied admission)at his college is independent of the type of community in which an
applicant resides.He takes a sample of recent admissions decisions and forms the following table: He will use this table to do a chi-square test of independence with a level of significance of 0.01.
Referring to Scenario 12-11, the test will involve _________ degrees of freedom.
The director of admissions at a state college is interested in seeing if admissions status (admitted,
waiting list, denied admission)at his college is independent of the type of community in which an
applicant resides.He takes a sample of recent admissions decisions and forms the following table:
He will use this table to do a chi-square test of independence with a level of significance of 0.01.Referring to Scenario 12-11, the test will involve _________ degrees of freedom.
Unlock Deck
Unlock for access to all 100 flashcards in this deck.
Unlock Deck
k this deck
76
True or False: The chi-square test of independence requires that the expected frequency in each
cell to be at least 5.
cell to be at least 5.
Unlock Deck
Unlock for access to all 100 flashcards in this deck.
Unlock Deck
k this deck
77
SCENARIO 12-11
The director of admissions at a state college is interested in seeing if admissions status (admitted,
waiting list, denied admission)at his college is independent of the type of community in which an
applicant resides.He takes a sample of recent admissions decisions and forms the following table: He will use this table to do a chi-square test of independence with a level of significance of 0.01.
True or False: Referring to Scenario 12-11, the same decision would be made with this test if
the level of significance had been 0.005.
The director of admissions at a state college is interested in seeing if admissions status (admitted,
waiting list, denied admission)at his college is independent of the type of community in which an
applicant resides.He takes a sample of recent admissions decisions and forms the following table:
He will use this table to do a chi-square test of independence with a level of significance of 0.01.True or False: Referring to Scenario 12-11, the same decision would be made with this test if
the level of significance had been 0.005.
Unlock Deck
Unlock for access to all 100 flashcards in this deck.
Unlock Deck
k this deck
78
SCENARIO 12-13
Recent studies have found that American children are more obese than in the past.The amount of
time children spent watching television has received much of the blame.A survey of 100 ten-year-
olds revealed the following with regards to weights and average number of hours a day spent
watching television.We are interested in testing whether the mean number of hours spent watching
TV and weights are independent at 1% level of significance.
12-30 Chi-Square and Nonparametric Tests
Referring to Scenario 12-13, if there is no connection between weights and average number of
Hours spent watching TV, we should expect how many children to be spending 3-6 hours on
Average watching TV and are more than 10 lbs.underweight?
A) 5
B) 5.8
C) 6.2
D) 8
Unlock Deck
Unlock for access to all 100 flashcards in this deck.
Unlock Deck
k this deck
79
SCENARIO 12-11
The director of admissions at a state college is interested in seeing if admissions status (admitted,
waiting list, denied admission)at his college is independent of the type of community in which an
applicant resides.He takes a sample of recent admissions decisions and forms the following table: He will use this table to do a chi-square test of independence with a level of significance of 0.01.
True or False: Referring to Scenario 12-11, the same decision would be made with this test if
the level of significance had been 0.05.
The director of admissions at a state college is interested in seeing if admissions status (admitted,
waiting list, denied admission)at his college is independent of the type of community in which an
applicant resides.He takes a sample of recent admissions decisions and forms the following table:
He will use this table to do a chi-square test of independence with a level of significance of 0.01.True or False: Referring to Scenario 12-11, the same decision would be made with this test if
the level of significance had been 0.05.
Unlock Deck
Unlock for access to all 100 flashcards in this deck.
Unlock Deck
k this deck
80
SCENARIO 12-11
The director of admissions at a state college is interested in seeing if admissions status (admitted,
waiting list, denied admission)at his college is independent of the type of community in which an
applicant resides.He takes a sample of recent admissions decisions and forms the following table: He will use this table to do a chi-square test of independence with a level of significance of 0.01.
True or False: Referring to Scenario 12-11, the p-value of this test is greater than 0.01.
The director of admissions at a state college is interested in seeing if admissions status (admitted,
waiting list, denied admission)at his college is independent of the type of community in which an
applicant resides.He takes a sample of recent admissions decisions and forms the following table:
He will use this table to do a chi-square test of independence with a level of significance of 0.01.True or False: Referring to Scenario 12-11, the p-value of this test is greater than 0.01.
Unlock Deck
Unlock for access to all 100 flashcards in this deck.
Unlock Deck
k this deck
Unlock Deck
Unlock for access to all 100 flashcards in this deck.


