Deck 8: Confidence Interval Estimation
Full screen (f)
Question
Question
Question
Question
Question
Question
Question
Question
Question
Question
Question
Question
Question
Question
Question
Question
Question
Question
Question
Question
Question
Question
Question
Question
Question
Question
Question
Question
Question
Question
Question
Question
Question
Question
Question
Question
Question
Question
Question
Question
Question
Question
Question
Question
Question
Question
Question
Question
Question
Question
Question
Question
Question
Question
Question
Question
Question
Question
Question
Question
Question
Question
Question
Question
Question
Question
Question
Question
Question
Question
Question
Question
Question
Question
Question
Question
Question
Question
Question
Question

Unlock Deck
Sign up to unlock the cards in this deck!
Unlock Deck
Unlock Deck
1/139
Play
Full screen (f)
Deck 8: Confidence Interval Estimation
1
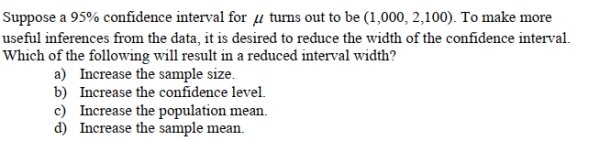
Suppose a 95% confidence interval for μ has been constructed.If it is decided to take a
Larger sample and to decrease the confidence level of the interval, then the resulting interval
Width would .(Assume that the sample statistics gathered would not
Change very much for the new sample.)
A) be larger than the current interval width
B) be narrower than the current interval width
C) be the same as the current interval width
D) be unknown until actual sample sizes and reliability levels were determined
B
2
A
3
True or False: A point estimate consists of a single sample statistic that is used to estimate the
true population parameter.
true population parameter.
True
4
In the construction of confidence intervals, if all other quantities are unchanged, an increase
In the sample size will lead to a interval.
A) narrower
B) wider
C) less significant
D) biased
In the sample size will lead to a interval.
A) narrower
B) wider
C) less significant
D) biased
Unlock Deck
Unlock for access to all 139 flashcards in this deck.
Unlock Deck
k this deck
5
True or False: Holding the sample size fixed, increasing the level of confidence in a
confidence interval will necessarily lead to a wider confidence interval.
confidence interval will necessarily lead to a wider confidence interval.
Unlock Deck
Unlock for access to all 139 flashcards in this deck.
Unlock Deck
k this deck
6
True or False: Other things being equal, as the confidence level for a confidence interval
increases, the width of the interval increases.
increases, the width of the interval increases.
Unlock Deck
Unlock for access to all 139 flashcards in this deck.
Unlock Deck
k this deck
7
The head librarian at the Library of Congress has asked her assistant for an interval estimate
Of the mean number of books checked out each day.The assistant provides the following
Interval estimate: from 740 to 920 books per day.What is an efficient, unbiased point
Estimate of the number of books checked out each day at the Library of Congress?
A) 740
B) 830
C) 920
D) 1,660
Of the mean number of books checked out each day.The assistant provides the following
Interval estimate: from 740 to 920 books per day.What is an efficient, unbiased point
Estimate of the number of books checked out each day at the Library of Congress?
A) 740
B) 830
C) 920
D) 1,660
Unlock Deck
Unlock for access to all 139 flashcards in this deck.
Unlock Deck
k this deck
8
True or False: Holding the width of a confidence interval fixed, increasing the level of
confidence can be achieved with a lower sample size.
confidence can be achieved with a lower sample size.
Unlock Deck
Unlock for access to all 139 flashcards in this deck.
Unlock Deck
k this deck
9
True or False: The sample mean is a point estimate of the population mean.
Unlock Deck
Unlock for access to all 139 flashcards in this deck.
Unlock Deck
k this deck
10
True or False: The difference between the upper limit of a confidence interval and the point
estimate used in constructing the confidence interval is called the sampling error.
estimate used in constructing the confidence interval is called the sampling error.
Unlock Deck
Unlock for access to all 139 flashcards in this deck.
Unlock Deck
k this deck
11
True or False: The difference between the lower limit of a confidence interval and the point
estimate used in constructing the confidence interval is called the sampling error.
estimate used in constructing the confidence interval is called the sampling error.
Unlock Deck
Unlock for access to all 139 flashcards in this deck.
Unlock Deck
k this deck
12
True or False: For a given data set, the confidence interval will be wider for 95% confidence
than for 90% confidence.
than for 90% confidence.
Unlock Deck
Unlock for access to all 139 flashcards in this deck.
Unlock Deck
k this deck
13
True or False: Sampling error equals half the width of a confidence interval.
Unlock Deck
Unlock for access to all 139 flashcards in this deck.
Unlock Deck
k this deck
14
True or False: The sampling error can either be positive or negative.
Unlock Deck
Unlock for access to all 139 flashcards in this deck.
Unlock Deck
k this deck
15
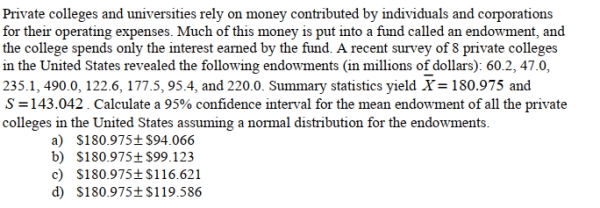
Private colleges and universities rely on money contributed by individuals and corporations
For their operating expenses.Much of this money is put into a fund called an endowment, and
The college spends only the interest earned by the fund.A recent survey of 8 private colleges
In the United States revealed the following endowments (in millions of dollars): 60.2, 47.0,235.1, 490.0, 122.6, 177.5, 95.4, and 220.0.What value will be used as the point estimate for
The mean endowment of all private colleges in the United States?
A) $1,447.8
B) $180.975
C) $143.042
D) $8
Unlock Deck
Unlock for access to all 139 flashcards in this deck.
Unlock Deck
k this deck
16
True or False: Other things being equal, the confidence interval for the mean will be wider for
95% confidence than for 90% confidence.
95% confidence than for 90% confidence.
Unlock Deck
Unlock for access to all 139 flashcards in this deck.
Unlock Deck
k this deck
17
True or False: The width of a confidence interval equals twice the sampling error.
Unlock Deck
Unlock for access to all 139 flashcards in this deck.
Unlock Deck
k this deck
18
True or False: A population parameter is used to estimate a confidence interval.
Unlock Deck
Unlock for access to all 139 flashcards in this deck.
Unlock Deck
k this deck
19
True or False: The confidence interval obtained will always correctly estimate the population
parameter.
parameter.
Unlock Deck
Unlock for access to all 139 flashcards in this deck.
Unlock Deck
k this deck
20
True or False: Holding the level of confidence fixed, increasing the sample size will lead to a
wider confidence interval.
wider confidence interval.
Unlock Deck
Unlock for access to all 139 flashcards in this deck.
Unlock Deck
k this deck
21
True or False: A sample size of 5 provides a sample mean of 9.6.If the population variance is
known to be 5 and the population distribution is assumed to be normal, the lower limit for a
90% confidence interval is 7.96.
known to be 5 and the population distribution is assumed to be normal, the lower limit for a
90% confidence interval is 7.96.
Unlock Deck
Unlock for access to all 139 flashcards in this deck.
Unlock Deck
k this deck
22
Unlock Deck
Unlock for access to all 139 flashcards in this deck.
Unlock Deck
k this deck
23
It is desired to estimate the mean total compensation of CEOs in the Service industry.Data
Were randomly collected from 18 CEOs and the 95% confidence interval was calculated to be
($2,181,260, $5,836,180).Based on the interval above, do you believe the mean total
Compensation of CEOs in the Service industry is more than $3,000,000?
A) Yes, and I am 95% confident of it.
B) Yes, and I am 78% confident of it.
C) I am 95% confident that the mean compensation is $3,000,000.
D) I cannot conclude that the mean exceeds $3,000,000 at the 95% confidence level.
Unlock Deck
Unlock for access to all 139 flashcards in this deck.
Unlock Deck
k this deck
24
An economist is interested in studying the incomes of consumers in a particular country.The
Population standard deviation is known to be $1,000.A random sample of 50 individuals
Resulted in a mean income of $15,000.What is the upper end point in a 99% confidence
Interval for the average income?
A) $15,052
B) $15,141
C) $15,330
D) $15,364
Population standard deviation is known to be $1,000.A random sample of 50 individuals
Resulted in a mean income of $15,000.What is the upper end point in a 99% confidence
Interval for the average income?
A) $15,052
B) $15,141
C) $15,330
D) $15,364
Unlock Deck
Unlock for access to all 139 flashcards in this deck.
Unlock Deck
k this deck
25
Unlock Deck
Unlock for access to all 139 flashcards in this deck.
Unlock Deck
k this deck
26
True or False: The t distribution is used to construct confidence intervals for the population
mean when the population standard deviation is unknown.
mean when the population standard deviation is unknown.
Unlock Deck
Unlock for access to all 139 flashcards in this deck.
Unlock Deck
k this deck
27
It is desired to estimate the mean total compensation of CEOs in the Service industry.Data
Were randomly collected from 18 CEOs and the 95% confidence interval was calculated to be
($2,181,260, $5,836,180).Which of the following interpretations is correct?
A) 95% of the sampled total compensation values fell between $2,181,260 and $5,836,180.
B) We are 95% confident that the mean of the sampled CEOs falls in the interval $2,181,260 to $5,836,180.
C) In the population of Service industry CEOs, 95% of them will have total compensations that fall in the interval $2,181,260 to $5,836,180.
D) We are 95% confident that the mean total compensation of all CEOs in the Service industry falls in the interval $2,181,260 to $5,836,180.
Unlock Deck
Unlock for access to all 139 flashcards in this deck.
Unlock Deck
k this deck
28
Unlock Deck
Unlock for access to all 139 flashcards in this deck.
Unlock Deck
k this deck
29
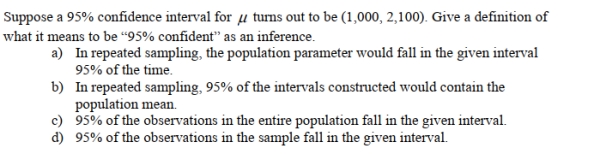
A 99% confidence interval estimate can be interpreted to mean that
A) if all possible samples of size n are taken and confidence interval estimates are developed, 99% of them would include the true population mean somewhere
Within their interval.
B) we have 99% confidence that we have selected a sample whose interval does include the population mean.
C) Both of the above.
D) None of the above.
Unlock Deck
Unlock for access to all 139 flashcards in this deck.
Unlock Deck
k this deck
30
True or False: Given a sample mean of 2.1 and a population standard deviation of 0.7 from a
sample of 10 data points, a 90% confidence interval will have a width of 2.36.
sample of 10 data points, a 90% confidence interval will have a width of 2.36.
Unlock Deck
Unlock for access to all 139 flashcards in this deck.
Unlock Deck
k this deck
31
An economist is interested in studying the incomes of consumers in a particular country.The
Population standard deviation is known to be $1,000.A random sample of 50 individuals
Resulted in a mean income of $15,000.What is the width of the 90% confidence interval?
A) $232.60
B) $364.30
C) $465.23
D) $728.60
Population standard deviation is known to be $1,000.A random sample of 50 individuals
Resulted in a mean income of $15,000.What is the width of the 90% confidence interval?
A) $232.60
B) $364.30
C) $465.23
D) $728.60
Unlock Deck
Unlock for access to all 139 flashcards in this deck.
Unlock Deck
k this deck
32
True or False: The difference between the sample mean and the population mean is called the
sampling error.
sampling error.
Unlock Deck
Unlock for access to all 139 flashcards in this deck.
Unlock Deck
k this deck
33
True or False: The t distribution is used to develop a confidence interval estimate of the
population mean when the population standard deviation is unknown.
population mean when the population standard deviation is unknown.
Unlock Deck
Unlock for access to all 139 flashcards in this deck.
Unlock Deck
k this deck
34
True or False: The confidence interval estimate of the population mean is constructed around
the sample mean.
the sample mean.
Unlock Deck
Unlock for access to all 139 flashcards in this deck.
Unlock Deck
k this deck
35
True or False: The difference between the sample size and the population size is called the
sampling error.
sampling error.
Unlock Deck
Unlock for access to all 139 flashcards in this deck.
Unlock Deck
k this deck
36
The t distribution
A) assumes the population is normally distributed.
B) approaches the normal distribution as the sample size increases.
C) has more area in the tails than does the normal distribution.
D) All of the above.
A) assumes the population is normally distributed.
B) approaches the normal distribution as the sample size increases.
C) has more area in the tails than does the normal distribution.
D) All of the above.
Unlock Deck
Unlock for access to all 139 flashcards in this deck.
Unlock Deck
k this deck
37
If you were constructing a 99% confidence interval of the population mean based on a sample
Of n=25 where the standard deviation of the sample S = 0.05, the critical value of t will be
A) 2.7969
B) 2.7874
C) 2.4922
D) 2.4851
Of n=25 where the standard deviation of the sample S = 0.05, the critical value of t will be
A) 2.7969
B) 2.7874
C) 2.4922
D) 2.4851
Unlock Deck
Unlock for access to all 139 flashcards in this deck.
Unlock Deck
k this deck
38
True or False: The difference between the sample proportion and the population proportion is
called the sampling error.
called the sampling error.
Unlock Deck
Unlock for access to all 139 flashcards in this deck.
Unlock Deck
k this deck
39
Which of the following is not true about the Student's t distribution?
A) It has more area in the tails and less in the center than does the normal distribution.
B) It is used to construct confidence intervals for the population mean when the population standard deviation is known.
C) It is bell shaped and symmetrical.
D) As the number of degrees of freedom increases, the t distribution approaches the normal distribution.
Unlock Deck
Unlock for access to all 139 flashcards in this deck.
Unlock Deck
k this deck
40
The t distribution approaches the standardized normal distribution when the number of
degrees of freedom increases.
degrees of freedom increases.
Unlock Deck
Unlock for access to all 139 flashcards in this deck.
Unlock Deck
k this deck
41
True or False: In forming a 90% confidence interval for a population mean from a sample
size of 22, the number of degrees of freedom from the t distribution equals 22.
size of 22, the number of degrees of freedom from the t distribution equals 22.
Unlock Deck
Unlock for access to all 139 flashcards in this deck.
Unlock Deck
k this deck
42
True or False: Given a sample mean of 2.1 and a sample standard deviation of 0.7 from a
sample of 10 data points, a 90% confidence interval will have a width of 2.36.
sample of 10 data points, a 90% confidence interval will have a width of 2.36.
Unlock Deck
Unlock for access to all 139 flashcards in this deck.
Unlock Deck
k this deck
43
Unlock Deck
Unlock for access to all 139 flashcards in this deck.
Unlock Deck
k this deck
44
True or False: The t distribution allows the calculation of confidence intervals for means for
small samples when the population variance is not known, regardless of the shape of the
distribution in the population.
small samples when the population variance is not known, regardless of the shape of the
distribution in the population.
Unlock Deck
Unlock for access to all 139 flashcards in this deck.
Unlock Deck
k this deck
45
True or False: A race car driver tested his car for time from 0 to 60 mph, and for 20 tests
obtained a mean of 4.85 seconds with a standard deviation of 1.47 seconds.A 95%
confidence interval for the 0 to 60 mean time is 4.52 seconds to 5.18 seconds.
obtained a mean of 4.85 seconds with a standard deviation of 1.47 seconds.A 95%
confidence interval for the 0 to 60 mean time is 4.52 seconds to 5.18 seconds.
Unlock Deck
Unlock for access to all 139 flashcards in this deck.
Unlock Deck
k this deck
46
True or False: The t distribution is used to develop a confidence interval estimate of the
population proportion when the population standard deviation is unknown.
population proportion when the population standard deviation is unknown.
Unlock Deck
Unlock for access to all 139 flashcards in this deck.
Unlock Deck
k this deck
47
Unlock Deck
Unlock for access to all 139 flashcards in this deck.
Unlock Deck
k this deck
48
The county clerk wants to estimate the proportion of voters who will need special election
facilities.The clerk wants to construct a 95% confidence interval for the population
proportion which extends at most 0.07 to either side of the sample proportion.How large a
sample must be taken to assure these conditions are met?
facilities.The clerk wants to construct a 95% confidence interval for the population
proportion which extends at most 0.07 to either side of the sample proportion.How large a
sample must be taken to assure these conditions are met?
Unlock Deck
Unlock for access to all 139 flashcards in this deck.
Unlock Deck
k this deck
49
True or False: The confidence interval estimate of the population proportion is constructed
around the sample proportion.
around the sample proportion.
Unlock Deck
Unlock for access to all 139 flashcards in this deck.
Unlock Deck
k this deck
50
True or False: A random sample of 50 provides a sample mean of 31 with a standard
deviation of S = 14.The upper bound of a 90% confidence interval estimate of the population
mean is 34.32.
deviation of S = 14.The upper bound of a 90% confidence interval estimate of the population
mean is 34.32.
Unlock Deck
Unlock for access to all 139 flashcards in this deck.
Unlock Deck
k this deck
51
When determining the sample size for a proportion for a given level of confidence and
Sampling error, the closer to 0.50 that π is estimated to be, the sample size required
__________.
A) is smaller
B) is larger
C) is not affected
D) can be smaller, larger or unaffected
Sampling error, the closer to 0.50 that π is estimated to be, the sample size required
__________.
A) is smaller
B) is larger
C) is not affected
D) can be smaller, larger or unaffected
Unlock Deck
Unlock for access to all 139 flashcards in this deck.
Unlock Deck
k this deck
52
A confidence interval was used to estimate the proportion of statistics students who are
Females.A random sample of 72 statistics students generated the following 90% confidence
Interval: (0.438, 0.642).Based on the interval above, is the population proportion of females
Equal to 0.60?
A) No, and we are 90% sure of it.
B) No.The proportion is 54.17%.
C) Maybe.0.60 is a believable value of the population proportion based on the information above.
D) Yes, and we are 90% sure of it.
Unlock Deck
Unlock for access to all 139 flashcards in this deck.
Unlock Deck
k this deck
53
True or False: The standardized normal distribution is used to develop a confidence interval
estimate of the population proportion regardless of whether the population standard deviation
is known.
estimate of the population proportion regardless of whether the population standard deviation
is known.
Unlock Deck
Unlock for access to all 139 flashcards in this deck.
Unlock Deck
k this deck
54
True or False: A sample of 100 fuses from a very large shipment is found to have 10 that are
defective.The 95% confidence interval would indicate that, for this shipment, the proportion
of defective fuses is between 0 and 0.28.
defective.The 95% confidence interval would indicate that, for this shipment, the proportion
of defective fuses is between 0 and 0.28.
Unlock Deck
Unlock for access to all 139 flashcards in this deck.
Unlock Deck
k this deck
55
Unlock Deck
Unlock for access to all 139 flashcards in this deck.
Unlock Deck
k this deck
56
True or False: In estimating the population mean with the population standard deviation
unknown, if the sample size is 12, there will be 6 degrees of freedom.
unknown, if the sample size is 12, there will be 6 degrees of freedom.
Unlock Deck
Unlock for access to all 139 flashcards in this deck.
Unlock Deck
k this deck
57
Unlock Deck
Unlock for access to all 139 flashcards in this deck.
Unlock Deck
k this deck
58
True or False: The standardized normal distribution is used to develop a confidence interval
estimate of the population proportion when the sample size is sufficiently large.
estimate of the population proportion when the sample size is sufficiently large.
Unlock Deck
Unlock for access to all 139 flashcards in this deck.
Unlock Deck
k this deck
59
True or False: The t distribution allows the calculation of confidence intervals for means
when the actual standard deviation is not known.
when the actual standard deviation is not known.
Unlock Deck
Unlock for access to all 139 flashcards in this deck.
Unlock Deck
k this deck
60
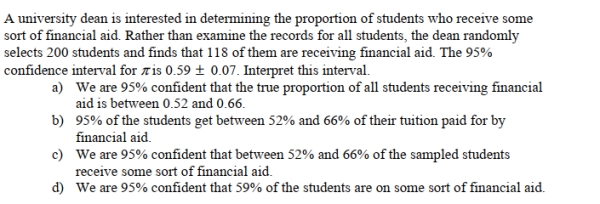
A university dean is interested in determining the proportion of students who receive some
sort of financial aid.Rather than examine the records for all students, the dean randomly
selects 200 students and finds that 118 of them are receiving financial aid.Use a 90%
confidence interval to estimate the true proportion of students who receive financial aid.
sort of financial aid.Rather than examine the records for all students, the dean randomly
selects 200 students and finds that 118 of them are receiving financial aid.Use a 90%
confidence interval to estimate the true proportion of students who receive financial aid.
Unlock Deck
Unlock for access to all 139 flashcards in this deck.
Unlock Deck
k this deck
61
Unlock Deck
Unlock for access to all 139 flashcards in this deck.
Unlock Deck
k this deck
62
When determining the sample size necessary for estimating the true population mean, which
Factor is not considered when sampling with replacement?
A) The population size.
B) The population standard deviation.
C) The level of confidence desired in the estimate.
D) The allowable or tolerable sampling error.
Factor is not considered when sampling with replacement?
A) The population size.
B) The population standard deviation.
C) The level of confidence desired in the estimate.
D) The allowable or tolerable sampling error.
Unlock Deck
Unlock for access to all 139 flashcards in this deck.
Unlock Deck
k this deck
63
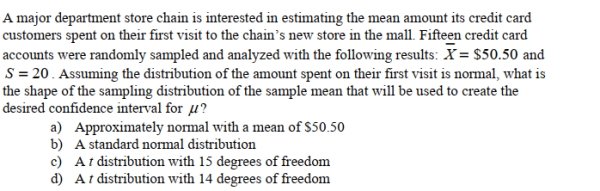
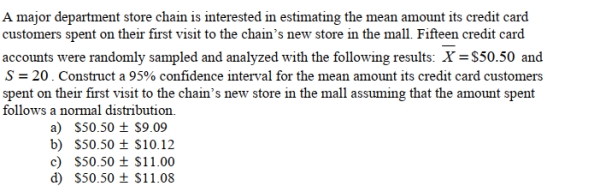
Suppose a department store wants to estimate the mean age of the customers of its
contemporary apparel department, correct to within 2 years, with level of confidence equal to
95%.Management believes that the standard deviation is 8 years.The sample size they
should take is ________.
contemporary apparel department, correct to within 2 years, with level of confidence equal to
95%.Management believes that the standard deviation is 8 years.The sample size they
should take is ________.
Unlock Deck
Unlock for access to all 139 flashcards in this deck.
Unlock Deck
k this deck
64
An economist is interested in studying the incomes of consumers in a particular country.The
Population standard deviation is known to be $1,000.A random sample of 50 individuals
Resulted in a mean income of $15,000.What total sample size would the economist need to
Use for a 95% confidence interval if the width of the interval should not be more than $100?
A) n = 1537
B) n = 385
C) n = 40
D) n = 20
Unlock Deck
Unlock for access to all 139 flashcards in this deck.
Unlock Deck
k this deck
65
SCENARIO 8-3
To become an actuary, it is necessary to pass a series of 10 exams, including the most
important one, an exam in probability and statistics.An insurance company wants to
estimate the mean score on this exam for actuarial students who have enrolled in a special
study program.They take a sample of 8 actuarial students in this program and determine
that their scores are: 2, 5, 8, 8, 7, 6, 5, and 7.This sample will be used to calculate a 90%
confidence interval for the mean score for actuarial students in the special study program.
True or False: Referring to Scenario 8-3, it is possible that the confidence interval obtained
will not contain the mean score for all actuarial students in the special study program.
Unlock Deck
Unlock for access to all 139 flashcards in this deck.
Unlock Deck
k this deck
66
SCENARIO 8-1
The managers of a company are worried about the morale of their employees.In order to
determine if a problem in this area exists, they decide to evaluate the attitudes of their
employees with a standardized test.They select the Fortunato test of job satisfaction,
which has a known standard deviation of 24 points.
True or False: Referring to Scenario 8-1, this confidence interval is only valid if the scores on
the Fortunato test are normally distributed.
Unlock Deck
Unlock for access to all 139 flashcards in this deck.
Unlock Deck
k this deck
67
A confidence interval was used to estimate the proportion of statistics students who are
Female.A random sample of 72 statistics students generated the following 90% confidence
Interval: (0.438, 0.642).Using the information above, what total size sample would be
Necessary if we wanted to estimate the true proportion to within ±0.08 using 95% confidence?
A) 105
B) 150
C) 420
D) 597
Female.A random sample of 72 statistics students generated the following 90% confidence
Interval: (0.438, 0.642).Using the information above, what total size sample would be
Necessary if we wanted to estimate the true proportion to within ±0.08 using 95% confidence?
A) 105
B) 150
C) 420
D) 597
Unlock Deck
Unlock for access to all 139 flashcards in this deck.
Unlock Deck
k this deck
68
The head librarian at the Library of Congress has asked her assistant for an interval estimate
Of the mean number of books checked out each day.The assistant provides the following
Interval estimate: from 740 to 920 books per day.If the head librarian knows that the
Population standard deviation is 150 books checked out per day, and she asked her assistant
To use 25 days of data to construct the interval estimate, what confidence level can she attach
To the interval estimate?
A) 99.7%
B) 99.0%
C) 98.0%
D) 95.4%
Unlock Deck
Unlock for access to all 139 flashcards in this deck.
Unlock Deck
k this deck
69
SCENARIO 8-3
To become an actuary, it is necessary to pass a series of 10 exams, including the most
important one, an exam in probability and statistics.An insurance company wants to
estimate the mean score on this exam for actuarial students who have enrolled in a special
study program.They take a sample of 8 actuarial students in this program and determine
that their scores are: 2, 5, 8, 8, 7, 6, 5, and 7.This sample will be used to calculate a 90%
confidence interval for the mean score for actuarial students in the special study program.
True or False: Referring to Scenario 8-3, if we use the same sample information to obtain a
95% confidence interval, the resulting interval would be narrower than the one obtained here
with 90% confidence.
Unlock Deck
Unlock for access to all 139 flashcards in this deck.
Unlock Deck
k this deck
70
The head librarian at the Library of Congress has asked her assistant for an interval estimate
Of the mean number of books checked out each day.The assistant provides the following
Interval estimate: from 740 to 920 books per day.If the head librarian knows that the
Population standard deviation is 150 books checked out per day, and she asked her assistant
For a 95% confidence interval, approximately how large a sample did her assistant use to
Determine the interval estimate?
A) 125
B) 13
C) 11
D) 4
Unlock Deck
Unlock for access to all 139 flashcards in this deck.
Unlock Deck
k this deck
71
The head librarian at the Library of Congress has asked her assistant for an interval estimate
Of the mean number of books checked out each day.The assistant provides the following
Interval estimate: from 740 to 920 books per day.If the head librarian knows that the
Population standard deviation is 150 books checked out per day, approximately how large a
Sample did her assistant use to determine the interval estimate?
A) 2
B) 3
C) 12
D) It cannot be determined from the information given.
Unlock Deck
Unlock for access to all 139 flashcards in this deck.
Unlock Deck
k this deck
72
SCENARIO 8-4
The actual voltages of power packs labeled as 12 volts are as follows: 11.77, 11.90, 11.64,
True or False: Referring to Scenario 8-4, a 99% confidence interval will contain 99% of the
voltages for all such power packs.
The actual voltages of power packs labeled as 12 volts are as follows: 11.77, 11.90, 11.64,
True or False: Referring to Scenario 8-4, a 99% confidence interval will contain 99% of the
voltages for all such power packs.
Unlock Deck
Unlock for access to all 139 flashcards in this deck.
Unlock Deck
k this deck
73
SCENARIO 8-2
A quality control engineer is interested in the mean length of sheet insulation being cut
automatically by machine.The desired mean length of the insulation is 12 feet.It is
known that the standard deviation in the cutting length is 0.15 feet.A sample of 70 cut
sheets yields a mean length of 12.14 feet.This sample will be used to obtain a 99%
confidence interval for the mean length cut by machine.
True or False: Referring to Scenario 8-2, the confidence interval is valid only if the lengths
cut are normally distributed.
Unlock Deck
Unlock for access to all 139 flashcards in this deck.
Unlock Deck
k this deck
74
SCENARIO 8-2
A quality control engineer is interested in the mean length of sheet insulation being cut
automatically by machine.The desired mean length of the insulation is 12 feet.It is
known that the standard deviation in the cutting length is 0.15 feet.A sample of 70 cut
sheets yields a mean length of 12.14 feet.This sample will be used to obtain a 99%
confidence interval for the mean length cut by machine.
True or False: Referring to Scenario 8-2, the confidence interval indicates that the machine is
not working properly.
Unlock Deck
Unlock for access to all 139 flashcards in this deck.
Unlock Deck
k this deck
75
SCENARIO 8-4
The actual voltages of power packs labeled as 12 volts are as follows: 11.77, 11.90, 11.64,
True or False: Referring to Scenario 8-4, a 95% confidence interval for the mean voltage of
the power pack is wider than a 99% confidence interval.
The actual voltages of power packs labeled as 12 volts are as follows: 11.77, 11.90, 11.64,
True or False: Referring to Scenario 8-4, a 95% confidence interval for the mean voltage of
the power pack is wider than a 99% confidence interval.
Unlock Deck
Unlock for access to all 139 flashcards in this deck.
Unlock Deck
k this deck
76
SCENARIO 8-3
To become an actuary, it is necessary to pass a series of 10 exams, including the most
important one, an exam in probability and statistics.An insurance company wants to
estimate the mean score on this exam for actuarial students who have enrolled in a special
study program.They take a sample of 8 actuarial students in this program and determine
that their scores are: 2, 5, 8, 8, 7, 6, 5, and 7.This sample will be used to calculate a 90%
confidence interval for the mean score for actuarial students in the special study program.
True or False: Referring to Scenario 8-3, for the confidence interval to be valid, it is
necessary that test scores of students in the special study program on the actuarial exam be
normally distributed.
Unlock Deck
Unlock for access to all 139 flashcards in this deck.
Unlock Deck
k this deck
77
SCENARIO 8-2
A quality control engineer is interested in the mean length of sheet insulation being cut
automatically by machine.The desired mean length of the insulation is 12 feet.It is
known that the standard deviation in the cutting length is 0.15 feet.A sample of 70 cut
sheets yields a mean length of 12.14 feet.This sample will be used to obtain a 99%
confidence interval for the mean length cut by machine.
Referring to Scenario 8-2, suppose the engineer had decided to estimate the mean length to
within 0.03 with 99% confidence.Then the sample size would be ________.
Unlock Deck
Unlock for access to all 139 flashcards in this deck.
Unlock Deck
k this deck
78
A university system enrolling hundreds of thousands of students is considering a change in
the way students pay for their education.Currently, the students pay $400 per credit hour.
The university system administrators are contemplating charging each student a set fee of
$7,000 per quarter, regardless of how many credit hours each takes.To see if this proposal
would be economically feasible, the administrators would like to know how many credit
hours, on the average, each student takes per quarter.A random sample of 250 students yields
a mean of 14.1 credit hours per quarter and a standard deviation of 2.3 credit hours per
quarter.Suppose the administration wanted to estimate the mean to within 0.1 hours at 95%
reliability and assumed that the sample standard deviation provided a good estimate for the
population standard deviation.How large a total sample would they need to take?
Unlock Deck
Unlock for access to all 139 flashcards in this deck.
Unlock Deck
k this deck
79
SCENARIO 8-1
The managers of a company are worried about the morale of their employees.In order to
determine if a problem in this area exists, they decide to evaluate the attitudes of their
employees with a standardized test.They select the Fortunato test of job satisfaction,
which has a known standard deviation of 24 points.
Referring to Scenario 8-1, they should sample ________ employees if they want to estimate
the mean score of the employees within 5 points with 90% confidence.
Unlock Deck
Unlock for access to all 139 flashcards in this deck.
Unlock Deck
k this deck
80
A university dean is interested in determining the proportion of students who receive some
Sort of financial aid.Rather than examine the records for all students, the dean randomly
Selects 200 students and finds that 118 of them are receiving financial aid.If the dean wanted
To estimate the proportion of all students receiving financial aid to within 3% with 99%
Reliability, how many students would need to be sampled?
A) n = 1,844
B) n = 1,784
C) n = 1,503
D) n = 1,435
Unlock Deck
Unlock for access to all 139 flashcards in this deck.
Unlock Deck
k this deck
Unlock Deck
Unlock for access to all 139 flashcards in this deck.


