Deck 3: Numerical Descriptive Measures
Full screen (f)
Question
Question
Question
Question
Question
Question
Question
Question
Question
Which of the following statements about the median is not true?
A) It is more affected by extreme values than the arithmetic mean.
B) It is a measure of central tendency.
C) It is equal to
D) It is equal to the mode in bell-shaped "normal" distributions.
A) It is more affected by extreme values than the arithmetic mean.
B) It is a measure of central tendency.
C) It is equal to
D) It is equal to the mode in bell-shaped "normal" distributions.
Question
Question
Question
Question
Question
Question
Question
In right-skewed distributions, which of the following is the correct statement? 
Question
Question
Question
Question
Question
SCENARIO 3-1
Health care issues are receiving much attention in both academic and political arenas.A sociologist
recently conducted a survey of citizens over 60 years of age whose net worth is too high to qualify for
Medicaid.The ages of 25 senior citizens were as follows:
Referring to Scenario 3-1, what type of shape does the distribution of the sample appear to have?
Question
Question
Question
Question
Question
SCENARIO 3-1
Health care issues are receiving much attention in both academic and political arenas.A sociologist
recently conducted a survey of citizens over 60 years of age whose net worth is too high to qualify for
Medicaid.The ages of 25 senior citizens were as follows:
Referring to Scenario 3-1, calculate the kurtosis statistic for the age of the senior citizens accurate
to two decimal places.
Question
Question
Question
Question
SCENARIO 3-1
Health care issues are receiving much attention in both academic and political arenas.A sociologist
recently conducted a survey of citizens over 60 years of age whose net worth is too high to qualify for
Medicaid.The ages of 25 senior citizens were as follows:
Referring to Scenario 3-1, does the distribution of the sample appear to be lepokurtic or
platykurtic?
Question
SCENARIO 3-1
Health care issues are receiving much attention in both academic and political arenas.A sociologist
recently conducted a survey of citizens over 60 years of age whose net worth is too high to qualify for
Medicaid.The ages of 25 senior citizens were as follows:
Referring to Scenario 3-1, determine the interquartile range of the ages of the senior citizens.
Question
Question
Question
Question
A manufacturer of flashlight batteries took a sample of 130 batteries from a day's production and
Used them continuously until they were drained.The number of hours until failure are recorded.
Given below is the boxplot of the number of hours it took to drain each of the 130 batteries.The
Distribution of the number of hours is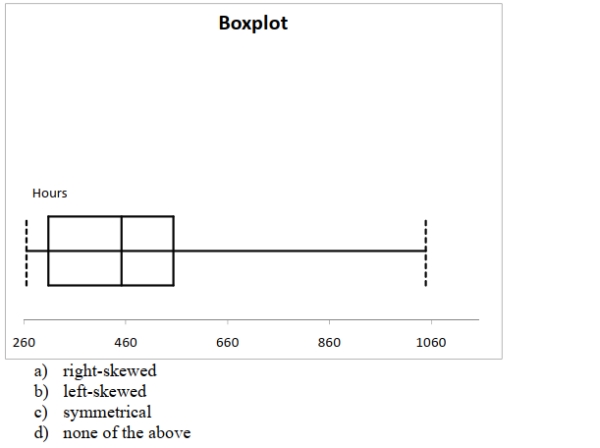
Used them continuously until they were drained.The number of hours until failure are recorded.
Given below is the boxplot of the number of hours it took to drain each of the 130 batteries.The
Distribution of the number of hours is
Question
Question
SCENARIO 3-1
Health care issues are receiving much attention in both academic and political arenas.A sociologist
recently conducted a survey of citizens over 60 years of age whose net worth is too high to qualify for
Medicaid.The ages of 25 senior citizens were as follows:
Referring to Scenario 3-1, determine which of the following is the correct statement.
A) One fourth of the senior citizens sampled are below 65.5 years of age.
B) The middle 50% of the senior citizens sampled are between 65.5 and 73.0 years of age.
C) The mean age of senior citizens sampled is 73.5 years of age.
D) All of the above are correct.
Question
SCENARIO 3-1
Health care issues are receiving much attention in both academic and political arenas.A sociologist
recently conducted a survey of citizens over 60 years of age whose net worth is too high to qualify for
Medicaid.The ages of 25 senior citizens were as follows:
Referring to Scenario 3-1, identify which of the following is the correct statement.
A) One fourth of the senior citizens sampled are below 64 years of age.
B) The middle 50% of the senior citizens sampled are between 65.5 and 73.0 years of age.
C) 25% of the senior citizens sampled are older than 81.5 years of age.
D) All of the above are correct.
Question
Question
SCENARIO 3-1
Health care issues are receiving much attention in both academic and political arenas.A sociologist
recently conducted a survey of citizens over 60 years of age whose net worth is too high to qualify for
Medicaid.The ages of 25 senior citizens were as follows:
Referring to Scenario 3-1, calculate the variance of the ages of the senior citizens correct to the
nearest hundredth of a year squared.
Question
Question
Question
Question
Question
Question
Question
Question
Question
True or False: In a sample of size 40, the sample mean is 15.In this case, the sum of all
observations in the sample is
observations in the sample is
Question
Question
Question
Question
SCENARIO 3-2
The data below represent the amount of grams of carbohydrates in a serving of breakfast cereal in a
sample of 11 different servings.
Referring to Scenario 3-2, the arithmetic mean carbohydrates in this sample is ________ grams.
The data below represent the amount of grams of carbohydrates in a serving of breakfast cereal in a
sample of 11 different servings.
Referring to Scenario 3-2, the arithmetic mean carbohydrates in this sample is ________ grams.
Question
Question
SCENARIO 3-2
The data below represent the amount of grams of carbohydrates in a serving of breakfast cereal in a
sample of 11 different servings.
Referring to Scenario 3-2, the median carbohydrate amount in the cereal is ________ grams.
The data below represent the amount of grams of carbohydrates in a serving of breakfast cereal in a
sample of 11 different servings.
Referring to Scenario 3-2, the median carbohydrate amount in the cereal is ________ grams.
Question
Question
Question
Question
Question
Question
SCENARIO 3-2
The data below represent the amount of grams of carbohydrates in a serving of breakfast cereal in a
sample of 11 different servings.
Referring to Scenario 3-2, the range in the carbohydrate amounts is ________ grams.
The data below represent the amount of grams of carbohydrates in a serving of breakfast cereal in a
sample of 11 different servings.
Referring to Scenario 3-2, the range in the carbohydrate amounts is ________ grams.
Question
SCENARIO 3-3
The ordered array below represents the number of vitamin supplements sold by a health food store in
a sample of 16 days. Note: For this sample, the sum of the values is 448, and the sum of the squared differences between
each value and the mean is 812.
Referring to Scenario 3-3, is the number of vitamin supplements sold in this sample lepokurtic or
platykurtic?
The ordered array below represents the number of vitamin supplements sold by a health food store in
a sample of 16 days.
Note: For this sample, the sum of the values is 448, and the sum of the squared differences betweeneach value and the mean is 812.
Referring to Scenario 3-3, is the number of vitamin supplements sold in this sample lepokurtic or
platykurtic?
Question
SCENARIO 3-3
The ordered array below represents the number of vitamin supplements sold by a health food store in
a sample of 16 days. Note: For this sample, the sum of the values is 448, and the sum of the squared differences between
each value and the mean is 812.
Referring to Scenario 3-3, the range of the number of vitamin supplements sold in this sample is
________.
The ordered array below represents the number of vitamin supplements sold by a health food store in
a sample of 16 days.
Note: For this sample, the sum of the values is 448, and the sum of the squared differences betweeneach value and the mean is 812.
Referring to Scenario 3-3, the range of the number of vitamin supplements sold in this sample is
________.
Question
SCENARIO 3-3
The ordered array below represents the number of vitamin supplements sold by a health food store in
a sample of 16 days. Note: For this sample, the sum of the values is 448, and the sum of the squared differences between
each value and the mean is 812.
Referring to Scenario 3-3, the kurtosis statitic of the number of vitamin supplements sold in this
sample is ________.
The ordered array below represents the number of vitamin supplements sold by a health food store in
a sample of 16 days.
Note: For this sample, the sum of the values is 448, and the sum of the squared differences betweeneach value and the mean is 812.
Referring to Scenario 3-3, the kurtosis statitic of the number of vitamin supplements sold in this
sample is ________.
Question
SCENARIO 3-2
The data below represent the amount of grams of carbohydrates in a serving of breakfast cereal in a
sample of 11 different servings.
Referring to Scenario 3-2, the kurtosis statistic for the carbohydrate amount in the cereal is
________.
The data below represent the amount of grams of carbohydrates in a serving of breakfast cereal in a
sample of 11 different servings.
Referring to Scenario 3-2, the kurtosis statistic for the carbohydrate amount in the cereal is
________.
Question
SCENARIO 3-2
The data below represent the amount of grams of carbohydrates in a serving of breakfast cereal in a
sample of 11 different servings.
Referring to Scenario 3-2, the third quartile of the carbohydrate amounts is ________ grams.
The data below represent the amount of grams of carbohydrates in a serving of breakfast cereal in a
sample of 11 different servings.
Referring to Scenario 3-2, the third quartile of the carbohydrate amounts is ________ grams.
Question
SCENARIO 3-3
The ordered array below represents the number of vitamin supplements sold by a health food store in
a sample of 16 days. Note: For this sample, the sum of the values is 448, and the sum of the squared differences between
each value and the mean is 812.
Referring to Scenario 3-3, the interquartile range of the number of vitamin supplements sold in
this sample is ________.
The ordered array below represents the number of vitamin supplements sold by a health food store in
a sample of 16 days.
Note: For this sample, the sum of the values is 448, and the sum of the squared differences betweeneach value and the mean is 812.
Referring to Scenario 3-3, the interquartile range of the number of vitamin supplements sold in
this sample is ________.
Question
SCENARIO 3-2
The data below represent the amount of grams of carbohydrates in a serving of breakfast cereal in a
sample of 11 different servings.
Referring to Scenario 3-2, the interquartile range in the carbohydrate amounts is ________ grams.
The data below represent the amount of grams of carbohydrates in a serving of breakfast cereal in a
sample of 11 different servings.
Referring to Scenario 3-2, the interquartile range in the carbohydrate amounts is ________ grams.
Question
SCENARIO 3-2
The data below represent the amount of grams of carbohydrates in a serving of breakfast cereal in a
sample of 11 different servings.
Referring to Scenario 3-2, construct a boxplot for the carbohydrate amounts.
The data below represent the amount of grams of carbohydrates in a serving of breakfast cereal in a
sample of 11 different servings.
Referring to Scenario 3-2, construct a boxplot for the carbohydrate amounts.
Question
SCENARIO 3-3
The ordered array below represents the number of vitamin supplements sold by a health food store in
a sample of 16 days. Note: For this sample, the sum of the values is 448, and the sum of the squared differences between
each value and the mean is 812.
Referring to Scenario 3-3, what type of shape does the distribution of the sample appear to have?
The ordered array below represents the number of vitamin supplements sold by a health food store in
a sample of 16 days.
Note: For this sample, the sum of the values is 448, and the sum of the squared differences betweeneach value and the mean is 812.
Referring to Scenario 3-3, what type of shape does the distribution of the sample appear to have?
Question
SCENARIO 3-3
The ordered array below represents the number of vitamin supplements sold by a health food store in
a sample of 16 days. Note: For this sample, the sum of the values is 448, and the sum of the squared differences between
each value and the mean is 812.
Referring to Scenario 3-3, is the number of vitamin supplements sold in this sample right- or left-
skewed?
The ordered array below represents the number of vitamin supplements sold by a health food store in
a sample of 16 days.
Note: For this sample, the sum of the values is 448, and the sum of the squared differences betweeneach value and the mean is 812.
Referring to Scenario 3-3, is the number of vitamin supplements sold in this sample right- or left-
skewed?
Question
SCENARIO 3-2
The data below represent the amount of grams of carbohydrates in a serving of breakfast cereal in a
sample of 11 different servings.
Referring to Scenario 3-2, the five-number summary of the carbohydrate amounts consists of
________, ________, ________, ________, ________.
The data below represent the amount of grams of carbohydrates in a serving of breakfast cereal in a
sample of 11 different servings.
Referring to Scenario 3-2, the five-number summary of the carbohydrate amounts consists of
________, ________, ________, ________, ________.
Question
SCENARIO 3-3
The ordered array below represents the number of vitamin supplements sold by a health food store in
a sample of 16 days. Note: For this sample, the sum of the values is 448, and the sum of the squared differences between
each value and the mean is 812.
Referring to Scenario 3-3, the arithmetic mean of the number of vitamin supplements sold in this
sample is ________.
The ordered array below represents the number of vitamin supplements sold by a health food store in
a sample of 16 days.
Note: For this sample, the sum of the values is 448, and the sum of the squared differences betweeneach value and the mean is 812.
Referring to Scenario 3-3, the arithmetic mean of the number of vitamin supplements sold in this
sample is ________.
Question
SCENARIO 3-3
The ordered array below represents the number of vitamin supplements sold by a health food store in
a sample of 16 days. Note: For this sample, the sum of the values is 448, and the sum of the squared differences between
each value and the mean is 812.
Referring to Scenario 3-3, the five-number summary of the data in this sample consists of
________, ________, ________, ________, ________.
The ordered array below represents the number of vitamin supplements sold by a health food store in
a sample of 16 days.
Note: For this sample, the sum of the values is 448, and the sum of the squared differences betweeneach value and the mean is 812.
Referring to Scenario 3-3, the five-number summary of the data in this sample consists of
________, ________, ________, ________, ________.
Question
SCENARIO 3-2
The data below represent the amount of grams of carbohydrates in a serving of breakfast cereal in a
sample of 11 different servings.
Referring to Scenario 3-2, is the carbohydrate amount in the cereal leptokurtic or platykurtic?
The data below represent the amount of grams of carbohydrates in a serving of breakfast cereal in a
sample of 11 different servings.
Referring to Scenario 3-2, is the carbohydrate amount in the cereal leptokurtic or platykurtic?
Question
SCENARIO 3-2
The data below represent the amount of grams of carbohydrates in a serving of breakfast cereal in a
sample of 11 different servings.
Referring to Scenario 3-2, is the carbohydrate amount in the cereal right- or left-skewed?
The data below represent the amount of grams of carbohydrates in a serving of breakfast cereal in a
sample of 11 different servings.
Referring to Scenario 3-2, is the carbohydrate amount in the cereal right- or left-skewed?
Question
SCENARIO 3-3
The ordered array below represents the number of vitamin supplements sold by a health food store in
a sample of 16 days. Note: For this sample, the sum of the values is 448, and the sum of the squared differences between
each value and the mean is 812.
Referring to Scenario 3-3, the third quartile of the number of vitamin supplements sold in this
sample is ________.
The ordered array below represents the number of vitamin supplements sold by a health food store in
a sample of 16 days.
Note: For this sample, the sum of the values is 448, and the sum of the squared differences betweeneach value and the mean is 812.
Referring to Scenario 3-3, the third quartile of the number of vitamin supplements sold in this
sample is ________.
Question
SCENARIO 3-2
The data below represent the amount of grams of carbohydrates in a serving of breakfast cereal in a
sample of 11 different servings.
Referring to Scenario 3-2, the first quartile of the carbohydrate amounts is ________ grams.
The data below represent the amount of grams of carbohydrates in a serving of breakfast cereal in a
sample of 11 different servings.
Referring to Scenario 3-2, the first quartile of the carbohydrate amounts is ________ grams.
Question
SCENARIO 3-3
The ordered array below represents the number of vitamin supplements sold by a health food store in
a sample of 16 days. Note: For this sample, the sum of the values is 448, and the sum of the squared differences between
each value and the mean is 812.
Referring to Scenario 3-3, construct a boxplot for the data in this sample.
The ordered array below represents the number of vitamin supplements sold by a health food store in
a sample of 16 days.
Note: For this sample, the sum of the values is 448, and the sum of the squared differences betweeneach value and the mean is 812.
Referring to Scenario 3-3, construct a boxplot for the data in this sample.
Question
SCENARIO 3-3
The ordered array below represents the number of vitamin supplements sold by a health food store in
a sample of 16 days. Note: For this sample, the sum of the values is 448, and the sum of the squared differences between
each value and the mean is 812.
Referring to Scenario 3-3, the first quartile of the number of vitamin supplements sold in this
sample is ________.
The ordered array below represents the number of vitamin supplements sold by a health food store in
a sample of 16 days.
Note: For this sample, the sum of the values is 448, and the sum of the squared differences betweeneach value and the mean is 812.
Referring to Scenario 3-3, the first quartile of the number of vitamin supplements sold in this
sample is ________.

Unlock Deck
Sign up to unlock the cards in this deck!
Unlock Deck
Unlock Deck
1/80
Play
Full screen (f)
Deck 3: Numerical Descriptive Measures
1
Which of the following is NOT sensitive to extreme values?
A) The range.
B) The standard deviation.
C) The interquartile range.
D) The coefficient of variation.
A) The range.
B) The standard deviation.
C) The interquartile range.
D) The coefficient of variation.
C
2
According to the empirical rule, if the data form a "bell-shaped" normal distribution, _______
Percent of the observations will be contained within 2 standard deviations around the arithmetic
Mean.
A) 68.26
B) 88.89
C) 93.75
D) 95.44
Percent of the observations will be contained within 2 standard deviations around the arithmetic
Mean.
A) 68.26
B) 88.89
C) 93.75
D) 95.44
D
3
According to the empirical rule, if the data form a "bell-shaped" normal distribution, _______
Percent of the observations will be contained within 1 standard deviation around the arithmetic
Mean.
A) 68.26
B) 75.00
C) 88.89
D) 93.75
Percent of the observations will be contained within 1 standard deviation around the arithmetic
Mean.
A) 68.26
B) 75.00
C) 88.89
D) 93.75
A
4
Which measure of central tendency can be used for both numerical and categorical variables?
A) Arithmetic mean.
B) Median.
C) Mode.
D) Geometric mean.
A) Arithmetic mean.
B) Median.
C) Mode.
D) Geometric mean.
Unlock Deck
Unlock for access to all 80 flashcards in this deck.
Unlock Deck
k this deck
5
In a right-skewed distribution
A) the median equals the arithmetic mean.
B) the median is less than the arithmetic mean.
C) the median is greater than the arithmetic mean.
D) none of the above.
A) the median equals the arithmetic mean.
B) the median is less than the arithmetic mean.
C) the median is greater than the arithmetic mean.
D) none of the above.
Unlock Deck
Unlock for access to all 80 flashcards in this deck.
Unlock Deck
k this deck
6
Which of the arithmetic mean, median, mode, and geometric mean are resistant measures of
Central tendency?
A) The arithmetic mean and median only.
B) The median and mode only.
C) The mode and geometric mean only.
D) The arithmetic mean and mode only.
Central tendency?
A) The arithmetic mean and median only.
B) The median and mode only.
C) The mode and geometric mean only.
D) The arithmetic mean and mode only.
Unlock Deck
Unlock for access to all 80 flashcards in this deck.
Unlock Deck
k this deck
7
When extreme values are present in a set of data, which of the following descriptive summary
Measures are most appropriate:
A) CV and range.
B) arithmetic mean and standard deviation.
C) interquartile range and median.
D) variance and interquartile range.
Measures are most appropriate:
A) CV and range.
B) arithmetic mean and standard deviation.
C) interquartile range and median.
D) variance and interquartile range.
Unlock Deck
Unlock for access to all 80 flashcards in this deck.
Unlock Deck
k this deck
8
Which of the following is NOT a measure of central tendency?
A) The arithmetic mean.
B) The geometric mean.
C) The mode.
D) The interquartile range.
A) The arithmetic mean.
B) The geometric mean.
C) The mode.
D) The interquartile range.
Unlock Deck
Unlock for access to all 80 flashcards in this deck.
Unlock Deck
k this deck
9
Which of the following statements about the median is not true?
A) It is more affected by extreme values than the arithmetic mean.
B) It is a measure of central tendency.
C) It is equal to
D) It is equal to the mode in bell-shaped "normal" distributions.
A) It is more affected by extreme values than the arithmetic mean.
B) It is a measure of central tendency.
C) It is equal to
D) It is equal to the mode in bell-shaped "normal" distributions.
Unlock Deck
Unlock for access to all 80 flashcards in this deck.
Unlock Deck
k this deck
10
In perfectly symmetrical distributions, which of the following is NOT a correct statement?
A) The distance from Q1 to Q2 equals to the distance from Q2 to Q3.
B) The distance from the smallest observation to Q1 is the same as the distance from Q3 to the largest observation.
C) The distance from the smallest observation to Q2 is the same as the distance from Q2 to the largest observation.
D) The distance from Q1 to Q3 is half of the distance from the smallest to the largest observation.
Unlock Deck
Unlock for access to all 80 flashcards in this deck.
Unlock Deck
k this deck
11
In a perfectly symmetrical distribution
A) the range equals the interquartile range.
B) the interquartile range equals the arithmetic mean.
C) the median equals the arithmetic mean.
D) the variance equals the standard deviation.
A) the range equals the interquartile range.
B) the interquartile range equals the arithmetic mean.
C) the median equals the arithmetic mean.
D) the variance equals the standard deviation.
Unlock Deck
Unlock for access to all 80 flashcards in this deck.
Unlock Deck
k this deck
12
In left-skewed distributions, which of the following is the correct statement?
A) The distance from Q1 to Q2 is smaller than the distance from Q2 to Q3.
B) The distance from the smallest observation to Q1 is larger than the distance from Q3 to the largest observation.
C) The distance from the smallest observation to Q2 is less than the distance from Q2 to the largest observation.
D) The distance from Q1 to Q3 is twice the distance from the Q1 to Q2.
Unlock Deck
Unlock for access to all 80 flashcards in this deck.
Unlock Deck
k this deck
13
Which descriptive summary measures are considered to be resistant statistics?
A) The arithmetic mean and standard deviation.
B) The interquartile range and range.
C) The mode and variance.
D) The median and interquartile range.
A) The arithmetic mean and standard deviation.
B) The interquartile range and range.
C) The mode and variance.
D) The median and interquartile range.
Unlock Deck
Unlock for access to all 80 flashcards in this deck.
Unlock Deck
k this deck
14
In general, which of the following descriptive summary measures cannot be easily approximated
From a boxplot?
A) The variance.
B) The range.
C) The interquartile range.
D) The median.
From a boxplot?
A) The variance.
B) The range.
C) The interquartile range.
D) The median.
Unlock Deck
Unlock for access to all 80 flashcards in this deck.
Unlock Deck
k this deck
15
The smaller the spread of scores around the arithmetic mean,
A) the smaller the interquartile range.
B) the smaller the standard deviation.
C) the smaller the coefficient of variation.
D) All the above.
A) the smaller the interquartile range.
B) the smaller the standard deviation.
C) the smaller the coefficient of variation.
D) All the above.
Unlock Deck
Unlock for access to all 80 flashcards in this deck.
Unlock Deck
k this deck
16
In right-skewed distributions, which of the following is the correct statement?
Unlock Deck
Unlock for access to all 80 flashcards in this deck.
Unlock Deck
k this deck
17
Which of the following is sensitive to extreme values?
A) The median.
B) The interquartile range.
C) The arithmetic mean.
D) The 1st quartile.
A) The median.
B) The interquartile range.
C) The arithmetic mean.
D) The 1st quartile.
Unlock Deck
Unlock for access to all 80 flashcards in this deck.
Unlock Deck
k this deck
18
In a perfectly symmetrical bell-shaped "normal" distribution
A) the arithmetic mean equals the median.
B) the median equals the mode.
C) the arithmetic mean equals the mode.
D) All the above.
A) the arithmetic mean equals the median.
B) the median equals the mode.
C) the arithmetic mean equals the mode.
D) All the above.
Unlock Deck
Unlock for access to all 80 flashcards in this deck.
Unlock Deck
k this deck
19
Which of the following statistics is not a measure of central tendency?
A) Arithmetic mean.
B) Median.
C) Mode.
D) Q3.
A) Arithmetic mean.
B) Median.
C) Mode.
D) Q3.
Unlock Deck
Unlock for access to all 80 flashcards in this deck.
Unlock Deck
k this deck
20
According to the empirical rule, if the data form a "bell-shaped" normal distribution, _______
Percent of the observations will be contained within 3 standard deviations around the arithmetic
Mean.
A) 68.26
B) 75.00
C) 95.0
D) 99.7
Percent of the observations will be contained within 3 standard deviations around the arithmetic
Mean.
A) 68.26
B) 75.00
C) 95.0
D) 99.7
Unlock Deck
Unlock for access to all 80 flashcards in this deck.
Unlock Deck
k this deck
21
SCENARIO 3-1
Health care issues are receiving much attention in both academic and political arenas.A sociologist
recently conducted a survey of citizens over 60 years of age whose net worth is too high to qualify for
Medicaid.The ages of 25 senior citizens were as follows:
Referring to Scenario 3-1, what type of shape does the distribution of the sample appear to have?
Unlock Deck
Unlock for access to all 80 flashcards in this deck.
Unlock Deck
k this deck
22
True or False: The five-number summary consists of the smallest value, the first quartile, the
median, the third quartile, and the largest value.
median, the third quartile, and the largest value.
Unlock Deck
Unlock for access to all 80 flashcards in this deck.
Unlock Deck
k this deck
23
True or False: In left-skewed distributions, the distance from the smallest value to Q1 is greater
than the distance from Q3 to the largest value.
than the distance from Q3 to the largest value.
Unlock Deck
Unlock for access to all 80 flashcards in this deck.
Unlock Deck
k this deck
24
True or False: A boxplot is a graphical representation of a five-number summary.
Unlock Deck
Unlock for access to all 80 flashcards in this deck.
Unlock Deck
k this deck
25
True or False: In a set of numerical data, the value for Q3 can never be smaller than the value for
Q1.
Q1.
Unlock Deck
Unlock for access to all 80 flashcards in this deck.
Unlock Deck
k this deck
26
SCENARIO 3-1
Health care issues are receiving much attention in both academic and political arenas.A sociologist
recently conducted a survey of citizens over 60 years of age whose net worth is too high to qualify for
Medicaid.The ages of 25 senior citizens were as follows:
Referring to Scenario 3-1, calculate the kurtosis statistic for the age of the senior citizens accurate
to two decimal places.
Unlock Deck
Unlock for access to all 80 flashcards in this deck.
Unlock Deck
k this deck
27
According to the Chebyshev rule, at least what percentage of the observations in any data set are
Contained within a distance of 2 standard deviations around the mean?
A) 67%
B) 75%
C) 88.89%
D) 95%
Contained within a distance of 2 standard deviations around the mean?
A) 67%
B) 75%
C) 88.89%
D) 95%
Unlock Deck
Unlock for access to all 80 flashcards in this deck.
Unlock Deck
k this deck
28
Which of the following is the easiest to compute?
A) The arithmetic mean.
B) The median.
C) The mode.
D) The geometric mean.
A) The arithmetic mean.
B) The median.
C) The mode.
D) The geometric mean.
Unlock Deck
Unlock for access to all 80 flashcards in this deck.
Unlock Deck
k this deck
29
True or False: In a set of numerical data, the value for Q2 is always halfway between Q1 and Q3.
Unlock Deck
Unlock for access to all 80 flashcards in this deck.
Unlock Deck
k this deck
30
SCENARIO 3-1
Health care issues are receiving much attention in both academic and political arenas.A sociologist
recently conducted a survey of citizens over 60 years of age whose net worth is too high to qualify for
Medicaid.The ages of 25 senior citizens were as follows:
Referring to Scenario 3-1, does the distribution of the sample appear to be lepokurtic or
platykurtic?
Unlock Deck
Unlock for access to all 80 flashcards in this deck.
Unlock Deck
k this deck
31
SCENARIO 3-1
Health care issues are receiving much attention in both academic and political arenas.A sociologist
recently conducted a survey of citizens over 60 years of age whose net worth is too high to qualify for
Medicaid.The ages of 25 senior citizens were as follows:
Referring to Scenario 3-1, determine the interquartile range of the ages of the senior citizens.
Unlock Deck
Unlock for access to all 80 flashcards in this deck.
Unlock Deck
k this deck
32
True or False: If the distribution of a data set were perfectly symmetrical, the distance from Q1 to
the median would always equal the distance from Q3 to the median in a boxplot.
the median would always equal the distance from Q3 to the median in a boxplot.
Unlock Deck
Unlock for access to all 80 flashcards in this deck.
Unlock Deck
k this deck
33
According to the Chebyshev rule, at least 93.75% of all observations in any data set are contained
Within a distance of how many standard deviations around the mean?
A) 1
B) 2
C) 3
D) 4
Within a distance of how many standard deviations around the mean?
A) 1
B) 2
C) 3
D) 4
Unlock Deck
Unlock for access to all 80 flashcards in this deck.
Unlock Deck
k this deck
34
According to the Chebyshev rule, at least what percentage of the observations in any data set are
Contained within a distance of 3 standard deviations around the mean?
A) 67%
B) 75%
C) 88.89%
D) 99.7%
Contained within a distance of 3 standard deviations around the mean?
A) 67%
B) 75%
C) 88.89%
D) 99.7%
Unlock Deck
Unlock for access to all 80 flashcards in this deck.
Unlock Deck
k this deck
35
A manufacturer of flashlight batteries took a sample of 130 batteries from a day's production and
Used them continuously until they were drained.The number of hours until failure are recorded.
Given below is the boxplot of the number of hours it took to drain each of the 130 batteries.The
Distribution of the number of hours is
Used them continuously until they were drained.The number of hours until failure are recorded.
Given below is the boxplot of the number of hours it took to drain each of the 130 batteries.The
Distribution of the number of hours is
Unlock Deck
Unlock for access to all 80 flashcards in this deck.
Unlock Deck
k this deck
36
True or False: In right-skewed distributions, the distance from Q3 to the largest value is greater
than the distance from the smallest observation to Q1.
than the distance from the smallest observation to Q1.
Unlock Deck
Unlock for access to all 80 flashcards in this deck.
Unlock Deck
k this deck
37
SCENARIO 3-1
Health care issues are receiving much attention in both academic and political arenas.A sociologist
recently conducted a survey of citizens over 60 years of age whose net worth is too high to qualify for
Medicaid.The ages of 25 senior citizens were as follows:
Referring to Scenario 3-1, determine which of the following is the correct statement.
A) One fourth of the senior citizens sampled are below 65.5 years of age.
B) The middle 50% of the senior citizens sampled are between 65.5 and 73.0 years of age.
C) The mean age of senior citizens sampled is 73.5 years of age.
D) All of the above are correct.
Unlock Deck
Unlock for access to all 80 flashcards in this deck.
Unlock Deck
k this deck
38
SCENARIO 3-1
Health care issues are receiving much attention in both academic and political arenas.A sociologist
recently conducted a survey of citizens over 60 years of age whose net worth is too high to qualify for
Medicaid.The ages of 25 senior citizens were as follows:
Referring to Scenario 3-1, identify which of the following is the correct statement.
A) One fourth of the senior citizens sampled are below 64 years of age.
B) The middle 50% of the senior citizens sampled are between 65.5 and 73.0 years of age.
C) 25% of the senior citizens sampled are older than 81.5 years of age.
D) All of the above are correct.
Unlock Deck
Unlock for access to all 80 flashcards in this deck.
Unlock Deck
k this deck
39
According to the Chebyshev rule, at least 75% of all observations in any data set are contained
Within a distance of how many standard deviations around the mean?
A) 1
B) 2
C) 3
D) 4
Within a distance of how many standard deviations around the mean?
A) 1
B) 2
C) 3
D) 4
Unlock Deck
Unlock for access to all 80 flashcards in this deck.
Unlock Deck
k this deck
40
SCENARIO 3-1
Health care issues are receiving much attention in both academic and political arenas.A sociologist
recently conducted a survey of citizens over 60 years of age whose net worth is too high to qualify for
Medicaid.The ages of 25 senior citizens were as follows:
Referring to Scenario 3-1, calculate the variance of the ages of the senior citizens correct to the
nearest hundredth of a year squared.
Unlock Deck
Unlock for access to all 80 flashcards in this deck.
Unlock Deck
k this deck
41
True or False: The line drawn within the box of the boxplot always represents the median.
Unlock Deck
Unlock for access to all 80 flashcards in this deck.
Unlock Deck
k this deck
42
True or False: In exploratory data analysis, a boxplot can be used to illustrate the median,
quartiles, and extreme values.
quartiles, and extreme values.
Unlock Deck
Unlock for access to all 80 flashcards in this deck.
Unlock Deck
k this deck
43
True or False: The interquartile range is a measure of central tendency in a set of data.
Unlock Deck
Unlock for access to all 80 flashcards in this deck.
Unlock Deck
k this deck
44
True or False: The coefficient of variation is a measure of relative variation.
Unlock Deck
Unlock for access to all 80 flashcards in this deck.
Unlock Deck
k this deck
45
True or False: If the data set is approximately bell-shaped, the empirical rule will more accurately
reflect the greater concentration of data close to the mean as compared to the Chebyshev rule.
reflect the greater concentration of data close to the mean as compared to the Chebyshev rule.
Unlock Deck
Unlock for access to all 80 flashcards in this deck.
Unlock Deck
k this deck
46
If the arithmetic mean of a numerical data set is greater than the median, the data are considered
to be _______ skewed.
to be _______ skewed.
Unlock Deck
Unlock for access to all 80 flashcards in this deck.
Unlock Deck
k this deck
47
True or False: The line drawn within the box of the boxplot always represents the arithmetic
mean.
mean.
Unlock Deck
Unlock for access to all 80 flashcards in this deck.
Unlock Deck
k this deck
48
True or False: A population with 200 elements has an arithmetic mean of 10.From this
information, it can be shown that the population standard deviation is 15.
information, it can be shown that the population standard deviation is 15.
Unlock Deck
Unlock for access to all 80 flashcards in this deck.
Unlock Deck
k this deck
49
True or False: In a sample of size 40, the sample mean is 15.In this case, the sum of all
observations in the sample is
observations in the sample is
Unlock Deck
Unlock for access to all 80 flashcards in this deck.
Unlock Deck
k this deck
50
True or False: The geometric mean is useful in measuring the rate of change of a variable over
time.
time.
Unlock Deck
Unlock for access to all 80 flashcards in this deck.
Unlock Deck
k this deck
51
True or False: The coefficient of variation measures variability in a data set relative to the size of
the arithmetic mean.
the arithmetic mean.
Unlock Deck
Unlock for access to all 80 flashcards in this deck.
Unlock Deck
k this deck
52
True or False: The geometric mean is a measure of variation or dispersion in a set of data.
Unlock Deck
Unlock for access to all 80 flashcards in this deck.
Unlock Deck
k this deck
53
SCENARIO 3-2
The data below represent the amount of grams of carbohydrates in a serving of breakfast cereal in a
sample of 11 different servings.
Referring to Scenario 3-2, the arithmetic mean carbohydrates in this sample is ________ grams.
The data below represent the amount of grams of carbohydrates in a serving of breakfast cereal in a
sample of 11 different servings.
Referring to Scenario 3-2, the arithmetic mean carbohydrates in this sample is ________ grams.
Unlock Deck
Unlock for access to all 80 flashcards in this deck.
Unlock Deck
k this deck
54
True or False: In a boxplot, the box portion represents the data between the first and third quartile
values.
values.
Unlock Deck
Unlock for access to all 80 flashcards in this deck.
Unlock Deck
k this deck
55
SCENARIO 3-2
The data below represent the amount of grams of carbohydrates in a serving of breakfast cereal in a
sample of 11 different servings.
Referring to Scenario 3-2, the median carbohydrate amount in the cereal is ________ grams.
The data below represent the amount of grams of carbohydrates in a serving of breakfast cereal in a
sample of 11 different servings.
Referring to Scenario 3-2, the median carbohydrate amount in the cereal is ________ grams.
Unlock Deck
Unlock for access to all 80 flashcards in this deck.
Unlock Deck
k this deck
56
True or False: The interquartile range is a measure of variation or dispersion in a set of data.
Unlock Deck
Unlock for access to all 80 flashcards in this deck.
Unlock Deck
k this deck
57
True or False: The coefficient of variation is a measure of central tendency in the data.
Unlock Deck
Unlock for access to all 80 flashcards in this deck.
Unlock Deck
k this deck
58
True or False: The coefficient of variation is expressed as a percentage.
Unlock Deck
Unlock for access to all 80 flashcards in this deck.
Unlock Deck
k this deck
59
True or False: The median of a data set with 20 items would be the average of the 10th and the
11th items in the ordered array.
11th items in the ordered array.
Unlock Deck
Unlock for access to all 80 flashcards in this deck.
Unlock Deck
k this deck
60
True or False: If a set of data is perfectly symmetrical, the arithmetic mean must be identical to
the median.
the median.
Unlock Deck
Unlock for access to all 80 flashcards in this deck.
Unlock Deck
k this deck
61
SCENARIO 3-2
The data below represent the amount of grams of carbohydrates in a serving of breakfast cereal in a
sample of 11 different servings.
Referring to Scenario 3-2, the range in the carbohydrate amounts is ________ grams.
The data below represent the amount of grams of carbohydrates in a serving of breakfast cereal in a
sample of 11 different servings.
Referring to Scenario 3-2, the range in the carbohydrate amounts is ________ grams.
Unlock Deck
Unlock for access to all 80 flashcards in this deck.
Unlock Deck
k this deck
62
SCENARIO 3-3
The ordered array below represents the number of vitamin supplements sold by a health food store in
a sample of 16 days. Note: For this sample, the sum of the values is 448, and the sum of the squared differences between
each value and the mean is 812.
Referring to Scenario 3-3, is the number of vitamin supplements sold in this sample lepokurtic or
platykurtic?
The ordered array below represents the number of vitamin supplements sold by a health food store in
a sample of 16 days.
Note: For this sample, the sum of the values is 448, and the sum of the squared differences betweeneach value and the mean is 812.
Referring to Scenario 3-3, is the number of vitamin supplements sold in this sample lepokurtic or
platykurtic?
Unlock Deck
Unlock for access to all 80 flashcards in this deck.
Unlock Deck
k this deck
63
SCENARIO 3-3
The ordered array below represents the number of vitamin supplements sold by a health food store in
a sample of 16 days. Note: For this sample, the sum of the values is 448, and the sum of the squared differences between
each value and the mean is 812.
Referring to Scenario 3-3, the range of the number of vitamin supplements sold in this sample is
________.
The ordered array below represents the number of vitamin supplements sold by a health food store in
a sample of 16 days.
Note: For this sample, the sum of the values is 448, and the sum of the squared differences betweeneach value and the mean is 812.
Referring to Scenario 3-3, the range of the number of vitamin supplements sold in this sample is
________.
Unlock Deck
Unlock for access to all 80 flashcards in this deck.
Unlock Deck
k this deck
64
SCENARIO 3-3
The ordered array below represents the number of vitamin supplements sold by a health food store in
a sample of 16 days. Note: For this sample, the sum of the values is 448, and the sum of the squared differences between
each value and the mean is 812.
Referring to Scenario 3-3, the kurtosis statitic of the number of vitamin supplements sold in this
sample is ________.
The ordered array below represents the number of vitamin supplements sold by a health food store in
a sample of 16 days.
Note: For this sample, the sum of the values is 448, and the sum of the squared differences betweeneach value and the mean is 812.
Referring to Scenario 3-3, the kurtosis statitic of the number of vitamin supplements sold in this
sample is ________.
Unlock Deck
Unlock for access to all 80 flashcards in this deck.
Unlock Deck
k this deck
65
SCENARIO 3-2
The data below represent the amount of grams of carbohydrates in a serving of breakfast cereal in a
sample of 11 different servings.
Referring to Scenario 3-2, the kurtosis statistic for the carbohydrate amount in the cereal is
________.
The data below represent the amount of grams of carbohydrates in a serving of breakfast cereal in a
sample of 11 different servings.
Referring to Scenario 3-2, the kurtosis statistic for the carbohydrate amount in the cereal is
________.
Unlock Deck
Unlock for access to all 80 flashcards in this deck.
Unlock Deck
k this deck
66
SCENARIO 3-2
The data below represent the amount of grams of carbohydrates in a serving of breakfast cereal in a
sample of 11 different servings.
Referring to Scenario 3-2, the third quartile of the carbohydrate amounts is ________ grams.
The data below represent the amount of grams of carbohydrates in a serving of breakfast cereal in a
sample of 11 different servings.
Referring to Scenario 3-2, the third quartile of the carbohydrate amounts is ________ grams.
Unlock Deck
Unlock for access to all 80 flashcards in this deck.
Unlock Deck
k this deck
67
SCENARIO 3-3
The ordered array below represents the number of vitamin supplements sold by a health food store in
a sample of 16 days. Note: For this sample, the sum of the values is 448, and the sum of the squared differences between
each value and the mean is 812.
Referring to Scenario 3-3, the interquartile range of the number of vitamin supplements sold in
this sample is ________.
The ordered array below represents the number of vitamin supplements sold by a health food store in
a sample of 16 days.
Note: For this sample, the sum of the values is 448, and the sum of the squared differences betweeneach value and the mean is 812.
Referring to Scenario 3-3, the interquartile range of the number of vitamin supplements sold in
this sample is ________.
Unlock Deck
Unlock for access to all 80 flashcards in this deck.
Unlock Deck
k this deck
68
SCENARIO 3-2
The data below represent the amount of grams of carbohydrates in a serving of breakfast cereal in a
sample of 11 different servings.
Referring to Scenario 3-2, the interquartile range in the carbohydrate amounts is ________ grams.
The data below represent the amount of grams of carbohydrates in a serving of breakfast cereal in a
sample of 11 different servings.
Referring to Scenario 3-2, the interquartile range in the carbohydrate amounts is ________ grams.
Unlock Deck
Unlock for access to all 80 flashcards in this deck.
Unlock Deck
k this deck
69
SCENARIO 3-2
The data below represent the amount of grams of carbohydrates in a serving of breakfast cereal in a
sample of 11 different servings.
Referring to Scenario 3-2, construct a boxplot for the carbohydrate amounts.
The data below represent the amount of grams of carbohydrates in a serving of breakfast cereal in a
sample of 11 different servings.
Referring to Scenario 3-2, construct a boxplot for the carbohydrate amounts.
Unlock Deck
Unlock for access to all 80 flashcards in this deck.
Unlock Deck
k this deck
70
SCENARIO 3-3
The ordered array below represents the number of vitamin supplements sold by a health food store in
a sample of 16 days. Note: For this sample, the sum of the values is 448, and the sum of the squared differences between
each value and the mean is 812.
Referring to Scenario 3-3, what type of shape does the distribution of the sample appear to have?
The ordered array below represents the number of vitamin supplements sold by a health food store in
a sample of 16 days.
Note: For this sample, the sum of the values is 448, and the sum of the squared differences betweeneach value and the mean is 812.
Referring to Scenario 3-3, what type of shape does the distribution of the sample appear to have?
Unlock Deck
Unlock for access to all 80 flashcards in this deck.
Unlock Deck
k this deck
71
SCENARIO 3-3
The ordered array below represents the number of vitamin supplements sold by a health food store in
a sample of 16 days. Note: For this sample, the sum of the values is 448, and the sum of the squared differences between
each value and the mean is 812.
Referring to Scenario 3-3, is the number of vitamin supplements sold in this sample right- or left-
skewed?
The ordered array below represents the number of vitamin supplements sold by a health food store in
a sample of 16 days.
Note: For this sample, the sum of the values is 448, and the sum of the squared differences betweeneach value and the mean is 812.
Referring to Scenario 3-3, is the number of vitamin supplements sold in this sample right- or left-
skewed?
Unlock Deck
Unlock for access to all 80 flashcards in this deck.
Unlock Deck
k this deck
72
SCENARIO 3-2
The data below represent the amount of grams of carbohydrates in a serving of breakfast cereal in a
sample of 11 different servings.
Referring to Scenario 3-2, the five-number summary of the carbohydrate amounts consists of
________, ________, ________, ________, ________.
The data below represent the amount of grams of carbohydrates in a serving of breakfast cereal in a
sample of 11 different servings.
Referring to Scenario 3-2, the five-number summary of the carbohydrate amounts consists of
________, ________, ________, ________, ________.
Unlock Deck
Unlock for access to all 80 flashcards in this deck.
Unlock Deck
k this deck
73
SCENARIO 3-3
The ordered array below represents the number of vitamin supplements sold by a health food store in
a sample of 16 days. Note: For this sample, the sum of the values is 448, and the sum of the squared differences between
each value and the mean is 812.
Referring to Scenario 3-3, the arithmetic mean of the number of vitamin supplements sold in this
sample is ________.
The ordered array below represents the number of vitamin supplements sold by a health food store in
a sample of 16 days.
Note: For this sample, the sum of the values is 448, and the sum of the squared differences betweeneach value and the mean is 812.
Referring to Scenario 3-3, the arithmetic mean of the number of vitamin supplements sold in this
sample is ________.
Unlock Deck
Unlock for access to all 80 flashcards in this deck.
Unlock Deck
k this deck
74
SCENARIO 3-3
The ordered array below represents the number of vitamin supplements sold by a health food store in
a sample of 16 days. Note: For this sample, the sum of the values is 448, and the sum of the squared differences between
each value and the mean is 812.
Referring to Scenario 3-3, the five-number summary of the data in this sample consists of
________, ________, ________, ________, ________.
The ordered array below represents the number of vitamin supplements sold by a health food store in
a sample of 16 days.
Note: For this sample, the sum of the values is 448, and the sum of the squared differences betweeneach value and the mean is 812.
Referring to Scenario 3-3, the five-number summary of the data in this sample consists of
________, ________, ________, ________, ________.
Unlock Deck
Unlock for access to all 80 flashcards in this deck.
Unlock Deck
k this deck
75
SCENARIO 3-2
The data below represent the amount of grams of carbohydrates in a serving of breakfast cereal in a
sample of 11 different servings.
Referring to Scenario 3-2, is the carbohydrate amount in the cereal leptokurtic or platykurtic?
The data below represent the amount of grams of carbohydrates in a serving of breakfast cereal in a
sample of 11 different servings.
Referring to Scenario 3-2, is the carbohydrate amount in the cereal leptokurtic or platykurtic?
Unlock Deck
Unlock for access to all 80 flashcards in this deck.
Unlock Deck
k this deck
76
SCENARIO 3-2
The data below represent the amount of grams of carbohydrates in a serving of breakfast cereal in a
sample of 11 different servings.
Referring to Scenario 3-2, is the carbohydrate amount in the cereal right- or left-skewed?
The data below represent the amount of grams of carbohydrates in a serving of breakfast cereal in a
sample of 11 different servings.
Referring to Scenario 3-2, is the carbohydrate amount in the cereal right- or left-skewed?
Unlock Deck
Unlock for access to all 80 flashcards in this deck.
Unlock Deck
k this deck
77
SCENARIO 3-3
The ordered array below represents the number of vitamin supplements sold by a health food store in
a sample of 16 days. Note: For this sample, the sum of the values is 448, and the sum of the squared differences between
each value and the mean is 812.
Referring to Scenario 3-3, the third quartile of the number of vitamin supplements sold in this
sample is ________.
The ordered array below represents the number of vitamin supplements sold by a health food store in
a sample of 16 days.
Note: For this sample, the sum of the values is 448, and the sum of the squared differences betweeneach value and the mean is 812.
Referring to Scenario 3-3, the third quartile of the number of vitamin supplements sold in this
sample is ________.
Unlock Deck
Unlock for access to all 80 flashcards in this deck.
Unlock Deck
k this deck
78
SCENARIO 3-2
The data below represent the amount of grams of carbohydrates in a serving of breakfast cereal in a
sample of 11 different servings.
Referring to Scenario 3-2, the first quartile of the carbohydrate amounts is ________ grams.
The data below represent the amount of grams of carbohydrates in a serving of breakfast cereal in a
sample of 11 different servings.
Referring to Scenario 3-2, the first quartile of the carbohydrate amounts is ________ grams.
Unlock Deck
Unlock for access to all 80 flashcards in this deck.
Unlock Deck
k this deck
79
SCENARIO 3-3
The ordered array below represents the number of vitamin supplements sold by a health food store in
a sample of 16 days. Note: For this sample, the sum of the values is 448, and the sum of the squared differences between
each value and the mean is 812.
Referring to Scenario 3-3, construct a boxplot for the data in this sample.
The ordered array below represents the number of vitamin supplements sold by a health food store in
a sample of 16 days.
Note: For this sample, the sum of the values is 448, and the sum of the squared differences betweeneach value and the mean is 812.
Referring to Scenario 3-3, construct a boxplot for the data in this sample.
Unlock Deck
Unlock for access to all 80 flashcards in this deck.
Unlock Deck
k this deck
80
SCENARIO 3-3
The ordered array below represents the number of vitamin supplements sold by a health food store in
a sample of 16 days. Note: For this sample, the sum of the values is 448, and the sum of the squared differences between
each value and the mean is 812.
Referring to Scenario 3-3, the first quartile of the number of vitamin supplements sold in this
sample is ________.
The ordered array below represents the number of vitamin supplements sold by a health food store in
a sample of 16 days.
Note: For this sample, the sum of the values is 448, and the sum of the squared differences betweeneach value and the mean is 812.
Referring to Scenario 3-3, the first quartile of the number of vitamin supplements sold in this
sample is ________.
Unlock Deck
Unlock for access to all 80 flashcards in this deck.
Unlock Deck
k this deck
Unlock Deck
Unlock for access to all 80 flashcards in this deck.


