Deck 9: Inferences From Two Samples
Full screen (f)
Question
Question
Question
Question
Question
Question
Question
Question
Question
Question
Question
Question
Question
Question
Question
Question
Complete the table to describe each symbol. 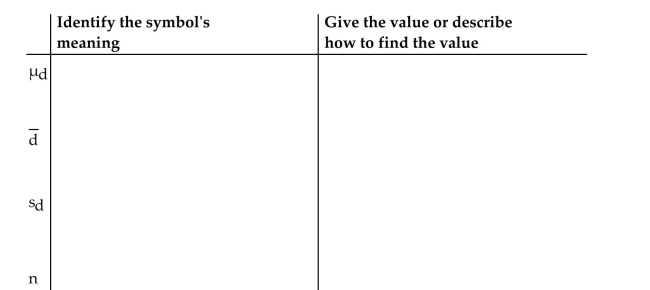
Question
Question
Question
Question
Question
Question
Question
Question
Question
Question
Question
Question
Question
Question
Question
Question
Question
Question
Question
Question
Question
Question
Question
Question
Question
Question
Question
Question
Question
Question
Question
Question
Question
Question
Question
Question
Question
Question
Question
Question
Question
Question
Question
Question
Question
Question
Question
Question
Question
Question
Question
Question
Question
Question
Question
Question
Question
Question
Question
Question
Question
Question
Question
Question

Unlock Deck
Sign up to unlock the cards in this deck!
Unlock Deck
Unlock Deck
1/134
Play
Full screen (f)
Deck 9: Inferences From Two Samples
1
A researcher wished to perform a hypothesis test to test the claim that the rate of defectives among the computers of two different manufacturers are the same. She selects two independent random samples and obtains the following sample data.
Manufacturer A: , rate of defectives:
Manufacturer , rate of defectives:
Can the methods of this section be used to perform a hypothesis test to test for the equality of the two population proportions? Go through the steps of checking whether the conditions for the hypothesis test for two population proportions are satisfied. Show your calculations and state your conclusion.
Because , the conditions for the hypothesis test are not satisfied.
2
Describe the process for testing a hypothesis about two population means when the samples are independent and small.
The hypotheses are and . The test statistic is . The critical value(s) are obtained using the . The value of the test statistic is compared with the critical value(s) and the null hypothesis is rejected if the test statistic falls in the critical region (which will happen if the difference between the sample means is sufficiently different from zero).
Alternatively, The P-value can be obtained using the -table and the null hypothesis is rejected if the -value is smaller than the significance level.
Alternatively, The P-value can be obtained using the -table and the null hypothesis is rejected if the -value is smaller than the significance level.
3
A researcher obtained independent simple random samples of men and women between the ages of 20 and 29. She finds that 35 of 410 men and 59 of 398 women suffered from insomnia at least once a week during the past year. Are the requirements for inference with the two-proportions z-test satisfied? Explain your answer.
The requirements are satisfied. The samples are both simple random samples. The samples are independent of each other. There are at least 5 successes and at least 5 failures in each sample.
4
Test the indicated claim about the means of two populations. Assume that the two samples are independent simple random samples selected from normally distributed populations. Do not assume that the population standard deviations
are equal. Use the traditional method or P-value method as indicated.
-Two types of flares are tested and their burning times (in minutes) are recorded. The summary statistics are given below.
Use a 0.05 significance level to test the claim that the two samples are from populations with the same mean. Use the traditional method of hypothesis testing.
Unlock Deck
Unlock for access to all 134 flashcards in this deck.
Unlock Deck
k this deck
5
Use the traditional method of hypothesis testing to test the given claim about the means of two populations. Assume that two dependent samples have been randomly selected from normally distributed populations.
-The table below shows the weights of seven subjects before and after following a particular diet for two months.
Using a 0.01 level of significance, test the claim that the diet is effective in reducing weight.
-The table below shows the weights of seven subjects before and after following a particular diet for two months.
Using a 0.01 level of significance, test the claim that the diet is effective in reducing weight.
Unlock Deck
Unlock for access to all 134 flashcards in this deck.
Unlock Deck
k this deck
6
A researcher wishes to determine whether listening to music affects students' performance on memory test. He randomly selects 50 students and has each student perform a memory test once while listening to music and once without listening to music. He obtains the mean and standard deviation of the 50 "with music" scores and obtains the mean and standard deviation of the 50 "without music scores". He then performs a hypothesis test for two means assuming large and independent samples. Is this approach appropriate? If not, how would you proceed.
Unlock Deck
Unlock for access to all 134 flashcards in this deck.
Unlock Deck
k this deck
7
Use the traditional method of hypothesis testing to test the given claim about the means of two populations. Assume that two dependent samples have been randomly selected from normally distributed populations.
-A coach uses a new technique to train gymnasts. 7 gymnasts were randomly selected and their competition scores were recorded before and after the training. The results are shown below.
Using a 0.01 level of significance, test the claim that the training technique is effective in raising the gymnasts' scores.
Unlock Deck
Unlock for access to all 134 flashcards in this deck.
Unlock Deck
k this deck
8
Test the indicated claim about the means of two populations. Assume that the two samples are independent simple random samples selected from normally distributed populations. Do not assume that the population standard deviations
are equal. Use the traditional method or P-value method as indicated.
-A researcher wishes to determine whether people with high blood pressure can reduce their blood pressure, measured in mm Hg, by following a particular diet. Use a significance level of 0.01 to test the claim that the treatment group is from a population with a smaller mean than the control group. Use the traditional method of hypothesis testing.
Unlock Deck
Unlock for access to all 134 flashcards in this deck.
Unlock Deck
k this deck
9
Test the indicated claim about the means of two populations. Assume that the two samples are independent simple random samples selected from normally distributed populations. Do not assume that the population standard deviations
are equal. Use the traditional method or P-value method as indicated.
-A researcher wishes to determine whether people with high blood pressure can reduce their blood pressure, measured in mm Hg, by following a particular diet. Use a significance level of 0.01 to test the claim that the treatment group is from a population with a smaller mean than the control group. Use the traditional method of hypothesis testing.
are equal. Use the traditional method or P-value method as indicated.
-A researcher wishes to determine whether people with high blood pressure can reduce their blood pressure, measured in mm Hg, by following a particular diet. Use a significance level of 0.01 to test the claim that the treatment group is from a population with a smaller mean than the control group. Use the traditional method of hypothesis testing.
Unlock Deck
Unlock for access to all 134 flashcards in this deck.
Unlock Deck
k this deck
10
Suppose that you wish to perform a traditional hypothesis test to test a claim regarding two means. Give an example of a situation in which the matched pairs test would be appropriate and give an example of a situation in which it would be appropriate to perform a test for large and independent samples.
Unlock Deck
Unlock for access to all 134 flashcards in this deck.
Unlock Deck
k this deck
11
Define independent and dependent samples and give an example of each.
Unlock Deck
Unlock for access to all 134 flashcards in this deck.
Unlock Deck
k this deck
12
Perform the indicated hypothesis test. Assume that the two samples are independent simple random samples selected from normally distributed populations. Also assume that the population standard deviations are equal (?1 = ?2), so that the standard error of the difference between means is obtained by pooling the sample variances .
-A researcher wishes to determine whether the blood pressure of vegetarians is, on average, lower than the blood pressure of nonvegetarians. Independent simple random samples of 85 vegetarians and 75 nonvegetarians yielded the following sample statistics for systolic blood pressure:
Use a significance level of 0.01 to test the claim that the mean systolic blood pressure for vegetarians is lower than the mean systolic blood pressure for nonvegetarians. Use the P-value method of hypothesis testing.
Unlock Deck
Unlock for access to all 134 flashcards in this deck.
Unlock Deck
k this deck
13
Use the traditional method to test the given hypothesis. Assume that the samples are independent and that they have been randomly selected
-A researcher finds that of 1000 people who said that they attend a religious service at least once a week, 31 stopped to help a person with car trouble. Of 1200 people interviewed who had not attended a religious service at least once a month, 22 stopped to help a person with car trouble. At the 0.05 significance level, test the claim that the two proportions are equal.
-A researcher finds that of 1000 people who said that they attend a religious service at least once a week, 31 stopped to help a person with car trouble. Of 1200 people interviewed who had not attended a religious service at least once a month, 22 stopped to help a person with car trouble. At the 0.05 significance level, test the claim that the two proportions are equal.
Unlock Deck
Unlock for access to all 134 flashcards in this deck.
Unlock Deck
k this deck
14
When testing for a difference between the means of a treatment group and a placebo group, the computer display below is obtained. Using a 0.04 significance level, is there sufficient evidence to support the claim that the treatment group (variable 1) comes from a population with a mean that is different from the mean for the placebo population?
Explain.
Explain.
Unlock Deck
Unlock for access to all 134 flashcards in this deck.
Unlock Deck
k this deck
15
Bill performs a two-tailed test regarding a population proportion, obtains a P-value of 0.06 and fails to reject the null hypothesis. If the test had been one-tailed (and based on the same sample data), what would the P-value have been? Would he have reached the same conclusion?
Unlock Deck
Unlock for access to all 134 flashcards in this deck.
Unlock Deck
k this deck
16
Complete the table to describe each symbol.
Unlock Deck
Unlock for access to all 134 flashcards in this deck.
Unlock Deck
k this deck
17
A researcher wishes to compare how students at two different schools perform on a math test. He randomly selects 40 students from each school and obtains their test scores. He pairs the first score from school A with the first school from school B, the second score from school A with the second school from school B and so on. He then performs a hypothesis test for matched pairs. Is this approach valid? Why or why not? If it is not valid, how should the researcher have proceeded?
Unlock Deck
Unlock for access to all 134 flashcards in this deck.
Unlock Deck
k this deck
18
Suppose you wish to test a claim about the mean of the differences from dependent samples or to construct a confidence interval estimate of the mean of the differences from dependent samples. What are the requirements?
Unlock Deck
Unlock for access to all 134 flashcards in this deck.
Unlock Deck
k this deck
19
Test the indicated claim about the means of two populations. Assume that the two samples are independent simple random samples selected from normally distributed populations. Do not assume that the population standard deviations
are equal. Use the traditional method or P-value method as indicated.
-A paint manufacturer wishes to compare the drying times of two different types of paint.
Independent random samples of 11 cans of type A and 9 cans of type B were selected and applied to similar surfaces. The drying times (in hours) were recorded. The summary statistics are as follows.
Use a 0.01 significance level to test the claim that the mean drying time for paint type A is equal to the mean drying time for paint type B. Use the P-value method of hypothesis testing.
Unlock Deck
Unlock for access to all 134 flashcards in this deck.
Unlock Deck
k this deck
20
Suppose the proportion of sophomores at a particular college who purchased used textbooks in the past year is ps and the proportion of freshmen at the college who purchased used textbooks in the past year is pf. A study found a 95% confidence interval for Does this interval suggest that a larger proportion of sophomores than of freshmen buy used textbooks? Explain.
Unlock Deck
Unlock for access to all 134 flashcards in this deck.
Unlock Deck
k this deck
20
or the pairs of values have differences that are from a population
that is approximately normally distributed. (The methods are robust against
departures from normality, so for small samples, the normality requirement is loose
in the sense that the procedures perform well as long as there are no outliers and
departures from normality are not too extreme.)
that is approximately normally distributed. (The methods are robust against
departures from normality, so for small samples, the normality requirement is loose
in the sense that the procedures perform well as long as there are no outliers and
departures from normality are not too extreme.)
Unlock Deck
Unlock for access to all 134 flashcards in this deck.
Unlock Deck
k this deck
21
Test the indicated claim about the means of two populations. Assume that the two samples are independent simple random samples selected from normally distributed populations. Do not assume that the population standard deviations
are equal. Use the traditional method or P-value method as indicated.
-A researcher was interested in comparing the salaries of female and male employees at a particular company. Independent simple random samples of 8 female employees and 15 male employees yielded the following weekly salaries (in dollars).
Use a 0.05 significance level to test the claim that the mean salary of female employees is less than the mean salary of male employees. Use the traditional method of hypothesis testing.
Unlock Deck
Unlock for access to all 134 flashcards in this deck.
Unlock Deck
k this deck
22
How does finding the error estimate and confidence intervals for dependent samples compare to the methods for one mean from the Estimates and Sample Sizes chapter?
Unlock Deck
Unlock for access to all 134 flashcards in this deck.
Unlock Deck
k this deck
23
Test the indicated claim about the means of two populations. Assume that the two samples are independent simple random samples selected from normally distributed populations. Do not assume that the population standard deviations
are equal. Use the traditional method or P-value method as indicated.
-A researcher was interested in comparing the amount of time (in hours) spent watching television by women and by men. Independent simple random samples of 14 women and 17 men were selected, and each person was asked how many hours he or she had watched television during the previous week. The summary statistics are as follows.
Use a 0.05 significance level to test the claim that the mean amount of time spent watching television by women is smaller than the mean amount of time spent watching television by men. Use the traditional method of hypothesis testing.
Unlock Deck
Unlock for access to all 134 flashcards in this deck.
Unlock Deck
k this deck
24
Perform the indicated hypothesis test. Assume that the two samples are independent simple random samples selected from normally distributed populations. Also assume that the population standard deviations are equal (?1 = ?2), so that the standard error of the difference between means is obtained by pooling the sample variances .
-A researcher was interested in comparing the GPAs of students at two different colleges.
Independent simple random samples of 8 students from college A and 13 students from college B yielded the following GPAs.
Use a 0.10 significance level to test the claim that the mean GPA of students at college A is equal to the mean GPA of students at college B. Use the traditional method of hypothesis testing.
Unlock Deck
Unlock for access to all 134 flashcards in this deck.
Unlock Deck
k this deck
25
To test the null hypothesis that the difference between two population proportions is equal
to a nonzero constant c, use the test statistic As long as n1 and n2 are both large, the sampling distribution of the test statistic z will be approximately the standard normal distribution. Given the sample data below, test the claim that the proportion of male voters who plan to vote Republican at the next presidential election is 10 percentage points more than the percentage of female voters who plan to vote Republican. Use the traditional method of hypothesis testing and use a significance level of 0.05.
Men:
Women:
Unlock Deck
Unlock for access to all 134 flashcards in this deck.
Unlock Deck
k this deck
26
Perform the indicated hypothesis test. Assume that the two samples are independent simple random samples selected from normally distributed populations. Also assume that the population standard deviations are equal (?1 = ?2), so that the standard error of the difference between means is obtained by pooling the sample variances .
-A researcher was interested in comparing the resting pulse rates of people who exercise regularly and the pulse rates of those who do not exercise regularly. Independent simple random samples of 16 people who do not exercise regularly and 12 people who exercise regularly were selected, and the resting pulse rates (in beats per minute) were recorded.
The summary statistics are as follows.
Use a 0.025 significance level to test the claim that the mean resting pulse rate of people who do not exercise regularly is greater than the mean resting pulse rate of people who exercise regularly. Use the traditional method of hypothesis testing.
Unlock Deck
Unlock for access to all 134 flashcards in this deck.
Unlock Deck
k this deck
27
Test the indicated claim about the means of two populations. Assume that the two samples are independent simple random samples selected from normally distributed populations. Do not assume that the population standard deviations
are equal. Use the traditional method or P-value method as indicated.
-A researcher was interested in comparing the response times of two different cab companies. Companies A and B were each called at 50 randomly selected times. The calls to company A were made independently of the calls to company B. The response times for each call were recorded. The summary statistics were as follows: Use a 0.02 significance level to test the claim that the mean response time for company A is the same as the mean response time for company B. Use the P-value method of hypothesis testing.
Unlock Deck
Unlock for access to all 134 flashcards in this deck.
Unlock Deck
k this deck
28
Use the traditional method of hypothesis testing to test the given claim about the means of two populations. Assume that two dependent samples have been randomly selected from normally distributed populations.
-A coach uses a new technique in training middle distance runners. The times for 8 different athletes to run 800 meters before and after this training are shown below.
Using a 0.05 level of significance, test the claim that the training helps to improve the athletes' times for the 800 meters.
-A coach uses a new technique in training middle distance runners. The times for 8 different athletes to run 800 meters before and after this training are shown below.
Using a 0.05 level of significance, test the claim that the training helps to improve the athletes' times for the 800 meters.
Unlock Deck
Unlock for access to all 134 flashcards in this deck.
Unlock Deck
k this deck
29
To test the null hypothesis that the difference between two population proportions is equal to a nonzero constant c, use the test statistic As long as n1 and n2 are both large, the sampling distribution of the test statistic z will be approximately the standard normal distribution. Given the sample data below, test the claim that the proportion of male voters who plan to vote Republican at the next presidential election is 15 percentage points more than the percentage of female voters who plan to vote Republican. Use the P-value method of hypothesis testing and use a significance level of 0.10.
Men:
Women:
Men:
Women:
Unlock Deck
Unlock for access to all 134 flashcards in this deck.
Unlock Deck
k this deck
30
Use the traditional method to test the given hypothesis. Assume that the samples are independent and that they have been randomly selected
-In a random sample of 500 people aged 20-24, 22% were smokers. In a random sample of 450 people aged 25-29, 14% were smokers. Test the claim that the proportion of smokers in the two age groups is the same. Use a significance level of 0.01.
-In a random sample of 500 people aged 20-24, 22% were smokers. In a random sample of 450 people aged 25-29, 14% were smokers. Test the claim that the proportion of smokers in the two age groups is the same. Use a significance level of 0.01.
Unlock Deck
Unlock for access to all 134 flashcards in this deck.
Unlock Deck
k this deck
31
Perform the indicated hypothesis test. Assume that the two samples are independent simple random samples selected from normally distributed populations. Also assume that the population standard deviations are equal (?1 = ?2), so that the standard error of the difference between means is obtained by pooling the sample variances .
-A researcher was interested in comparing the response times of two different cab companies. Companies A and B were each called at 50 randomly selected times. The calls to company A were made independently of the calls to company B. The response times were recorded and the summary statistics were as follows:
Use a 0.02 significance level to test the claim that the mean response time for company A differs from the mean response time for company B. Use the P-value method of hypothesis testing.
Unlock Deck
Unlock for access to all 134 flashcards in this deck.
Unlock Deck
k this deck
32
Perform the indicated hypothesis test. Assume that the two samples are independent simple random samples selected from normally distributed populations. Also assume that the population standard deviations are equal (?1 = ?2), so that the standard error of the difference between means is obtained by pooling the sample variances .
-A researcher was interested in comparing the amount of time spent watching television by women and by men. Independent simple random samples of 14 women and 17 men were selected, and each person was asked how many hours he or she had watched television during the previous week. The summary statistics are as follows.
Use a 0.05 significance level to test the claim that the mean amount of time spent watching television by women is smaller than the mean amount of time spent watching television by men. Use the traditional method of hypothesis testing.
Unlock Deck
Unlock for access to all 134 flashcards in this deck.
Unlock Deck
k this deck
33
Use the traditional method of hypothesis testing to test the given claim about the means of two populations. Assume that two dependent samples have been randomly selected from normally distributed populations.
-A test of abstract reasoning is given to a random sample of students before and after they completed a formal logic course. The results are given below. At the 0.05 significance level, test the claim that the mean score is not affected by the course.
-A test of abstract reasoning is given to a random sample of students before and after they completed a formal logic course. The results are given below. At the 0.05 significance level, test the claim that the mean score is not affected by the course.
Unlock Deck
Unlock for access to all 134 flashcards in this deck.
Unlock Deck
k this deck
34
Brian wants to obtain a confidence interval estimate of where p1 represents the proportion of American women who smoke and p2 represents the proportion of American men who smoke. He randomly selects 100 married couples. Among the 100 women in the sample are 21 smokers. Among the 100 men are 29 smokers. Are the requirements for obtaining a confidence interval estimate of satisfied? If not, which requirement is not satisfied?
Unlock Deck
Unlock for access to all 134 flashcards in this deck.
Unlock Deck
k this deck
35
A researcher was interested in comparing the heights of women in two different countries.
Independent simple random samples of 9 women from country A and 9 women from country B yielded the following heights (in inches).
Use a 0.10 significance level to test the claim that the mean height of women in country A is greater than the mean height of women in country B. Use the P-value method of hypothesis testing.
Unlock Deck
Unlock for access to all 134 flashcards in this deck.
Unlock Deck
k this deck
36
Describe the process for testing a hypothesis about two means when the samples are dependent. Compare this process to the methods of hypothesis testing for one mean in the Hypothesis Testing chapter.
Unlock Deck
Unlock for access to all 134 flashcards in this deck.
Unlock Deck
k this deck
37
Use the traditional method of hypothesis testing to test the given claim about the means of two populations. Assume that two dependent samples have been randomly selected from normally distributed populations.
-Ten different families are tested for the number of gallons of water a day they use before and after viewing a conservation video. At the 0.05 significance level, test the claim that the mean is the same before and after the viewing.
-Ten different families are tested for the number of gallons of water a day they use before and after viewing a conservation video. At the 0.05 significance level, test the claim that the mean is the same before and after the viewing.
Unlock Deck
Unlock for access to all 134 flashcards in this deck.
Unlock Deck
k this deck
38
Use the traditional method to test the given hypothesis. Assume that the samples are independent and that they have been randomly selected
-
-
Unlock Deck
Unlock for access to all 134 flashcards in this deck.
Unlock Deck
k this deck
39
Test the indicated claim about the means of two populations. Assume that the two samples are independent simple random samples selected from normally distributed populations. Do not assume that the population standard deviations
are equal. Use the traditional method or P-value method as indicated.
-A researcher was interested in comparing the GPAs of students at two different colleges.
Independent random samples of 8 students from college A and 13 students from college B yielded the following GPAs: Use a 0.10 significance level to test the claim that the mean GPA of students at college A is different from the mean GPA of students at college B. Use the P-value method of hypothesis testing.
Unlock Deck
Unlock for access to all 134 flashcards in this deck.
Unlock Deck
k this deck
40
When testing for a difference between the means of a treatment group and a placebo group, the computer display below is obtained. Using a 0.05 significance level, is there sufficient evidence to support the claim that the treatment group (variable 1) comes from a population with a mean that is less than the mean for the placebo population? Explain.
Unlock Deck
Unlock for access to all 134 flashcards in this deck.
Unlock Deck
k this deck
41
Construct the indicated confidence interval for the difference between population proportions p1 - p2. Assume that the samples are independent and that they have been randomly selected.
- and Construct a confidence interval for the difference between population proportions .
A)
B)
C)
D)
- and Construct a confidence interval for the difference between population proportions .
A)
B)
C)
D)
Unlock Deck
Unlock for access to all 134 flashcards in this deck.
Unlock Deck
k this deck
42
When testing for a difference between the means of a treatment group and a placebo group, the computer display below is obtained. Using a 0.05 significance level, is there sufficient evidence to support the claim that the treatment group (variable 1) comes from a population with a mean that is different from the mean for the placebo population?
Explain.
Explain.
Unlock Deck
Unlock for access to all 134 flashcards in this deck.
Unlock Deck
k this deck
43
A researcher wishes to compare the proportion of defectives among computers from manufacturer A with the proportion of defectives among computers from manufacturer B.
She selects independent simple random samples and finds that 1.5% of 200 computers from manufacturer A are defective and 3.5% of 400 computers from manufacturer B are defective. Are the requirements for obtaining a confidence interval estimate of p1- p2 satisfied? Explain your answer.
She selects independent simple random samples and finds that 1.5% of 200 computers from manufacturer A are defective and 3.5% of 400 computers from manufacturer B are defective. Are the requirements for obtaining a confidence interval estimate of p1- p2 satisfied? Explain your answer.
Unlock Deck
Unlock for access to all 134 flashcards in this deck.
Unlock Deck
k this deck
44
Use the traditional method to test the given hypothesis. Assume that the samples are independent and that they have been randomly selected
-Seven of 8500 people vaccinated against a certain disease later developed the disease. 18 of 10,000 people vaccinated with a placebo later developed the disease. Test the claim that the vaccine is effective in lowering the incidence of the disease. Use a significance level of 0.02.
-Seven of 8500 people vaccinated against a certain disease later developed the disease. 18 of 10,000 people vaccinated with a placebo later developed the disease. Test the claim that the vaccine is effective in lowering the incidence of the disease. Use a significance level of 0.02.
Unlock Deck
Unlock for access to all 134 flashcards in this deck.
Unlock Deck
k this deck
45
Test the indicated claim about the means of two populations. Assume that the two samples are independent simple random samples selected from normally distributed populations. Do not assume that the population standard deviations
are equal. Use the traditional method or P-value method as indicated.
-A researcher wishes to determine whether the blood pressure of vegetarians is, on average, lower than the blood pressure of nonvegetarians. Independent simple random samples of 85 vegetarians and 75 nonvegetarians yielded the following sample statistics for systolic blood pressure:
Use a significance level of 0.01 to test the claim that the mean systolic blood pressure of vegetarians is lower than the mean systolic blood pressure of nonvegetarians. Use the P-value method of hypothesis testing.
Unlock Deck
Unlock for access to all 134 flashcards in this deck.
Unlock Deck
k this deck
46
Assume that you plan to use a significance level of ? = 0.05 to test the claim that p1 = p2, Use the given sample sizes and numbers of successes to find the pooled estimate . Round your answer to the nearest thousandth.
-
A) 0.356
B) 0.395
C) 0.277
D) 0.435
-
A) 0.356
B) 0.395
C) 0.277
D) 0.435
Unlock Deck
Unlock for access to all 134 flashcards in this deck.
Unlock Deck
k this deck
47
Use the traditional method to test the given hypothesis. Assume that the samples are independent and that they have been randomly selected
-In a random sample of 360 women, 65% favored stricter gun control laws. In a random sample of 220 men, 60% favored stricter gun control laws. Test the claim that the proportion of women favoring stricter gun control is higher than the proportion of men favoring stricter gun control. Use a significance level of 0.05.
-In a random sample of 360 women, 65% favored stricter gun control laws. In a random sample of 220 men, 60% favored stricter gun control laws. Test the claim that the proportion of women favoring stricter gun control is higher than the proportion of men favoring stricter gun control. Use a significance level of 0.05.
Unlock Deck
Unlock for access to all 134 flashcards in this deck.
Unlock Deck
k this deck
48
Test the indicated claim about the means of two populations. Assume that the two samples are independent simple random samples selected from normally distributed populations. Do not assume that the population standard deviations
are equal. Use the traditional method or P-value method as indicated.
-A researcher was interested in comparing the resting pulse rates of people who exercise regularly and of those who do not exercise regularly. Independent simple random samples of 16 people who do not exercise regularly and 12 people who exercise regularly were selected, and the resting pulse rates (in beats per minute) were recorded. The summary statistics are as follows.
Use a 0.025 significance level to test the claim that the mean resting pulse rate of people who do not exercise regularly is larger than the mean resting pulse rate of people who exercise regularly. Use the traditional method of hypothesis testing.
Unlock Deck
Unlock for access to all 134 flashcards in this deck.
Unlock Deck
k this deck
49
When making decisions about a population mean, either a hypothesis test or a confidence interval can be used. Compare these techniques.
Unlock Deck
Unlock for access to all 134 flashcards in this deck.
Unlock Deck
k this deck
50
Use the traditional method to test the given hypothesis. Assume that the samples are independent and that they have been randomly selected
-A marketing survey involves product recognition in New York and California. Of 558 New Yorkers surveyed, 193 knew the product while 196 out of 614 Californians knew the product. At the 0.05 significance level, test the claim that the recognition rates are the same in both states.
-A marketing survey involves product recognition in New York and California. Of 558 New Yorkers surveyed, 193 knew the product while 196 out of 614 Californians knew the product. At the 0.05 significance level, test the claim that the recognition rates are the same in both states.
Unlock Deck
Unlock for access to all 134 flashcards in this deck.
Unlock Deck
k this deck
51
Construct the indicated confidence interval for the difference between the two population means. Assume that the two samples are independent simple random samples selected from normally distributed populations. Do not assume that the population standard deviations are equal.
-A researcher was interested in comparing the amount of time spent watching television by women and by men. Independent simple random samples of 14 women and 17 men were selected, and each person was asked how many hours he or she had watched television during the previous
Week. The summary statistics are as follows.
Construct a 99% confidence interval for µ1 - µ2, the difference between the mean amount of time spent watching television for women and the mean amount of time spent watching television for men)
A)
B)
C)
D)
Unlock Deck
Unlock for access to all 134 flashcards in this deck.
Unlock Deck
k this deck
52
Assume that you want to test the claim that the paired sample data come from a population for which the mean difference is µd = 0. Compute the value of the t test statistic. Round intermediate calculations to four decimal places as needed and final answers to three decimal places as needed.
-
A)
B)
C)
D)
-
A)
B)
C)
D)
Unlock Deck
Unlock for access to all 134 flashcards in this deck.
Unlock Deck
k this deck
53
Determine the decision criterion for rejecting the null hypothesis in the given hypothesis test; i.e., describe the values of the test statistic that would result in rejection of the null hypothesis.
-A farmer has decided to use a new additive to grow his crops. He divided his farm into 10 plots and kept records of the corn yield (in bushels) before and after using the additive. The results are shown below.
You wish to test the following hypothesis at the 10 percent level of significance.
against
What decision rule would you use?
A) Reject if test statistic is less than or greater than .
B) Reject if test statistic is less than .
C) Reject if test statistic is greater than or less than .
D) Reject if test statistic is greater than .
Unlock Deck
Unlock for access to all 134 flashcards in this deck.
Unlock Deck
k this deck
54
Tom plans to find a confidence interval estimate of , the proportion of women who smoke, and a 95\% confidence interval estimate of , the proportion of men who smoke. He will reject the null hypothesis if there is no overlap between the two confidence intervals. Tim plans to find a confidence interval estimate of , and will reject the null hypothesis if the confidence interval does not include 0 . Will Tom and Tim definitely reach the same conclusion? If not, who is more likely to conclude that there is a significant difference between the two population proportions?
Unlock Deck
Unlock for access to all 134 flashcards in this deck.
Unlock Deck
k this deck
55
When testing for a difference between the means of a treatment group and a placebo group, the computer display below is obtained. Using a 0.01 significance level, is there sufficient evidence to support the claim that the treatment group (variable 1) comes from a population with a mean that is greater than the mean for the placebo population? Explain.
Unlock Deck
Unlock for access to all 134 flashcards in this deck.
Unlock Deck
k this deck
56
Construct the indicated confidence interval for the difference between the two population means. Assume that the two samples are independent simple random samples selected from normally distributed populations. Do not assume that the population standard deviations are equal.
-A paint manufacturer wished to compare the drying times of two different types of paint. Independent simple random samples of 11 cans of type and 9 cans of type B were selected and applied to similar surfaces. The drying times, in hours, were recorded. The summary statistics are as follows.
Construct a confidence interval for , the difference between the mean drying time for paint of type and the mean drying time for paint of type .
A) hrs hrs
B)
C) hrs
D)
Unlock Deck
Unlock for access to all 134 flashcards in this deck.
Unlock Deck
k this deck
57
A hypothesis test is to be performed to test the equality of two population means. The sample sizes are large and the samples are independent. A 95% confidence interval for the difference between the population means is (1.4, 8.7). If the hypothesis test is based on the same samples, which of the following do you know for sure:
A: The hypothesis would be rejected at the level of significance.
B: The hypothesis would be rejected at the level of significance.
: The hypothesis would be rejected at the level of significance.
A) A and C
B) A only
C) A, B, and C
D) A and B
A: The hypothesis would be rejected at the level of significance.
B: The hypothesis would be rejected at the level of significance.
: The hypothesis would be rejected at the level of significance.
A) A and C
B) A only
C) A, B, and C
D) A and B
Unlock Deck
Unlock for access to all 134 flashcards in this deck.
Unlock Deck
k this deck
58
Unlock Deck
Unlock for access to all 134 flashcards in this deck.
Unlock Deck
k this deck
59
Use the traditional method of hypothesis testing to test the given claim about the means of two populations. Assume that two dependent samples have been randomly selected from normally distributed populations.
-Five students took a math test before and after tutoring. Their scores were as follows. Using a 0.01 level of significance, test the claim that the tutoring has an effect on the math scores.
-Five students took a math test before and after tutoring. Their scores were as follows. Using a 0.01 level of significance, test the claim that the tutoring has an effect on the math scores.
Unlock Deck
Unlock for access to all 134 flashcards in this deck.
Unlock Deck
k this deck
60
Find the number of successes x suggested by the given statement.
Among 790 people selected randomly from among the residents of one city, 24.68% were found to be living below the official poverty line.
A) 195
B) 191
C) 199
D) 197
Among 790 people selected randomly from among the residents of one city, 24.68% were found to be living below the official poverty line.
A) 195
B) 191
C) 199
D) 197
Unlock Deck
Unlock for access to all 134 flashcards in this deck.
Unlock Deck
k this deck
61
Assume that you plan to use a significance level of ? = 0.05 to test the claim that p1 = p2, Use the given sample sizes and numbers of successes to find the P-value for the hypothesis test.
-
A) 0.0146
B) 0.1201
C) 0.0032
D) 0.0001
-
A) 0.0146
B) 0.1201
C) 0.0032
D) 0.0001
Unlock Deck
Unlock for access to all 134 flashcards in this deck.
Unlock Deck
k this deck
62
The table shows the number of pitchers with E.R.A's below in a random sample of sixty pitchers from the National League and in a random sample of fifty-two pitchers from the American League. Assume that you plan to use a significance level of to test the claim that . Find the critical value(s) for this hypothesis test. Do the data support the claim that the proportion of National League pitchers with an E.R.A. below differs from the proportion of American League pitchers with an E.R.A. below 3.5?
A) ; no
B) ; yes
C) ; no
D) ; yes
A) ; no
B) ; yes
C) ; no
D) ; yes
Unlock Deck
Unlock for access to all 134 flashcards in this deck.
Unlock Deck
k this deck
63
Find sd
-The differences between two sets of dependent data are 21, 21, 15, 18, 15. Round to the nearest tenth.
A) 3.0
B) 6.0
C) 2.4
D) 3.9
-The differences between two sets of dependent data are 21, 21, 15, 18, 15. Round to the nearest tenth.
A) 3.0
B) 6.0
C) 2.4
D) 3.9
Unlock Deck
Unlock for access to all 134 flashcards in this deck.
Unlock Deck
k this deck
64
Determine the decision criterion for rejecting the null hypothesis in the given hypothesis test; i.e., describe the values of the test statistic that would result in rejection of the null hypothesis.
-Suppose you wish to test the claim that , the mean value of the differences for a population of paired data, is greater than 0 . Given a sample of and a significance level of , what criterion would be used for rejecting the null hypothesis?
A) Reject null hypothesis if test statistic .
B) Reject null hypothesis if test statistic .
C) Reject null hypothesis if test statistic .
D) Reject null hypothesis if test statistic or .
Unlock Deck
Unlock for access to all 134 flashcards in this deck.
Unlock Deck
k this deck
65
Determine whether the samples are independent or dependent.
-The accuracy of verbal responses is tested in an experiment in which individuals report their heights and then are measured. The data consist of the reported height and measured height for each individual.
A) Independent samples
B) Dependent samples
-The accuracy of verbal responses is tested in an experiment in which individuals report their heights and then are measured. The data consist of the reported height and measured height for each individual.
A) Independent samples
B) Dependent samples
Unlock Deck
Unlock for access to all 134 flashcards in this deck.
Unlock Deck
k this deck
66
Construct the indicated confidence interval for the difference between the two population means. Assume that the two samples are independent simple random samples selected from normally distributed populations. Also assume that the population standard deviations are equal , so that the standard error of the difference between means is obtained by pooling the sample variances .
-A researcher was interested in comparing the resting pulse rates of people who exercise regularly and people who do not exercise regularly. Independent simple random samples were obtained of 16 people who do not exercise regularly and 12 people who do exercise regularly. The resting pulse
Rate (in beats per minute) of each person was recorded. The summary statistics are as follows.
Construct a confidence interval for the difference between the mean pulse rate of people who do not exercise regularly and the mean pulse rate of people who exercise regularly.
A) beats beats
B) beats beats
C) beats beats
D) beats beats
Unlock Deck
Unlock for access to all 134 flashcards in this deck.
Unlock Deck
k this deck
67
The sample size needed to estimate the difference between two population proportions to within a margin of error with a confidence level of can be found as follows: in the expression
replace and by (assuming both samples have the same size) and replace each of , and by (because their values are not known). Then solve for .
Use this approach to find the size of each sample if you want to estimate the difference between the proportions of men and women who plan to vote in the next presidential election. Assume that you want confidence that your error is no more than .
A) 1087
B) 769
C) 516
D) 1327
Unlock Deck
Unlock for access to all 134 flashcards in this deck.
Unlock Deck
k this deck
68
Assume that you plan to use a significance level of ? = 0.05 to test the claim that p1 = p2. Use the given sample sizes and numbers of successes to find the z test statistic for the hypothesis test.
-In a vote on the Clean Water bill, 48% of the 205 Democrats voted for the bill while 42% of the 230 Republicans voted for it.
A)
B)
C)
D)
-In a vote on the Clean Water bill, 48% of the 205 Democrats voted for the bill while 42% of the 230 Republicans voted for it.
A)
B)
C)
D)
Unlock Deck
Unlock for access to all 134 flashcards in this deck.
Unlock Deck
k this deck
69
Construct a confidence interval for µd, the mean of the differences d for the population of paired data. Assume that the population of paired differences is normally distributed.
-A test of abstract reasoning is given to a random sample of students before and after they completed a formal logic course. The results are given below. Construct a 95% confidence interval for the mean difference between the before and after scores.
A)
B)
C)
D)
-A test of abstract reasoning is given to a random sample of students before and after they completed a formal logic course. The results are given below. Construct a 95% confidence interval for the mean difference between the before and after scores.
A)
B)
C)
D)
Unlock Deck
Unlock for access to all 134 flashcards in this deck.
Unlock Deck
k this deck
70
Construct the indicated confidence interval for the difference between population proportions p1 - p2. Assume that the samples are independent and that they have been randomly selected.
-In a random sample of 500 people aged were smokers. In a random sample of 450 people aged 25-29, 14\% were smokers. Construct a confidence interval for the difference between the population proportions .
A)
B)
C)
D)
-In a random sample of 500 people aged were smokers. In a random sample of 450 people aged 25-29, 14\% were smokers. Construct a confidence interval for the difference between the population proportions .
A)
B)
C)
D)
Unlock Deck
Unlock for access to all 134 flashcards in this deck.
Unlock Deck
k this deck
71
Construct a confidence interval for µd, the mean of the differences d for the population of paired data. Assume that the population of paired differences is normally distributed.
-If , and , determine a 90 percent confidence interval for .
A)
B)
C)
D)
-If , and , determine a 90 percent confidence interval for .
A)
B)
C)
D)
Unlock Deck
Unlock for access to all 134 flashcards in this deck.
Unlock Deck
k this deck
72
Construct the indicated confidence interval for the difference between the two population means. Assume that the two samples are independent simple random samples selected from normally distributed populations. Do not assume that thepopulation standard deviations are equal.
-A researcher was interested in comparing the heights of women in two different countries. Independent simple random samples of 9 women from country A and 9 women from country B yielded the following heights (in inches).
Construct a confidence interval for , the difference between the mean height of women in country and the mean height of women in country B.
(Note: in., in., in., in.)
A) in. in.
B) in. in.
C) in. in.
D) .
Unlock Deck
Unlock for access to all 134 flashcards in this deck.
Unlock Deck
k this deck
73
The effect of caffeine as an ingredient is tested with a sample of regular soda and another sample with decaffeinated soda.
A) Dependent samples
B) Independent samples
A) Dependent samples
B) Independent samples
Unlock Deck
Unlock for access to all 134 flashcards in this deck.
Unlock Deck
k this deck
74
The two data sets are dependent. Find to the nearest tenth.
-
A)
B)
C)
D)
-
A)
B)
C)
D)
Unlock Deck
Unlock for access to all 134 flashcards in this deck.
Unlock Deck
k this deck
75
State what the given confidence interval suggests about the two population means.
-A researcher was interested in comparing the amount of time spent watching television by women and by men. Independent simple random samples of 14 women and 17 men were selected, and each person was asked how many hours he or she had watched television during the previous week. The summary statistics are as follows.
The following confidence interval was obtained for , the difference between the mean amount of time spent watching television for women and the mean amount of time spent watching television for men: .
A) The confidence interval limits include 0 which suggests that the two population means might be equal. There does not appear to be a significant difference between the mean amount of time spent watching television for women and the mean amount of time spent watching television for men.
B) The confidence interval includes only positive values which suggests that the mean amount of time spent watching television for women is larger than the mean amount of time spent watching television for men.
C) The confidence interval includes only negative values which suggests that the mean amount of time spent watching television for women is smaller than the mean amount of time spent watching television for men.
D) The confidence interval limits include 0 which suggests that the two population means are unlikely to be equal. There appears to be a significant difference between the mean amount of time spent watching television for women and the mean amount of time spent watching television for men.
Unlock Deck
Unlock for access to all 134 flashcards in this deck.
Unlock Deck
k this deck
76
Assume that you want to test the claim that the paired sample data come from a population for which the mean difference is 0. Compute the value of the t test statistic. Round intermediate calculations to four decimal places as needed and final answers to three decimal places as needed.
-A farmer has decided to use a new additive to grow his crops. He divided his farm into 10 plots and kept records of the corn yield (in bushels) before and after using the additive. The results are shown below.
You wish to test the following hypothesis at the 10 percent level of significance.
What is the value of the appropriate test statistic?
A) 5.014
B) 1.584
C) 2.033
D) 2.536
Unlock Deck
Unlock for access to all 134 flashcards in this deck.
Unlock Deck
k this deck
77
Construct a confidence interval for µd, the mean of the differences d for the population of paired data. Assume that the population of paired differences is normally distributed.
-Ten different families are tested for the number of gallons of water a day they use before and after viewing a conservation video. Construct a 90% confidence interval for the mean of the differences.
A)
B)
C)
D)
-Ten different families are tested for the number of gallons of water a day they use before and after viewing a conservation video. Construct a 90% confidence interval for the mean of the differences.
A)
B)
C)
D)
Unlock Deck
Unlock for access to all 134 flashcards in this deck.
Unlock Deck
k this deck
78
Construct a confidence interval for µd, the mean of the differences d for the population of paired data. Assume that the population of paired differences is normally distributed.
-A test of writing ability is given to a random sample of students before and after they completed a formal writing course. The results are given below. Construct a 99% confidence interval for the mean difference between the before and after scores.
A)
B)
C)
D)
-A test of writing ability is given to a random sample of students before and after they completed a formal writing course. The results are given below. Construct a 99% confidence interval for the mean difference between the before and after scores.
A)
B)
C)
D)
Unlock Deck
Unlock for access to all 134 flashcards in this deck.
Unlock Deck
k this deck
79
Construct the indicated confidence interval for the difference between the two population means. Assume that the two samples are independent simple random samples selected from normally distributed populations. Do not assume that the population standard deviations are equal.
-A researcher was interested in comparing the salaries of female and male employees at a particular company. Independent simple random samples of 8 female employees and 15 male employees yielded the following weekly salaries (in dollars).
Construct a confidence interval for , the difference between the mean weekly salary of female employees and the mean weekly salary of male employees at the company.
(Note: .
A)
B)
C)
D)
Unlock Deck
Unlock for access to all 134 flashcards in this deck.
Unlock Deck
k this deck
Unlock Deck
Unlock for access to all 134 flashcards in this deck.


