Deck 7: Estimates and Sample Sizes
Full screen (f)
Question
Question
Question
Question
Question
Question
Provide an appropriate response.

Question
Question
Question
Provide an appropriate response.

Question
Provide an appropriate response.
Question
Question
Provide an appropriate response.
Interpret the following 95% confidence interval for mean weekly salaries of shift managers at Guiseppe's Pizza and Pasta.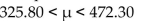
Interpret the following 95% confidence interval for mean weekly salaries of shift managers at Guiseppe's Pizza and Pasta.
Question
Question
Question
Question
Question
Provide an appropriate response.
Define a point estimate. What is the best point estimate for
Define a point estimate. What is the best point estimate for
Question
Provide an appropriate response.

Question
Question
Provide an appropriate response.
Identify the correct distribution (z, t, or neither)for each of the following.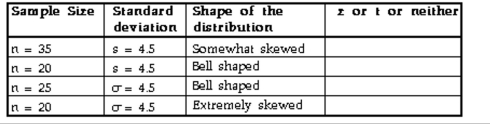
Identify the correct distribution (z, t, or neither)for each of the following.
Question
Question
Question
Question
Question
Question
Question
Question
Question
Question
Question
Question
Question
Question
Question
Question
Question
Question
Question
Question
Question
Question
Question
Question
Question
Question
Question
Question
Question
Question
Question
Question
Question
Question
Question
Question
Question
Question
Question
Question
Question
Question
Question
Question
Question
Question
Question
Question
Question
Question
Question
Question
Question
Question
Question
Question
Question
Question
Question
Question

Unlock Deck
Sign up to unlock the cards in this deck!
Unlock Deck
Unlock Deck
1/139
Play
Full screen (f)
Deck 7: Estimates and Sample Sizes
1
Provide an appropriate response.
Draw a diagram of the chi-square distribution. Discuss its shape and values.
Draw a diagram of the chi-square distribution. Discuss its shape and values.
The chi-square distribution is non-symmetric and skewed to the right. The values are 0 and positive.
2
Provide an appropriate response.
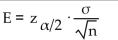
-When determining the sample size for a desired margin of error, the formula is . Based on this formula, discuss the fact that sample size is not dependent on the population size; that is, it is not necessary to sample a particular percent of the population.
-When determining the sample size for a desired margin of error, the formula is . Based on this formula, discuss the fact that sample size is not dependent on the population size; that is, it is not necessary to sample a particular percent of the population.
As shown in the formula, the appropriate sample size is dependent on the appropriate z score, the sample proportion, and the margin of error, not on N, the population size.
3
Provide an appropriate response.
-When determining sample size we need to know If we have no prior information, what are two methods that can be used?
-When determining sample size we need to know If we have no prior information, what are two methods that can be used?
4
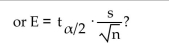
Complete the table to compare z and t distributions.
Unlock Deck
Unlock for access to all 139 flashcards in this deck.
Unlock Deck
k this deck
5
Provide an appropriate response.
Define confidence interval and degree of confidence. Make up an example of a confidence interval and interpret the result.
Define confidence interval and degree of confidence. Make up an example of a confidence interval and interpret the result.
Unlock Deck
Unlock for access to all 139 flashcards in this deck.
Unlock Deck
k this deck
6
Provide an appropriate response.
Unlock Deck
Unlock for access to all 139 flashcards in this deck.
Unlock Deck
k this deck
7
Provide an appropriate response.
Explain how confidence intervals might be used to make decisions. Give an example to clarify your explanation.
Explain how confidence intervals might be used to make decisions. Give an example to clarify your explanation.
Unlock Deck
Unlock for access to all 139 flashcards in this deck.
Unlock Deck
k this deck
8
Why would manufacturers and businesses be interested in constructing a confidence interval for the population variance? Would manufacturers and businesses want large or small variances?
Unlock Deck
Unlock for access to all 139 flashcards in this deck.
Unlock Deck
k this deck
9
Provide an appropriate response.
Unlock Deck
Unlock for access to all 139 flashcards in this deck.
Unlock Deck
k this deck
10
Provide an appropriate response.
Unlock Deck
Unlock for access to all 139 flashcards in this deck.
Unlock Deck
k this deck
11
Provide an appropriate response.
Describe the steps for finding a confidence interval.
Describe the steps for finding a confidence interval.
Unlock Deck
Unlock for access to all 139 flashcards in this deck.
Unlock Deck
k this deck
12
Provide an appropriate response.
Interpret the following 95% confidence interval for mean weekly salaries of shift managers at Guiseppe's Pizza and Pasta.
Interpret the following 95% confidence interval for mean weekly salaries of shift managers at Guiseppe's Pizza and Pasta.
Unlock Deck
Unlock for access to all 139 flashcards in this deck.
Unlock Deck
k this deck
13
Provide an appropriate response.
Describe the process for finding the confidence interval for a population proportion.
Describe the process for finding the confidence interval for a population proportion.
Unlock Deck
Unlock for access to all 139 flashcards in this deck.
Unlock Deck
k this deck
14
Provide an appropriate response.
What is the best point estimate for the population proportion? Explain why that point estimate is best.
What is the best point estimate for the population proportion? Explain why that point estimate is best.
Unlock Deck
Unlock for access to all 139 flashcards in this deck.
Unlock Deck
k this deck
15
The Bide-a-While efficiency hotel, which caters to business workers who stay for extended periods of time (weeks or months), offers room service. In a small study of 35 randomly selected room service orders, the 95% confidence interval for mean delivery time for room service is 24.8 < µ < 29.6 minutes. The marketing director is trying to determine if she can advertise "room service in under 30 minutes, or the order is free." How would you advise her?
Unlock Deck
Unlock for access to all 139 flashcards in this deck.
Unlock Deck
k this deck
16
Provide an appropriate response.
What assumption about the parent population is needed to use the t distribution to compute the margin of error?
What assumption about the parent population is needed to use the t distribution to compute the margin of error?
Unlock Deck
Unlock for access to all 139 flashcards in this deck.
Unlock Deck
k this deck
17
Provide an appropriate response.
Define a point estimate. What is the best point estimate for
Define a point estimate. What is the best point estimate for
Unlock Deck
Unlock for access to all 139 flashcards in this deck.
Unlock Deck
k this deck
18
Provide an appropriate response.
Unlock Deck
Unlock for access to all 139 flashcards in this deck.
Unlock Deck
k this deck
19
Provide an appropriate response.
Explain the difference between descriptive and inferential statistics.
Explain the difference between descriptive and inferential statistics.
Unlock Deck
Unlock for access to all 139 flashcards in this deck.
Unlock Deck
k this deck
20
Provide an appropriate response.
Identify the correct distribution (z, t, or neither)for each of the following.
Identify the correct distribution (z, t, or neither)for each of the following.
Unlock Deck
Unlock for access to all 139 flashcards in this deck.
Unlock Deck
k this deck
21
Find the minimum sample size you should use to assure that your estimate of p will be within the required margin of error around the population p
-Margin of error: ; confidence level: and unknown
A) 40
B) 1
C) 6328
D) 6327
-Margin of error: ; confidence level: and unknown
A) 40
B) 1
C) 6328
D) 6327
Unlock Deck
Unlock for access to all 139 flashcards in this deck.
Unlock Deck
k this deck
22
Use the given degree of confidence and sample data to construct a confidence interval for the population proportion p
-n = 133, x = 82; 90 percent
A)0.548 < p < 0.686
B)0.546 < p < 0.688
C)0.551 < p < 0.683
D)0.550 < p < 0.684
-n = 133, x = 82; 90 percent
A)0.548 < p < 0.686
B)0.546 < p < 0.688
C)0.551 < p < 0.683
D)0.550 < p < 0.684
Unlock Deck
Unlock for access to all 139 flashcards in this deck.
Unlock Deck
k this deck
23
Use the given degree of confidence and sample data to construct a confidence interval for the population proportion p
-n = 102, x = 52; 88 percent
A)0.432 < p < 0.588
B)0.428 < p < 0.592
C)0.433 < p < 0.587
D)0.429 < p < 0.591
-n = 102, x = 52; 88 percent
A)0.432 < p < 0.588
B)0.428 < p < 0.592
C)0.433 < p < 0.587
D)0.429 < p < 0.591
Unlock Deck
Unlock for access to all 139 flashcards in this deck.
Unlock Deck
k this deck
24
A)2.05
B)1.75
C)2.33
D)2.575
Unlock Deck
Unlock for access to all 139 flashcards in this deck.
Unlock Deck
k this deck
25
The following confidence interval is obtained for a population proportion, p: 0.855 < p < 0.897 Use these confidence interval limits to find the margin of error, E.
A)0.021
B)0.876
C)0.022
D)0.042
A)0.021
B)0.876
C)0.022
D)0.042
Unlock Deck
Unlock for access to all 139 flashcards in this deck.
Unlock Deck
k this deck
26
Find the margin of error for the 95% confidence interval used to estimate the population proportion
-In a clinical test with 2353 subjects, 1136 showed improvement from the treatment.
A)0.0273
B)0.0172
C)0.0226
D)0.0202
-In a clinical test with 2353 subjects, 1136 showed improvement from the treatment.
A)0.0273
B)0.0172
C)0.0226
D)0.0202
Unlock Deck
Unlock for access to all 139 flashcards in this deck.
Unlock Deck
k this deck
27
The following confidence interval is obtained for a population proportion, p: (0.348, 0.382) Use these confidence interval limits to find the margin of error, E.
A)0.017
B)0.034
C)0.015
D)0.018
A)0.017
B)0.034
C)0.015
D)0.018
Unlock Deck
Unlock for access to all 139 flashcards in this deck.
Unlock Deck
k this deck
28
The following confidence interval is obtained for a population proportion, p: (0.298, 0.338) Use these confidence interval limits to find the point estimate, .
A)
B)
C)
D)
A)
B)
C)
D)
Unlock Deck
Unlock for access to all 139 flashcards in this deck.
Unlock Deck
k this deck
29
Express the confidence interval in the form of ± E.
-0.02 < p < 0.48
A)
B)
C)
D)
-0.02 < p < 0.48
A)
B)
C)
D)
Unlock Deck
Unlock for access to all 139 flashcards in this deck.
Unlock Deck
k this deck
30
Find the minimum sample size you should use to assure that your estimate of p will be within the required margin of error around the population p
-Margin of error: ; confidence level: and unknown
A) 410
B) 204,757
C) 409
D) 204,756
-Margin of error: ; confidence level: and unknown
A) 410
B) 204,757
C) 409
D) 204,756
Unlock Deck
Unlock for access to all 139 flashcards in this deck.
Unlock Deck
k this deck
31
A)-2.1
B)2.37
C)0.0089
D)-2.37
Unlock Deck
Unlock for access to all 139 flashcards in this deck.
Unlock Deck
k this deck
32
Use the given degree of confidence and sample data to construct a confidence interval for the population proportion p
-n = 182, x = 135; 95 percent
A)0.690 < p < 0.793
B)0.691 < p < 0.792
C)0.677 < p < 0.806
D)0.678 < p < 0.805
-n = 182, x = 135; 95 percent
A)0.690 < p < 0.793
B)0.691 < p < 0.792
C)0.677 < p < 0.806
D)0.678 < p < 0.805
Unlock Deck
Unlock for access to all 139 flashcards in this deck.
Unlock Deck
k this deck
33
The following confidence interval is obtained for a population proportion, p: 0.802 < p < 0.828 Use these confidence interval limits to find the point estimate, .
A)
B)
C)
D)
A)
B)
C)
D)
Unlock Deck
Unlock for access to all 139 flashcards in this deck.
Unlock Deck
k this deck
34
Find the margin of error for the 95% confidence interval used to estimate the population proportion
-n = 169, x = 107
A)0.127
B)0.0654
C)0.00269
D)0.0727
-n = 169, x = 107
A)0.127
B)0.0654
C)0.00269
D)0.0727
Unlock Deck
Unlock for access to all 139 flashcards in this deck.
Unlock Deck
k this deck
35
Find the margin of error for the 95% confidence interval used to estimate the population proportion
-n = 230, x = 90
A)0.0663
B)0.0631
C)0.0757
D)0.0568
-n = 230, x = 90
A)0.0663
B)0.0631
C)0.0757
D)0.0568
Unlock Deck
Unlock for access to all 139 flashcards in this deck.
Unlock Deck
k this deck
36
Find the margin of error for the 95% confidence interval used to estimate the population proportion
-In a survey of 4100 T.V. viewers, 20% said they watch network news programs.
A)0.0122
B)0.00915
C)0.0140
D)0.0160
-In a survey of 4100 T.V. viewers, 20% said they watch network news programs.
A)0.0122
B)0.00915
C)0.0140
D)0.0160
Unlock Deck
Unlock for access to all 139 flashcards in this deck.
Unlock Deck
k this deck
37
Express the confidence interval in the form of ± E.
-
A)
B)
C)
D)
-
A)
B)
C)
D)
Unlock Deck
Unlock for access to all 139 flashcards in this deck.
Unlock Deck
k this deck
38
Use the given degree of confidence and sample data to construct a confidence interval for the population proportion p
-n = 84, x = 37; 98 percent
A)0.313 < p < 0.567
B)0.333 < p < 0.547
C)0.334 < p < 0.546
D)0.314 < p < 0.566
-n = 84, x = 37; 98 percent
A)0.313 < p < 0.567
B)0.333 < p < 0.547
C)0.334 < p < 0.546
D)0.314 < p < 0.566
Unlock Deck
Unlock for access to all 139 flashcards in this deck.
Unlock Deck
k this deck
39
A)1.75
B)1.34
C)1.645
D)1.70
Unlock Deck
Unlock for access to all 139 flashcards in this deck.
Unlock Deck
k this deck
40
Use the given degree of confidence and sample data to construct a confidence interval for the population proportion p
-n = 58, x = 28; 95 percent
A)0.353 < p < 0.613
B)0.375 < p < 0.591
C)0.354 < p < 0.612
D)0.374 < p < 0.592
-n = 58, x = 28; 95 percent
A)0.353 < p < 0.613
B)0.375 < p < 0.591
C)0.354 < p < 0.612
D)0.374 < p < 0.592
Unlock Deck
Unlock for access to all 139 flashcards in this deck.
Unlock Deck
k this deck
41
Use the given degree of confidence and sample data to construct a confidence interval for the population proportion p.
-Of 346 items tested, 12 are found to be defective. Construct the 98% confidence interval for the proportion of all such items that are defective.
A)0.0154 < p < 0.0540
B)0.0118 < p < 0.0576
C)0.0345 < p < 0.0349
D)0.0110 < p < 0.0584
-Of 346 items tested, 12 are found to be defective. Construct the 98% confidence interval for the proportion of all such items that are defective.
A)0.0154 < p < 0.0540
B)0.0118 < p < 0.0576
C)0.0345 < p < 0.0349
D)0.0110 < p < 0.0584
Unlock Deck
Unlock for access to all 139 flashcards in this deck.
Unlock Deck
k this deck
42
Find the minimum sample size you should use to assure that your estimate of p will be within the required margin of error around the population p
-Margin of error: ; confidence level: and unknown
A) 197
B) 10
C) 384
D) 385
-Margin of error: ; confidence level: and unknown
A) 197
B) 10
C) 384
D) 385
Unlock Deck
Unlock for access to all 139 flashcards in this deck.
Unlock Deck
k this deck
43
Find the minimum sample size you should use to assure that your estimate of p will be within the required margin of error around the population p
-Margin of error: ; confidence level: and are unknown
A) 519
B) 24
C) 12
D) 518
-Margin of error: ; confidence level: and are unknown
A) 519
B) 24
C) 12
D) 518
Unlock Deck
Unlock for access to all 139 flashcards in this deck.
Unlock Deck
k this deck
44
Use the given degree of confidence and sample data to construct a confidence interval for the population proportion p.
-A survey of 865 voters in one state reveals that 408 favor approval of an issue before the legislature. Construct the 95% confidence interval for the true proportion of all voters in the state who favor approval.
A)0.438 < p < 0.505
B)0.435 < p < 0.508
C)0.444 < p < 0.500
D)0.471 < p < 0.472
-A survey of 865 voters in one state reveals that 408 favor approval of an issue before the legislature. Construct the 95% confidence interval for the true proportion of all voters in the state who favor approval.
A)0.438 < p < 0.505
B)0.435 < p < 0.508
C)0.444 < p < 0.500
D)0.471 < p < 0.472
Unlock Deck
Unlock for access to all 139 flashcards in this deck.
Unlock Deck
k this deck
45
Use the given degree of confidence and sample data to construct a confidence interval for the population proportion p.
-When 306 college students are randomly selected and surveyed, it is found that 115 own a car. Find a 99% confidence interval for the true proportion of all college students who own a car.
A)0.305 < p < 0.447
B)0.311 < p < 0.440
C)0.330 < p < 0.421
D)0.322 < p < 0.430
-When 306 college students are randomly selected and surveyed, it is found that 115 own a car. Find a 99% confidence interval for the true proportion of all college students who own a car.
A)0.305 < p < 0.447
B)0.311 < p < 0.440
C)0.330 < p < 0.421
D)0.322 < p < 0.430
Unlock Deck
Unlock for access to all 139 flashcards in this deck.
Unlock Deck
k this deck
46
Find the minimum sample size you should use to assure that your estimate of p will be within the required margin of error around the population p
-Margin of error: 0.04; confidence level: 99%; from a prior study, ^p is estimated by 0.08
A)306
B)12
C)177
D)367
-Margin of error: 0.04; confidence level: 99%; from a prior study, ^p is estimated by 0.08
A)306
B)12
C)177
D)367
Unlock Deck
Unlock for access to all 139 flashcards in this deck.
Unlock Deck
k this deck
47
Find the minimum sample size you should use to assure that your estimate of p will be within the required margin of error around the population p
-Margin of error: ; confidence level: ; from a prior study, is estimated by the decimal equivalent of
A)8218
B)14,184
C)26,507
D)7396
-Margin of error: ; confidence level: ; from a prior study, is estimated by the decimal equivalent of
A)8218
B)14,184
C)26,507
D)7396
Unlock Deck
Unlock for access to all 139 flashcards in this deck.
Unlock Deck
k this deck
48
Use the given degree of confidence and sample data to construct a confidence interval for the population proportion p.
-Of 86 adults selected randomly from one town, 63 have health insurance. Find a 90% confidence interval for the true proportion of all adults in the town who have health insurance.
A)0.621 < p < 0.844
B)0.654 < p < 0.811
C)0.639 < p < 0.826
D)0.610 < p < 0.855
-Of 86 adults selected randomly from one town, 63 have health insurance. Find a 90% confidence interval for the true proportion of all adults in the town who have health insurance.
A)0.621 < p < 0.844
B)0.654 < p < 0.811
C)0.639 < p < 0.826
D)0.610 < p < 0.855
Unlock Deck
Unlock for access to all 139 flashcards in this deck.
Unlock Deck
k this deck
49
Find the minimum sample size you should use to assure that your estimate of p will be within the required margin of error around the population p
-Margin of error: ; confidence level: ; from a prior study, is estimated by the decimal equivalent of ,
A)177
B)531
C)7
D)157
-Margin of error: ; confidence level: ; from a prior study, is estimated by the decimal equivalent of ,
A)177
B)531
C)7
D)157
Unlock Deck
Unlock for access to all 139 flashcards in this deck.
Unlock Deck
k this deck
50
Solve the problem.
Find the point estimate of the true proportion of people who wear hearing aids if, in a random sample of 875 people, 56 people had hearing aids.
A)0.063
B)0.060
C)0.064
D)0.936
Find the point estimate of the true proportion of people who wear hearing aids if, in a random sample of 875 people, 56 people had hearing aids.
A)0.063
B)0.060
C)0.064
D)0.936
Unlock Deck
Unlock for access to all 139 flashcards in this deck.
Unlock Deck
k this deck
51
Find the minimum sample size you should use to assure that your estimate of p will be within the required margin of error around the population p
-Margin of error: ; confidence level: and are unknown
A) 176
B) 29,184
C) 86
D) 29,185
-Margin of error: ; confidence level: and are unknown
A) 176
B) 29,184
C) 86
D) 29,185
Unlock Deck
Unlock for access to all 139 flashcards in this deck.
Unlock Deck
k this deck
52
Solve the problem.
464 randomly selected light bulbs were tested in a laboratory, 424 lasted more than 500 hours. Find a point estimate of the true proportion of all light bulbs that last more than 500 hours.
A)0.914
B)0.912
C)0.477
D)0.086
464 randomly selected light bulbs were tested in a laboratory, 424 lasted more than 500 hours. Find a point estimate of the true proportion of all light bulbs that last more than 500 hours.
A)0.914
B)0.912
C)0.477
D)0.086
Unlock Deck
Unlock for access to all 139 flashcards in this deck.
Unlock Deck
k this deck
53
Solve the problem.
30 randomly picked people were asked if they rented or owned their own home, 30 said they rented. Obtain a point estimate of the true proportion of home owners.
A)0.500
B)0.000
C)1.000
D)0.033
30 randomly picked people were asked if they rented or owned their own home, 30 said they rented. Obtain a point estimate of the true proportion of home owners.
A)0.500
B)0.000
C)1.000
D)0.033
Unlock Deck
Unlock for access to all 139 flashcards in this deck.
Unlock Deck
k this deck
54
Find the minimum sample size you should use to assure that your estimate of p will be within the required margin of error around the population p
-Margin of error: ; confidence level: ; from a prior study, is estimated by
A) 24,541
B) 14,218
C) 172
D) 22,087
-Margin of error: ; confidence level: ; from a prior study, is estimated by
A) 24,541
B) 14,218
C) 172
D) 22,087
Unlock Deck
Unlock for access to all 139 flashcards in this deck.
Unlock Deck
k this deck
55
Find the minimum sample size you should use to assure that your estimate of p will be within the required margin of error around the population p
-Margin of error: ; confidence level: ; from a prior study, is estimated by .
A) 255
B) 6
C) 85
D) 75
-Margin of error: ; confidence level: ; from a prior study, is estimated by .
A) 255
B) 6
C) 85
D) 75
Unlock Deck
Unlock for access to all 139 flashcards in this deck.
Unlock Deck
k this deck
56
Find the minimum sample size you should use to assure that your estimate of p will be within the required margin of error around the population p
-Margin of error: ; confidence level: and are unknown
A) 1680
B) 21
C) 43
D) 1681
-Margin of error: ; confidence level: and are unknown
A) 1680
B) 21
C) 43
D) 1681
Unlock Deck
Unlock for access to all 139 flashcards in this deck.
Unlock Deck
k this deck
57
Use the given degree of confidence and sample data to construct a confidence interval for the population proportion p.
-A survey of 300 union members in New York State reveals that 112 favor the Republican candidate for governor. Construct the 98% confidence interval for the true population proportion of all New York State union members who favor the Republican candidate.
A)0.304 < p < 0.442
B)0.308 < p < 0.438
C)0.316 < p < 0.430
D)0.301 < p < 0.445
Unlock Deck
Unlock for access to all 139 flashcards in this deck.
Unlock Deck
k this deck
58
Solve the problem.
-50 people are selected randomly from a certain population and it is found that 20 people in the sample are over 6 feet tall. What is the point estimate of the true proportion of people in the population who are over 6 feet tall?
A)0.40
B)0.24
C)0.60
D)0.50
-50 people are selected randomly from a certain population and it is found that 20 people in the sample are over 6 feet tall. What is the point estimate of the true proportion of people in the population who are over 6 feet tall?
A)0.40
B)0.24
C)0.60
D)0.50
Unlock Deck
Unlock for access to all 139 flashcards in this deck.
Unlock Deck
k this deck
59
Find the minimum sample size you should use to assure that your estimate of p will be within the required margin of error around the population p
-Margin of error: ; confidence level: ; and are unknown
A) 753,425
B) 47,088
C) 47,089
D) 188,357
-Margin of error: ; confidence level: ; and are unknown
A) 753,425
B) 47,088
C) 47,089
D) 188,357
Unlock Deck
Unlock for access to all 139 flashcards in this deck.
Unlock Deck
k this deck
60
Use the given degree of confidence and sample data to construct a confidence interval for the population proportion p.
-Of 357 randomly selected medical students, 30 said that they planned to work in a rural community. Find a 95% confidence interval for the true proportion of all medical students who plan to work in a rural community.
A)0.0462 < p < 0.122
B)0.0599 < p < 0.108
C)0.0553 < p < 0.113
D)0.0498 < p < 0.118
Unlock Deck
Unlock for access to all 139 flashcards in this deck.
Unlock Deck
k this deck
61
Use the given degree of confidence and sample data to construct a confidence interval for the population proportion p.
-The sample size is is not known, and the original population is normally distributed.
A) No
B) Yes
-The sample size is is not known, and the original population is normally distributed.
A) No
B) Yes
Unlock Deck
Unlock for access to all 139 flashcards in this deck.
Unlock Deck
k this deck
62
Use the confidence level and sample data to find the margin of error E
-College students' annual earnings: confidence;
A)
B)
C)
D)
-College students' annual earnings: confidence;
A)
B)
C)
D)
Unlock Deck
Unlock for access to all 139 flashcards in this deck.
Unlock Deck
k this deck
63
Solve the problem.
-Suppose we wish to construct a confidence interval for a population proportion p. If we sample without replacement from a relatively small population of size N, the margin of error E is modified to include the finite population correction factor as follows: Construct a 90% confidence interval for the proportion of students at a school who are left handed. The number of students at the school is N = 400. In a random sample of 82 students, selected without replacement, there are 11 left handers.
A)0.091 < p < 0.177
B)0.086 < p < 0.182
C)0.072 < p < 0.196
D)0.079 < p < 0.189
Unlock Deck
Unlock for access to all 139 flashcards in this deck.
Unlock Deck
k this deck
64
Solve the problem.
-A researcher is interested in estimating the proportion of voters who favor a tax on e-commerce. Based on a sample of 250 people, she obtains the following 99% confidence interval for the population proportion p:
0.113 < p < 0.171
Which of the statements below is a valid interpretation of this confidence interval?
A: There is a 99% chance that the true value of p lies between 0.113 and 0.171.
B: If many different samples of size 250 were selected and, based on each sample, a confidence interval were constructed, 99% of the time the true value of p would lie between 0.113 and 0.171.
C: If many different samples of size 250 were selected and, based on each sample, a confidence interval were constructed, in the long run 99% of the confidence intervals would contain the true value of p.
D: If 100 different samples of size 250 were selected and, based on each sample, a confidence interval were constructed, exactly 99 of these confidence intervals would contain the true value of p.
A)A
B)D
C)B
D)C
Unlock Deck
Unlock for access to all 139 flashcards in this deck.
Unlock Deck
k this deck
65
Use the confidence level and sample data to find the margin of error E
-Weights of eggs: confidence;
A)
B)
C)
D)
-Weights of eggs: confidence;
A)
B)
C)
D)
Unlock Deck
Unlock for access to all 139 flashcards in this deck.
Unlock Deck
k this deck
66
Solve the problem.
-Find the critical valu that corresponds to a degree of confidence of 98%.
A)2.33
B)2.05
C)1.75
D)2.575
-Find the critical valu that corresponds to a degree of confidence of 98%.
A)2.33
B)2.05
C)1.75
D)2.575
Unlock Deck
Unlock for access to all 139 flashcards in this deck.
Unlock Deck
k this deck
67
Solve the problem.
In a certain population, body weights are normally distributed with a mean of 152 pounds and a standard deviation of 26 pounds. How many people must be surveyed if we want to estimate the percentage who weigh more than 180 pounds? Assume that we want 96% confidence that the error is no more than 2 percentage points.
A)923
B)1267
C)2001
D)2628
Unlock Deck
Unlock for access to all 139 flashcards in this deck.
Unlock Deck
k this deck
68
Solve the problem.
-A one-sided confidence interval for can be written as or where the margin of error is modified by replacing with . If a teacher wants to report that the fail rate on a test is at most with confidence, construct the appropriate one-sided confidence interval. Assume that a simple random sample of 58 students results in 5 who fail the test.
A)
B)
C)
D)
Unlock Deck
Unlock for access to all 139 flashcards in this deck.
Unlock Deck
k this deck
69
Use the confidence level and sample data to find the margin of error E
-Replacement times for washing machines: confidence; years, years
A) years
B) years
C) years
D) years
-Replacement times for washing machines: confidence; years, years
A) years
B) years
C) years
D) years
Unlock Deck
Unlock for access to all 139 flashcards in this deck.
Unlock Deck
k this deck
70
Use the given degree of confidence and sample data to construct a confidence interval for the population proportion p.
-Of 129 randomly selected adults, 32 were found to have high blood pressure. Construct a 95% confidence interval for the true percentage of all adults that have high blood pressure.
A)15.9% < p < 33.7%
B)17.4% < p < 32.3%
C)18.5% < p < 31.1%
D)15.0% < p < 34.6%
-Of 129 randomly selected adults, 32 were found to have high blood pressure. Construct a 95% confidence interval for the true percentage of all adults that have high blood pressure.
A)15.9% < p < 33.7%
B)17.4% < p < 32.3%
C)18.5% < p < 31.1%
D)15.0% < p < 34.6%
Unlock Deck
Unlock for access to all 139 flashcards in this deck.
Unlock Deck
k this deck
71
Determine whether the given conditions justify using the margin of error when finding a confidence interval estimate of the population mean .
-The sample size is and is not known.
A) No
B) Yes
-The sample size is and is not known.
A) No
B) Yes
Unlock Deck
Unlock for access to all 139 flashcards in this deck.
Unlock Deck
k this deck
72
Solve the problem.
A newspaper article about the results of a poll states: "In theory, the results of such a poll, in 99 cases out of 100 should differ by no more than 6 percentage points in either direction from what would have been obtained by interviewing all voters in the United States." Find the sample size suggested by this statement.
A)268
B)19
C)461
D)378
Unlock Deck
Unlock for access to all 139 flashcards in this deck.
Unlock Deck
k this deck
73
Use the given degree of confidence and sample data to construct a confidence interval for the population proportion p.
-Of 243 employees selected randomly from one company, 14.81% of them commute by carpooling. Construct a 90% confidence interval for the true percentage of all employees of the company who carpool.
A)9.50% < p < 20.1%
B)10.3% < p < 19.3%
C)8.94% < p < 20.7%
D)11.1% < p < 18.6%
-Of 243 employees selected randomly from one company, 14.81% of them commute by carpooling. Construct a 90% confidence interval for the true percentage of all employees of the company who carpool.
A)9.50% < p < 20.1%
B)10.3% < p < 19.3%
C)8.94% < p < 20.7%
D)11.1% < p < 18.6%
Unlock Deck
Unlock for access to all 139 flashcards in this deck.
Unlock Deck
k this deck
74
Solve the problem.
-Find the critical value that corresponds to a degree of confidence of 91%.
A)1.70
B)1.75
C)1.34
D)1.645
-Find the critical value that corresponds to a degree of confidence of 91%.
A)1.70
B)1.75
C)1.34
D)1.645
Unlock Deck
Unlock for access to all 139 flashcards in this deck.
Unlock Deck
k this deck
75
Use the given degree of confidence and sample data to construct a confidence interval for the population proportion p.
-A study involves 634 randomly selected deaths, with 32 of them caused by accidents. Construct a 98% confidence interval for the true percentage of all deaths that are caused by accidents.
A)3.61% < p < 6.48%
B)3.02% < p < 7.07%
C)2.80% < p < 7.29%
D)3.34% < p < 6.75%
-A study involves 634 randomly selected deaths, with 32 of them caused by accidents. Construct a 98% confidence interval for the true percentage of all deaths that are caused by accidents.
A)3.61% < p < 6.48%
B)3.02% < p < 7.07%
C)2.80% < p < 7.29%
D)3.34% < p < 6.75%
Unlock Deck
Unlock for access to all 139 flashcards in this deck.
Unlock Deck
k this deck
76
Use the given degree of confidence and sample data to construct a confidence interval for the population proportion p.
-Of 132 adults selected randomly from one town, 33 of them smoke. Construct a 99% confidence interval for the true percentage of all adults in the town that smoke.
A)16.2% < p < 33.8%
B)18.8% < p < 31.2%
C)15.3% < p < 34.7%
D)17.6% < p < 32.4%
-Of 132 adults selected randomly from one town, 33 of them smoke. Construct a 99% confidence interval for the true percentage of all adults in the town that smoke.
A)16.2% < p < 33.8%
B)18.8% < p < 31.2%
C)15.3% < p < 34.7%
D)17.6% < p < 32.4%
Unlock Deck
Unlock for access to all 139 flashcards in this deck.
Unlock Deck
k this deck
77
Solve the problem.
-Find the value of that corresponds to a level of confidence of 98.22 percent.
A)2.1
B)2.37
C)0.0089
D)-2.37
-Find the value of that corresponds to a level of confidence of 98.22 percent.
A)2.1
B)2.37
C)0.0089
D)-2.37
Unlock Deck
Unlock for access to all 139 flashcards in this deck.
Unlock Deck
k this deck
78
Solve the problem.
-Suppose that n trials of a binomial experiment result in no successes. According to the "Rule of Three", we have 95% confidence that the true population proportion has an upper bound of 3/n. If a manufacturer randomly selects 21 computers for quality control and finds no defective computers, what statement can you make by using the rule of three, about the proportion p, of all its computers which are defective?
A) We are confident that is greater than .
B) We are confident that does not exceed .
C) We are confident that lies between and .
D) The value of cannot be greater than .
Unlock Deck
Unlock for access to all 139 flashcards in this deck.
Unlock Deck
k this deck
79
Determine whether the given conditions justify using the margin of error when finding a confidence interval estimate of the population mean .
-The sample size is n = 286 and
A)Yes
B)No
-The sample size is n = 286 and
A)Yes
B)No
Unlock Deck
Unlock for access to all 139 flashcards in this deck.
Unlock Deck
k this deck
80
Determine whether the given conditions justify using the margin of error when finding a confidence interval estimate of the population mean .
-The sample size is n and the original population is normally distributed.
A)Yes
B)No
-The sample size is n and the original population is normally distributed.
A)Yes
B)No
Unlock Deck
Unlock for access to all 139 flashcards in this deck.
Unlock Deck
k this deck
Unlock Deck
Unlock for access to all 139 flashcards in this deck.


