Deck 11: Multinomial Experiments and Contingency Tables
Full screen (f)
Question
Question
Provide an appropriate response.
The following table shows the number of employees who called in sick at a business for different days of a particular week.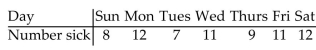 i)At the 0.05 level of significance, test the claim that sick days occur with equal frequency on the different days of the week. ii)Test the claim after changing the frequency for Saturday to 152. Describe the effect of this outlier on the test.
The following table shows the number of employees who called in sick at a business for different days of a particular week.
i)At the 0.05 level of significance, test the claim that sick days occur with equal frequency on the different days of the week. ii)Test the claim after changing the frequency for Saturday to 152. Describe the effect of this outlier on the test. Question
Question
Provide an appropriate response.
Question
Question
Question
Provide an appropriate response.
An observed frequency distribution of exam scores is as follows: nging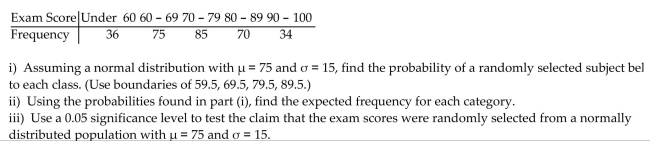
An observed frequency distribution of exam scores is as follows: nging
Question
Question
Question
Provide an appropriate response.
An observed frequency distribution of exam scores is as follows: nging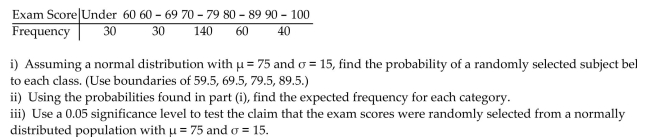
An observed frequency distribution of exam scores is as follows: nging
Question
Question
Question
Question
Question
Provide an appropriate response.
An observed frequency distribution is as follows: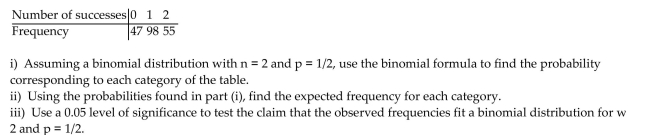 =
=
An observed frequency distribution is as follows:
= Question
Provide an appropriate response.
An observed frequency distribution is as follows: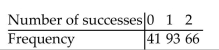 i)Assuming a binomial distribution with n = 2 and p = 1/2, use the binomial formula to find the probability corresponding to each category of the table. ii)Using the probabilities found in part (i), find the expected frequency for each category. iii)Use a 0.05 level of significance to test the claim that the observed frequencies fit a binomial distribution for which n = 2 and p = 1/2.
An observed frequency distribution is as follows:
i)Assuming a binomial distribution with n = 2 and p = 1/2, use the binomial formula to find the probability corresponding to each category of the table. ii)Using the probabilities found in part (i), find the expected frequency for each category. iii)Use a 0.05 level of significance to test the claim that the observed frequencies fit a binomial distribution for which n = 2 and p = 1/2. Question
Question
Question
Question
Question
Question
Question
Question
Question
Question
Question
Question
Question
Question
Question

Unlock Deck
Sign up to unlock the cards in this deck!
Unlock Deck
Unlock Deck
1/31
Play
Full screen (f)
Deck 11: Multinomial Experiments and Contingency Tables
1
Perform the indicated goodness-of-fit test
-You roll a die 48 times with the following results. Use a significance level of 0.05 to test the claim that the die is fair.
-You roll a die 48 times with the following results. Use a significance level of 0.05 to test the claim that the die is fair.
: The die is fair (all numbers occur with equal frequency).
: The die is not fair.
Test statistic: . Critical value: . Reject the null hypothesis. There is sufficient evidence to warrant rejection of the claim that the die is fair. Provide an appropriate response.
: The die is not fair.
Test statistic: . Critical value: . Reject the null hypothesis. There is sufficient evidence to warrant rejection of the claim that the die is fair. Provide an appropriate response.
2
Provide an appropriate response.
The following table shows the number of employees who called in sick at a business for different days of a particular week. i)At the 0.05 level of significance, test the claim that sick days occur with equal frequency on the different days of the week. ii)Test the claim after changing the frequency for Saturday to 152. Describe the effect of this outlier on the test.
The following table shows the number of employees who called in sick at a business for different days of a particular week.
i)At the 0.05 level of significance, test the claim that sick days occur with equal frequency on the different days of the week. ii)Test the claim after changing the frequency for Saturday to 152. Describe the effect of this outlier on the test. Use a 2 test to test the claim that in the given contingency table, the row variable and the column variable are
independent.
3
Perform the indicated goodness-of-fit test
-A company manager wishes to test a union leader's claim that absences occur on the different week days with the same frequencies. Test this claim at the 0.05 level of significance if the following sample data have been compiled.
-A company manager wishes to test a union leader's claim that absences occur on the different week days with the same frequencies. Test this claim at the 0.05 level of significance if the following sample data have been compiled.
: The proportions of absences are all the same.
: The proportions of absences are not all the same.
Test statistic: . Critical value: . Reject the null hypothesis. There is sufficient evidenci to warrant rejection of the claim that absences occur on the different week days with the same frequency.
: The proportions of absences are not all the same.
Test statistic: . Critical value: . Reject the null hypothesis. There is sufficient evidenci to warrant rejection of the claim that absences occur on the different week days with the same frequency.
4
Provide an appropriate response.
Unlock Deck
Unlock for access to all 31 flashcards in this deck.
Unlock Deck
k this deck
5
Perform the indicated goodness-of-fit test
-In studying the responses to a multiple-choice test question, the following sample data were obtained. At the 0.05 significance level, test the claim that the responses occur with the same frequency.
-In studying the responses to a multiple-choice test question, the following sample data were obtained. At the 0.05 significance level, test the claim that the responses occur with the same frequency.
Unlock Deck
Unlock for access to all 31 flashcards in this deck.
Unlock Deck
k this deck
6
Provide an appropriate response.
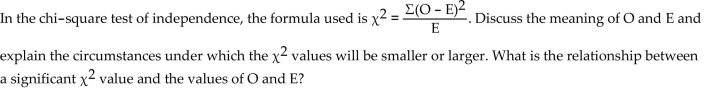
-Describe the null hypothesis for the test of independence. List the assumptions for the ?2 test of independence. What is the major difference between the assumptions for this test and the assumptions for the previous tests we have studied?
-Describe the null hypothesis for the test of independence. List the assumptions for the ?2 test of independence. What is the major difference between the assumptions for this test and the assumptions for the previous tests we have studied?
Unlock Deck
Unlock for access to all 31 flashcards in this deck.
Unlock Deck
k this deck
7
Provide an appropriate response.
An observed frequency distribution of exam scores is as follows: nging
An observed frequency distribution of exam scores is as follows: nging
Unlock Deck
Unlock for access to all 31 flashcards in this deck.
Unlock Deck
k this deck
8
Perform the indicated goodness-of-fit test
-Use a significance level of 0.01 to test the claim that workplace accidents are distributed on workdays as follows: Monday 25%, Tuesday: 15%, Wednesday: 15%, Thursday: 15%, and Friday: 30%. In a study of 100 workplace accidents, 23 occurred on a Monday, 12 occurred on a Tuesday, 12 occurred on a Wednesday, 18 occurred on a Thursday, and 35 occurred on a Friday.
-Use a significance level of 0.01 to test the claim that workplace accidents are distributed on workdays as follows: Monday 25%, Tuesday: 15%, Wednesday: 15%, Thursday: 15%, and Friday: 30%. In a study of 100 workplace accidents, 23 occurred on a Monday, 12 occurred on a Tuesday, 12 occurred on a Wednesday, 18 occurred on a Thursday, and 35 occurred on a Friday.
Unlock Deck
Unlock for access to all 31 flashcards in this deck.
Unlock Deck
k this deck
9
Perform the indicated goodness-of-fit test
-Using the data below and a 0.05 significance level, test the claim that the responses occur with percentages of 15%, 20%, 25%, 25%, and 15% respectively.
-Using the data below and a 0.05 significance level, test the claim that the responses occur with percentages of 15%, 20%, 25%, 25%, and 15% respectively.
Unlock Deck
Unlock for access to all 31 flashcards in this deck.
Unlock Deck
k this deck
10
Provide an appropriate response.
An observed frequency distribution of exam scores is as follows: nging
An observed frequency distribution of exam scores is as follows: nging
Unlock Deck
Unlock for access to all 31 flashcards in this deck.
Unlock Deck
k this deck
11
Provide an appropriate response.
-Describe the test of homogeneity. What characteristic distinguishes a test of homogeneity from a test of independence?
-Describe the test of homogeneity. What characteristic distinguishes a test of homogeneity from a test of independence?
Unlock Deck
Unlock for access to all 31 flashcards in this deck.
Unlock Deck
k this deck
12
Provide an appropriate response.
-Describe a goodness-of-fit test. What assumptions are made when using a goodness-of-fit test?
-Describe a goodness-of-fit test. What assumptions are made when using a goodness-of-fit test?
Unlock Deck
Unlock for access to all 31 flashcards in this deck.
Unlock Deck
k this deck
13
Provide an appropriate response.
Explain the computation of expected values for contingency tables in terms of probabilities. Refer to the assumptions of the null hypothesis as part of your explanation. You might give a brief example to illustrate.
Explain the computation of expected values for contingency tables in terms of probabilities. Refer to the assumptions of the null hypothesis as part of your explanation. You might give a brief example to illustrate.
Unlock Deck
Unlock for access to all 31 flashcards in this deck.
Unlock Deck
k this deck
14
Provide an appropriate response.
-Draw an example of a representative chi-square distribution and discuss three characteristics of a chi-square distribution. Show an example of the special case of the chi-square distribution for only 1 or 2 degrees of freedom.
-Draw an example of a representative chi-square distribution and discuss three characteristics of a chi-square distribution. Show an example of the special case of the chi-square distribution for only 1 or 2 degrees of freedom.
Unlock Deck
Unlock for access to all 31 flashcards in this deck.
Unlock Deck
k this deck
15
Provide an appropriate response.
An observed frequency distribution is as follows: =
An observed frequency distribution is as follows:
= Unlock Deck
Unlock for access to all 31 flashcards in this deck.
Unlock Deck
k this deck
16
Provide an appropriate response.
An observed frequency distribution is as follows: i)Assuming a binomial distribution with n = 2 and p = 1/2, use the binomial formula to find the probability corresponding to each category of the table. ii)Using the probabilities found in part (i), find the expected frequency for each category. iii)Use a 0.05 level of significance to test the claim that the observed frequencies fit a binomial distribution for which n = 2 and p = 1/2.
An observed frequency distribution is as follows:
i)Assuming a binomial distribution with n = 2 and p = 1/2, use the binomial formula to find the probability corresponding to each category of the table. ii)Using the probabilities found in part (i), find the expected frequency for each category. iii)Use a 0.05 level of significance to test the claim that the observed frequencies fit a binomial distribution for which n = 2 and p = 1/2. Unlock Deck
Unlock for access to all 31 flashcards in this deck.
Unlock Deck
k this deck
17
Provide an appropriate response.
Define categorical data and give an example.
Define categorical data and give an example.
Unlock Deck
Unlock for access to all 31 flashcards in this deck.
Unlock Deck
k this deck
18
Perform the indicated goodness-of-fit test
-In studying the occurrence of genetic characteristics, the following sample data were obtained. At the 0.05 significance level, test the claim that the characteristics occur with the same frequency.
-In studying the occurrence of genetic characteristics, the following sample data were obtained. At the 0.05 significance level, test the claim that the characteristics occur with the same frequency.
Unlock Deck
Unlock for access to all 31 flashcards in this deck.
Unlock Deck
k this deck
19
Use a ?2 test to test the claim that in the given contingency table, the row variable and the column variable are independent
-Tests for adverse reactions to a new drug yielded the results given in the table. At the 0.05 significance level, test the claim that the treatment (drug or placebo)is independent of the reaction (whether or not headaches were experienced).
-Tests for adverse reactions to a new drug yielded the results given in the table. At the 0.05 significance level, test the claim that the treatment (drug or placebo)is independent of the reaction (whether or not headaches were experienced).
Unlock Deck
Unlock for access to all 31 flashcards in this deck.
Unlock Deck
k this deck
20
Perform the indicated goodness-of-fit test
-Among the four northwestern states, Washington has 51% of the total population, Oregon has 30%, Idaho has 11%, and Montana has 8%. A market researcher selects a sample of 1000 subjects, with 450 in Washington, 340 in Oregon, 150 in Idaho, and 60 in Montana. At the 0.05 significance level, test the claim that the sample of 1000 subjects has a distribution that agrees with the distribution of state populations.
-Among the four northwestern states, Washington has 51% of the total population, Oregon has 30%, Idaho has 11%, and Montana has 8%. A market researcher selects a sample of 1000 subjects, with 450 in Washington, 340 in Oregon, 150 in Idaho, and 60 in Montana. At the 0.05 significance level, test the claim that the sample of 1000 subjects has a distribution that agrees with the distribution of state populations.
Unlock Deck
Unlock for access to all 31 flashcards in this deck.
Unlock Deck
k this deck
21
A researcher wishes to test the effectiveness of a flu vaccination. 150 people are vaccinated, 180 people are vaccinated with a placebo, and 100 people are not vaccinated. The number in each group who later caught the flu was recorded. The results are shown below. Use a 0.05 significance level to test the claim that the proportion of people catching the flu is the same in all three groups.
Unlock Deck
Unlock for access to all 31 flashcards in this deck.
Unlock Deck
k this deck
22
Use a ?2 test to test the claim that in the given contingency table, the row variable and the column variable are independent
-The table below shows the age and favorite type of music of 668 randomly selected people. Use a 5 percent level of significance to test the null hypothesis that age and preferred music type are independent.
-The table below shows the age and favorite type of music of 668 randomly selected people. Use a 5 percent level of significance to test the null hypothesis that age and preferred music type are independent.
Unlock Deck
Unlock for access to all 31 flashcards in this deck.
Unlock Deck
k this deck
23
Use a ?2 test to test the claim that in the given contingency table, the row variable and the column variable are independent
-Responses to a survey question are broken down according to employment status and the sample results are given below. At the 0.10 significance level, test the claim that response and employment status are independent.
-Responses to a survey question are broken down according to employment status and the sample results are given below. At the 0.10 significance level, test the claim that response and employment status are independent.
Unlock Deck
Unlock for access to all 31 flashcards in this deck.
Unlock Deck
k this deck
24
A survey conducted in a small business yielded the results shown in the table.
i) Test the claim that health care coverage is independent of gender. Use a significance level.
ii) Using Yates' correction, replace with and repeat the test. What effect does Yates correction have on the value of the test statistic?
i) Test the claim that health care coverage is independent of gender. Use a significance level.
ii) Using Yates' correction, replace with and repeat the test. What effect does Yates correction have on the value of the test statistic?
Unlock Deck
Unlock for access to all 31 flashcards in this deck.
Unlock Deck
k this deck
25
At a high school debate tournament, half of the teams were asked to wear suits and ties and the rest were asked to wear jeans and t-shirts. The results are given in the table below. Test the hypothesis at the 0.05 level that the proportion of wins is the same for teams wearing suits as for teams wearing jeans.
Unlock Deck
Unlock for access to all 31 flashcards in this deck.
Unlock Deck
k this deck
26
Use a ?2 test to test the claim that in the given contingency table, the row variable and the column variable are independent
-Use the sample data below to test whether car color affects the likelihood of being in an accident. Use a significance level of 0.01.
-Use the sample data below to test whether car color affects the likelihood of being in an accident. Use a significance level of 0.01.
Unlock Deck
Unlock for access to all 31 flashcards in this deck.
Unlock Deck
k this deck
27
Use a 0.01 significance level to test the claim that the proportion of men who plan to vote in the next election is the same as the proportion of women who plan to vote. 300 men and 300 women were randomly selected and asked whether they planned to vote in the next election. The results are shown below.
Unlock Deck
Unlock for access to all 31 flashcards in this deck.
Unlock Deck
k this deck
28
A researcher wishes to test whether the proportion of college students who smoke is the same in four different colleges. She randomly selects 100 students from each college and records the number that smoke. The results are shown below. Use a 0.01 significance level to test the claim that the proportion of students smoking is the same at all four colleges.
Unlock Deck
Unlock for access to all 31 flashcards in this deck.
Unlock Deck
k this deck
29
Use a ?2 test to test the claim that in the given contingency table, the row variable and the column variable are independent
-Responses to a survey question are broken down according to gender and the sample results are given below. At the 0.05 significance level, test the claim that response and gender are independent.
-Responses to a survey question are broken down according to gender and the sample results are given below. At the 0.05 significance level, test the claim that response and gender are independent.
Unlock Deck
Unlock for access to all 31 flashcards in this deck.
Unlock Deck
k this deck
30
Use a ?2 test to test the claim that in the given contingency table, the row variable and the column variable are independent
-160 students who were majoring in either math or English were asked a test question, and the researcher recorded whether they answered the question correctly. The sample results are given below. At the 0.10 significance level, test the claim that response and major are independent.
-160 students who were majoring in either math or English were asked a test question, and the researcher recorded whether they answered the question correctly. The sample results are given below. At the 0.10 significance level, test the claim that response and major are independent.
Unlock Deck
Unlock for access to all 31 flashcards in this deck.
Unlock Deck
k this deck
31
A survey conducted in a small town yielded the results shown in the table.
i) Test the claim that the intention to vote in the next presidential election is independent of the gender of the pel being surveyed. Use a significance level.
ii) Using Yates' correction, replace with and repeat the test. What effect does Yates correction have on the value of the test statistic?
i) Test the claim that the intention to vote in the next presidential election is independent of the gender of the pel being surveyed. Use a significance level.
ii) Using Yates' correction, replace with and repeat the test. What effect does Yates correction have on the value of the test statistic?
Unlock Deck
Unlock for access to all 31 flashcards in this deck.
Unlock Deck
k this deck
Unlock Deck
Unlock for access to all 31 flashcards in this deck.


