Deck 9: Inferences From Two Samples
Full screen (f)
Question
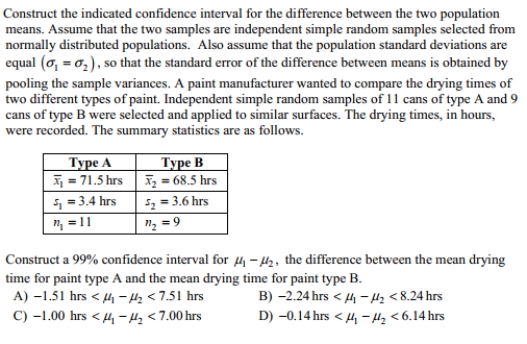
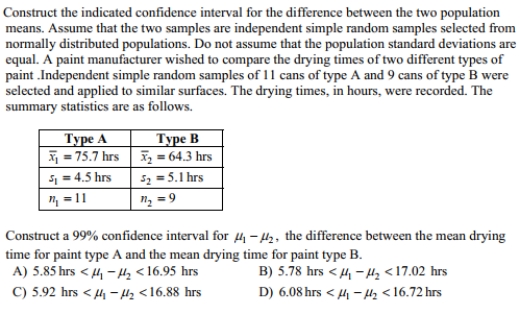
Construct the indicated confidence interval for the difference between the two population means. Assume that the two samples are independent simple random samples selected from
Normally distributed populations. Do not assume that the population standard deviations are
Equal. A paint manufacturer wished to compare the drying times of two different types of
Paint. Independent simple random samples of 11 cans of type A and 9 cans of type B were
Selected and applied to similar surfaces. The drying times, in hours, were recorded. The
Summary statistics are as follows.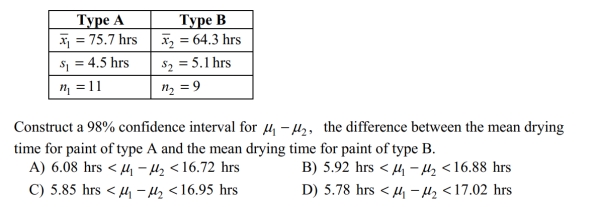
Question
Question
Question
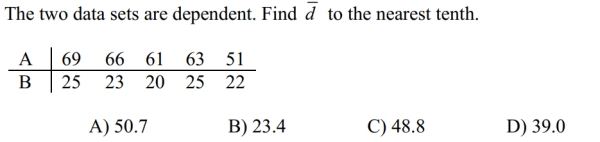
Find  . The differences between two sets of dependent data are 0.4, 0.24, 0.22, 0.26, 0.34. Round to the nearest hundredth.
A) 0.08
B) 0.12
C) 0.04
D) 0.24
. The differences between two sets of dependent data are 0.4, 0.24, 0.22, 0.26, 0.34. Round to the nearest hundredth.A) 0.08
B) 0.12
C) 0.04
D) 0.24
Question
Question
Question
Express the alternative hypothesis in symbolic form. of time (in hours)sophomores spent studying for the statistics final exam is more than that of
Freshmen. Assume that the two samples are independent. Let the freshmen be the first
Population and the sophomores be the second population.
Freshmen. Assume that the two samples are independent. Let the freshmen be the first
Population and the sophomores be the second population.
Question
Question
Question
Question
Question
Question
Question
Question
Question
Question
Question
Question
Question
Question
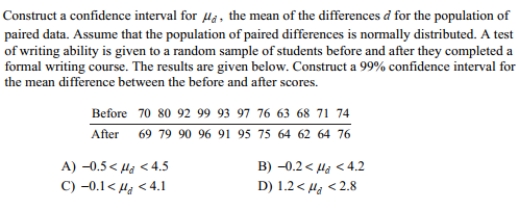
A test of abstract reasoning is given to a random sample of students before and after they completed a formal logic course. The results are given below. Construct a 95% confidence
Interval for the mean difference between the before and after scores.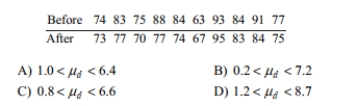
Interval for the mean difference between the before and after scores.
Question
Question
Construct a confidence interval for μd , paired data. Assume that the population of paired differences is normally distributed. Using
The sample paired data below, construct a 90% confidence interval for the population mean
Of all differences.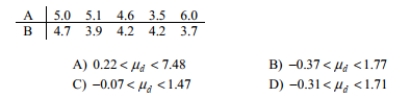
The sample paired data below, construct a 90% confidence interval for the population mean
Of all differences.
Question
A paint manufacturer made a modification to a paint to speed up its drying time. Independent simple random samples of 11 cans of type A (the original paint)and 9 cans of type B (the
Modified paint)were selected and applied to similar surfaces. The drying times, in hours, were
Recorded. The summary statistics are as follows.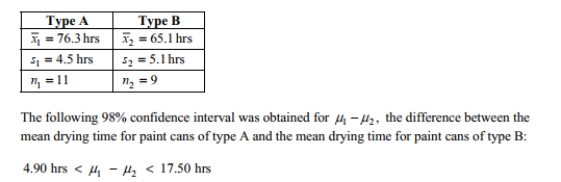 What does the confidence interval suggest about the population means?
A) The confidence interval includes only positive values which suggests that the two population means might be equal. There doesn't appear to be a significant difference
Between the mean drying time for paint type A and the mean drying time for paint type B.
The modification does not seem to be effective in reducing drying times.
B) The confidence interval includes 0 which suggests that the two population means might be equal. There doesn't appear to be a significant difference between the mean drying time for
Paint type A and the mean drying time for paint type B. The modification does not seem to
Be effective in reducing drying times.
C) The confidence interval includes only positive values which suggests that the mean drying time for paint type A is smaller than the mean drying time for paint type B. The
Modification does not seem to be effective in reducing drying times.
D) The confidence interval includes only positive values which suggests that the mean drying time for paint type A is greater than the mean drying time for paint type B. The
Modification seems to be effective in reducing drying times.
Modified paint)were selected and applied to similar surfaces. The drying times, in hours, were
Recorded. The summary statistics are as follows.
What does the confidence interval suggest about the population means?A) The confidence interval includes only positive values which suggests that the two population means might be equal. There doesn't appear to be a significant difference
Between the mean drying time for paint type A and the mean drying time for paint type B.
The modification does not seem to be effective in reducing drying times.
B) The confidence interval includes 0 which suggests that the two population means might be equal. There doesn't appear to be a significant difference between the mean drying time for
Paint type A and the mean drying time for paint type B. The modification does not seem to
Be effective in reducing drying times.
C) The confidence interval includes only positive values which suggests that the mean drying time for paint type A is smaller than the mean drying time for paint type B. The
Modification does not seem to be effective in reducing drying times.
D) The confidence interval includes only positive values which suggests that the mean drying time for paint type A is greater than the mean drying time for paint type B. The
Modification seems to be effective in reducing drying times.
Question
Question
Express the alternative hypothesis in symbolic form. An automobile technician claims that the mean amount of time (in hours)per domestic car repair is more than that of foreign cars.
Assume that two samples are independent. Let the domestic car repair times be the first
Population and the foreign car repair times be the second population.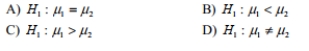
Assume that two samples are independent. Let the domestic car repair times be the first
Population and the foreign car repair times be the second population.
Question
Question
Question
Question
Question
Question
Question
Question
Question
Question
Question
Question
Question
Question
Question
Question
Question
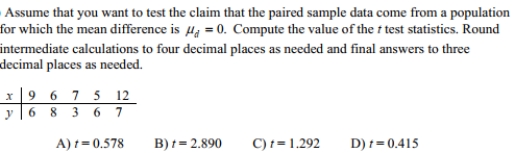
Test the given claim about the means of two populations. Assume that two dependent samples
have been randomly selected from normally distributed populations. A coach uses a new
technique to train gymnasts. 7 gymnasts were randomly selected and their competition scores
were recorded before and after the training. The results are shown below.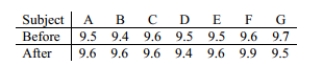 Using a 0.01 level of significance, test the claim that the training technique is effective in raising
the gymnasts' scores. Include your null and alternative hypotheses, the test statistic, P-value or
critical value(s), conclusion about the null hypothesis, and conclusion about the claim in your
answer.
have been randomly selected from normally distributed populations. A coach uses a new
technique to train gymnasts. 7 gymnasts were randomly selected and their competition scores
were recorded before and after the training. The results are shown below.
Using a 0.01 level of significance, test the claim that the training technique is effective in raisingthe gymnasts' scores. Include your null and alternative hypotheses, the test statistic, P-value or
critical value(s), conclusion about the null hypothesis, and conclusion about the claim in your
answer.
Question
Question
Question
Assume that the two samples are independent simple random samples selected from normally
distributed populations. Do not assume that the population standard deviations are equal. A
researcher wishes to determine whether people can reduce their resting heart rate by following
a particular diet. Construct a 95% confidence interval estimate for the following data. Does
the confidence interval support that the mean resting heart rate for those on the diet is lower
than that of those not on the diet? Explain your reasoning.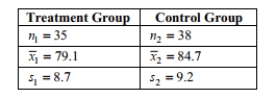
Question
Question
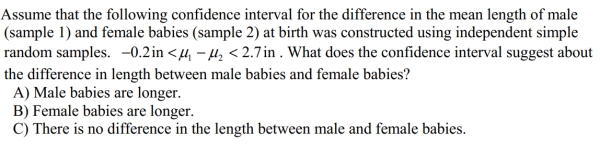
A researcher wishes to determine whether the blood pressure of vegetarians is, on average,
lower than the blood pressure of nonvegetarians. Independent simple random samples of 85
vegetarians and 75 nonvegetarians yielded the following sample statistics for systolic blood
pressure: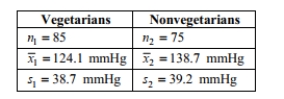 Use a significance level of 0.01 to test the claim that the mean systolic blood pressure of
vegetarians is lower than the mean systolic blood pressure of nonvegetarians. Include your null
and alternative hypotheses, the test statistic, P-value or critical value(s), conclusion about the
null hypothesis, and conclusion about the claim in your answer.
lower than the blood pressure of nonvegetarians. Independent simple random samples of 85
vegetarians and 75 nonvegetarians yielded the following sample statistics for systolic blood
pressure:
Use a significance level of 0.01 to test the claim that the mean systolic blood pressure ofvegetarians is lower than the mean systolic blood pressure of nonvegetarians. Include your null
and alternative hypotheses, the test statistic, P-value or critical value(s), conclusion about the
null hypothesis, and conclusion about the claim in your answer.
Question
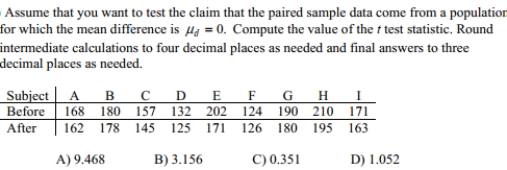
Test the given claim about the means of two populations. Assume that two dependent samples
have been randomly selected from normally distributed populations. A test of abstract reasoning
is given to a random sample of students before and after they completed a formal logic course.
The results are given below. At the 0.05 significance level, test the claim that the mean score is
not affected by the course. Include your null and alternative hypotheses, the test statistic, P-value
or critical value(s), conclusion about the null hypothesis, and conclusion about the claim in your
answer.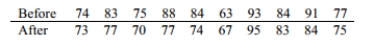
Question
Question
Question
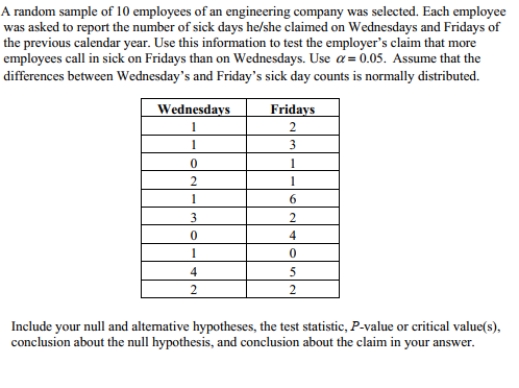
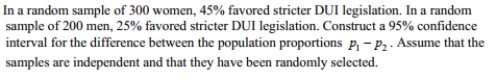
A Dean of Students conducted a survey to test the claim that women spend more time visiting
the STEM lab than men do. A survey was administered to a simple random sample of 15
female student volunteers and 12 male volunteers that asked, "How many minutes have you
spent in the STEM lab this semester?" The results are shown below.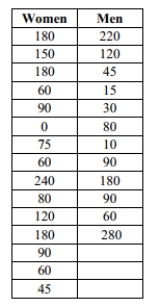 Test the claim at the 1% level of significance. Assume that the number of minutes that
women and men spent in the STEM lab is normally distributed. Do not assume that the
population standard deviations are equal. Include your null and alternative hypotheses, the
test statistic, P-value or critical value(s), conclusion about the null hypothesis, and conclusion
about the claim in your answer.
the STEM lab than men do. A survey was administered to a simple random sample of 15
female student volunteers and 12 male volunteers that asked, "How many minutes have you
spent in the STEM lab this semester?" The results are shown below.
Test the claim at the 1% level of significance. Assume that the number of minutes thatwomen and men spent in the STEM lab is normally distributed. Do not assume that the
population standard deviations are equal. Include your null and alternative hypotheses, the
test statistic, P-value or critical value(s), conclusion about the null hypothesis, and conclusion
about the claim in your answer.
Question
Test the indicated claim about the means of two populations. Assume that the two samples are
independent simple random samples selected from normally distributed populations. Do not
assume that the population standard deviations are equal. A researcher wishes to determine
whether people with high blood pressure can reduce their blood pressure, measured in mm Hg,
by following a particular diet. Use a significance level of 0.01 to test the claim that the treatment
group is from a population with a smaller mean than the control group. Include your null and
alternative hypotheses, the test statistic, P-value or critical value(s), conclusion about the null
hypothesis, and conclusion about the claim in your answer.
Question
Test the given claim about the means of two populations. Assume that two dependent samples
have been randomly selected from normally distributed populations.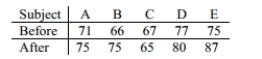 Using a 0.01 level of significance, test the claim that the tutoring has an effect on the math
scores. Include your null and alternative hypotheses, the test statistic, P-value or critical
value(s), conclusion about the null hypothesis, and conclusion about the claim in your answer.
have been randomly selected from normally distributed populations.
Using a 0.01 level of significance, test the claim that the tutoring has an effect on the mathscores. Include your null and alternative hypotheses, the test statistic, P-value or critical
value(s), conclusion about the null hypothesis, and conclusion about the claim in your answer.
Question
Test the indicated claim about the means of two populations. Assume that the two samples are
independent simple random samples selected from normally distributed populations. Do not
assume that the population standard deviations are equal.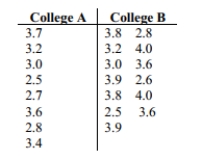 Use a 0.10 significance level to test the claim that the mean GPA of students at college A is
different from the mean GPA of students at college B. Include your null and alternative
hypotheses, the test statistic, p-value or critical value(s), conclusion about the null hypothesis,
and conclusion about the claim in your answer.
independent simple random samples selected from normally distributed populations. Do not
assume that the population standard deviations are equal.
Use a 0.10 significance level to test the claim that the mean GPA of students at college A isdifferent from the mean GPA of students at college B.
Include your null and alternativehypotheses, the test statistic, p-value or critical value(s), conclusion about the null hypothesis,
and conclusion about the claim in your answer.
Question
Test the indicated claim about the means of two populations. Assume that the two samples are
independent simple random samples selected from normally distributed populations. Do not
assume that the population standard deviations are equal.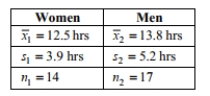 Use a 0.05 significance level to test the claim that the mean amount of time spent watching
television by women is smaller than the mean amount of time spent watching television by
men. Include your null and alternative hypotheses, the test statistic, P-value or critical value(s),
conclusion about the null hypothesis, and conclusion about the claim in your answer.
independent simple random samples selected from normally distributed populations. Do not
assume that the population standard deviations are equal.
Use a 0.05 significance level to test the claim that the mean amount of time spent watchingtelevision by women is smaller than the mean amount of time spent watching television by
men. Include your null and alternative hypotheses, the test statistic, P-value or critical value(s),
conclusion about the null hypothesis, and conclusion about the claim in your answer.
Question
When testing for a difference between the means of a treatment group and a placebo group, the
computer display below is obtained. Using a 0.05 significance level, is there sufficient evidence
to support the claim that the treatment group (variable 1)comes from a population with a mean
that is less than the mean for the placebo population? Explain.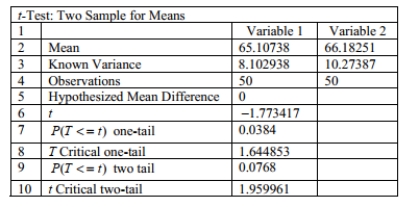
computer display below is obtained. Using a 0.05 significance level, is there sufficient evidence
to support the claim that the treatment group (variable 1)comes from a population with a mean
that is less than the mean for the placebo population? Explain.
Question
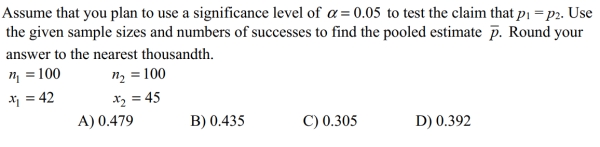
To test the null hypothesis that the difference between two population proportions is
equal to a nonzero constant c, use the test statistic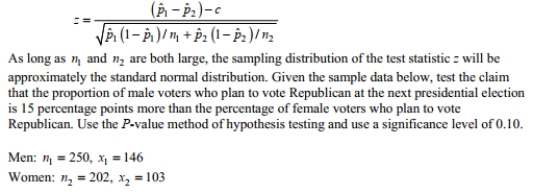
equal to a nonzero constant c, use the test statistic
Question
Question

Unlock Deck
Sign up to unlock the cards in this deck!
Unlock Deck
Unlock Deck
1/60
Play
Full screen (f)
Deck 9: Inferences From Two Samples
1
Construct the indicated confidence interval for the difference between the two population means. Assume that the two samples are independent simple random samples selected from
Normally distributed populations. Do not assume that the population standard deviations are
Equal. A paint manufacturer wished to compare the drying times of two different types of
Paint. Independent simple random samples of 11 cans of type A and 9 cans of type B were
Selected and applied to similar surfaces. The drying times, in hours, were recorded. The
Summary statistics are as follows.
Normally distributed populations. Do not assume that the population standard deviations are
Equal. A paint manufacturer wished to compare the drying times of two different types of
Paint. Independent simple random samples of 11 cans of type A and 9 cans of type B were
Selected and applied to similar surfaces. The drying times, in hours, were recorded. The
Summary statistics are as follows.
D
2
D
3
B
4
Find . The differences between two sets of dependent data are 0.4, 0.24, 0.22, 0.26, 0.34. Round to the nearest hundredth.
A) 0.08
B) 0.12
C) 0.04
D) 0.24
. The differences between two sets of dependent data are 0.4, 0.24, 0.22, 0.26, 0.34. Round to the nearest hundredth.A) 0.08
B) 0.12
C) 0.04
D) 0.24
Unlock Deck
Unlock for access to all 60 flashcards in this deck.
Unlock Deck
k this deck
5
Unlock Deck
Unlock for access to all 60 flashcards in this deck.
Unlock Deck
k this deck
6
Unlock Deck
Unlock for access to all 60 flashcards in this deck.
Unlock Deck
k this deck
7
Express the alternative hypothesis in symbolic form. of time (in hours)sophomores spent studying for the statistics final exam is more than that of
Freshmen. Assume that the two samples are independent. Let the freshmen be the first
Population and the sophomores be the second population.
Freshmen. Assume that the two samples are independent. Let the freshmen be the first
Population and the sophomores be the second population.
Unlock Deck
Unlock for access to all 60 flashcards in this deck.
Unlock Deck
k this deck
8
Which distribution is used to test the claim that the standard deviation of the ages (in years)of when girls first learn to ride a bike is equal to the standard deviation of the ages (in years)
When boys first lean to ride a bike?
A) Normal
B) t
C) chi-square
D) F
When boys first lean to ride a bike?
A) Normal
B) t
C) chi-square
D) F
Unlock Deck
Unlock for access to all 60 flashcards in this deck.
Unlock Deck
k this deck
9
Determine whether the samples are independent or dependent. The effectiveness of a headache medicine is tested by measuring the intensity of a headache in patients before and after drug
Treatment. The data consist of before and after intensities for each patient.
A) Independent samples
B) Dependent samples
Treatment. The data consist of before and after intensities for each patient.
A) Independent samples
B) Dependent samples
Unlock Deck
Unlock for access to all 60 flashcards in this deck.
Unlock Deck
k this deck
10
Determine whether the following statement regarding the hypothesis test for two population
proportions is true or false:
However small the difference between two population proportions, for sufficiently large
sample sizes, the null hypothesis of equal population proportions is likely to be rejected.
proportions is true or false:
However small the difference between two population proportions, for sufficiently large
sample sizes, the null hypothesis of equal population proportions is likely to be rejected.
Unlock Deck
Unlock for access to all 60 flashcards in this deck.
Unlock Deck
k this deck
11
Unlock Deck
Unlock for access to all 60 flashcards in this deck.
Unlock Deck
k this deck
12
Unlock Deck
Unlock for access to all 60 flashcards in this deck.
Unlock Deck
k this deck
13
Unlock Deck
Unlock for access to all 60 flashcards in this deck.
Unlock Deck
k this deck
14
Unlock Deck
Unlock for access to all 60 flashcards in this deck.
Unlock Deck
k this deck
15
Assume that two samples are independent simple random samples selected from normally distributed populations, and do not assume that the population standard deviations are equal.
Which distribution is used to test the claim that women have a higher mean resting heart rate
Than men?
A) Normal
B) t
C) chi-square
D) F
Which distribution is used to test the claim that women have a higher mean resting heart rate
Than men?
A) Normal
B) t
C) chi-square
D) F
Unlock Deck
Unlock for access to all 60 flashcards in this deck.
Unlock Deck
k this deck
16
Unlock Deck
Unlock for access to all 60 flashcards in this deck.
Unlock Deck
k this deck
17
Unlock Deck
Unlock for access to all 60 flashcards in this deck.
Unlock Deck
k this deck
18
Find sd. Consider the set of differences between two dependent sets: 84, 85, 83, 63, 61, 100, 98. Round to the nearest tenth.
A) 15.3
B) 16.2
C) 15.7
D) 13.1
A) 15.3
B) 16.2
C) 15.7
D) 13.1
Unlock Deck
Unlock for access to all 60 flashcards in this deck.
Unlock Deck
k this deck
19
Unlock Deck
Unlock for access to all 60 flashcards in this deck.
Unlock Deck
k this deck
20
Unlock Deck
Unlock for access to all 60 flashcards in this deck.
Unlock Deck
k this deck
21
A test of abstract reasoning is given to a random sample of students before and after they completed a formal logic course. The results are given below. Construct a 95% confidence
Interval for the mean difference between the before and after scores.
Interval for the mean difference between the before and after scores.
Unlock Deck
Unlock for access to all 60 flashcards in this deck.
Unlock Deck
k this deck
22
Unlock Deck
Unlock for access to all 60 flashcards in this deck.
Unlock Deck
k this deck
23
Construct a confidence interval for μd , paired data. Assume that the population of paired differences is normally distributed. Using
The sample paired data below, construct a 90% confidence interval for the population mean
Of all differences.
The sample paired data below, construct a 90% confidence interval for the population mean
Of all differences.
Unlock Deck
Unlock for access to all 60 flashcards in this deck.
Unlock Deck
k this deck
24
A paint manufacturer made a modification to a paint to speed up its drying time. Independent simple random samples of 11 cans of type A (the original paint)and 9 cans of type B (the
Modified paint)were selected and applied to similar surfaces. The drying times, in hours, were
Recorded. The summary statistics are as follows. What does the confidence interval suggest about the population means?
A) The confidence interval includes only positive values which suggests that the two population means might be equal. There doesn't appear to be a significant difference
Between the mean drying time for paint type A and the mean drying time for paint type B.
The modification does not seem to be effective in reducing drying times.
B) The confidence interval includes 0 which suggests that the two population means might be equal. There doesn't appear to be a significant difference between the mean drying time for
Paint type A and the mean drying time for paint type B. The modification does not seem to
Be effective in reducing drying times.
C) The confidence interval includes only positive values which suggests that the mean drying time for paint type A is smaller than the mean drying time for paint type B. The
Modification does not seem to be effective in reducing drying times.
D) The confidence interval includes only positive values which suggests that the mean drying time for paint type A is greater than the mean drying time for paint type B. The
Modification seems to be effective in reducing drying times.
Modified paint)were selected and applied to similar surfaces. The drying times, in hours, were
Recorded. The summary statistics are as follows.
What does the confidence interval suggest about the population means?A) The confidence interval includes only positive values which suggests that the two population means might be equal. There doesn't appear to be a significant difference
Between the mean drying time for paint type A and the mean drying time for paint type B.
The modification does not seem to be effective in reducing drying times.
B) The confidence interval includes 0 which suggests that the two population means might be equal. There doesn't appear to be a significant difference between the mean drying time for
Paint type A and the mean drying time for paint type B. The modification does not seem to
Be effective in reducing drying times.
C) The confidence interval includes only positive values which suggests that the mean drying time for paint type A is smaller than the mean drying time for paint type B. The
Modification does not seem to be effective in reducing drying times.
D) The confidence interval includes only positive values which suggests that the mean drying time for paint type A is greater than the mean drying time for paint type B. The
Modification seems to be effective in reducing drying times.
Unlock Deck
Unlock for access to all 60 flashcards in this deck.
Unlock Deck
k this deck
25
Unlock Deck
Unlock for access to all 60 flashcards in this deck.
Unlock Deck
k this deck
26
Express the alternative hypothesis in symbolic form. An automobile technician claims that the mean amount of time (in hours)per domestic car repair is more than that of foreign cars.
Assume that two samples are independent. Let the domestic car repair times be the first
Population and the foreign car repair times be the second population.
Assume that two samples are independent. Let the domestic car repair times be the first
Population and the foreign car repair times be the second population.
Unlock Deck
Unlock for access to all 60 flashcards in this deck.
Unlock Deck
k this deck
27
Unlock Deck
Unlock for access to all 60 flashcards in this deck.
Unlock Deck
k this deck
28
Unlock Deck
Unlock for access to all 60 flashcards in this deck.
Unlock Deck
k this deck
29
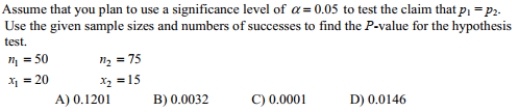
Find the number of successes x suggested by the given statement. A computer manufacturer randomly selects 2680 of its computers for quality assurance and finds that 1.98% of these
Computers are found to be defective.
A) 56
B) 51
C) 58
D) 53
Computers are found to be defective.
A) 56
B) 51
C) 58
D) 53
Unlock Deck
Unlock for access to all 60 flashcards in this deck.
Unlock Deck
k this deck
30
Assume that two samples are independent simple random samples selected from normally distributed populations, and do not assume that the population standard deviations are equal.
Which distribution is used to test the claim that mothers spend more time (in minutes)
Driving their kids to activities than fathers do?
A) Normal
B) t
C) chi-square
D) F
Which distribution is used to test the claim that mothers spend more time (in minutes)
Driving their kids to activities than fathers do?
A) Normal
B) t
C) chi-square
D) F
Unlock Deck
Unlock for access to all 60 flashcards in this deck.
Unlock Deck
k this deck
31
Unlock Deck
Unlock for access to all 60 flashcards in this deck.
Unlock Deck
k this deck
32
Unlock Deck
Unlock for access to all 60 flashcards in this deck.
Unlock Deck
k this deck
33
Unlock Deck
Unlock for access to all 60 flashcards in this deck.
Unlock Deck
k this deck
34
Determine whether the samples are dependent or independent. The effectiveness of a headache medicine is tested by measuring the intensity of a headache in patients before and
After drug treatment. The data consist of before and after intensities for each patient.
A) Dependent samples
B) Independent samples
After drug treatment. The data consist of before and after intensities for each patient.
A) Dependent samples
B) Independent samples
Unlock Deck
Unlock for access to all 60 flashcards in this deck.
Unlock Deck
k this deck
35
Unlock Deck
Unlock for access to all 60 flashcards in this deck.
Unlock Deck
k this deck
36
Unlock Deck
Unlock for access to all 60 flashcards in this deck.
Unlock Deck
k this deck
37
Determine whether the samples are dependent or independent. The effectiveness of a new headache medicine is tested by measuring the amount of time before the headache is cured
For patients who use the medicine and another group of patients who use a placebo drug.
A) Dependent samples
B) Independent samples
For patients who use the medicine and another group of patients who use a placebo drug.
A) Dependent samples
B) Independent samples
Unlock Deck
Unlock for access to all 60 flashcards in this deck.
Unlock Deck
k this deck
38
Which distribution is used to test the claim that the standard deviation of the lengths (in cm)18)___________ of male babies at birth is equal to the standard deviation of the lengths (in cm)of female
Babies at birth?
A) Normal
B) t
C) chi-square
D) F
Babies at birth?
A) Normal
B) t
C) chi-square
D) F
Unlock Deck
Unlock for access to all 60 flashcards in this deck.
Unlock Deck
k this deck
39
Unlock Deck
Unlock for access to all 60 flashcards in this deck.
Unlock Deck
k this deck
40
Unlock Deck
Unlock for access to all 60 flashcards in this deck.
Unlock Deck
k this deck
41
Suppose you wish to test a claim about the mean of the differences from dependent samples or
to construct a confidence interval estimate of the mean of the differences from dependent
samples. What are the requirements?
to construct a confidence interval estimate of the mean of the differences from dependent
samples. What are the requirements?
Unlock Deck
Unlock for access to all 60 flashcards in this deck.
Unlock Deck
k this deck
42
Identify the test statistic that should be used for testing the following given claims.
a. The mean of the differences between IQ scores of brothers and IQ scores of their sisters is
equal to 0.
b. The proportion of offices with windows is equal to the proportion of offices without
windows.
c. The variation among temperature inside buildings in winter is equal to the variation in the
temperature inside building in summer.
d. The mean age of female math professors is equal to the mean age of male math professors.
Unlock Deck
Unlock for access to all 60 flashcards in this deck.
Unlock Deck
k this deck
43
Test the given claim about the means of two populations. Assume that two dependent samples
have been randomly selected from normally distributed populations. A coach uses a new
technique to train gymnasts. 7 gymnasts were randomly selected and their competition scores
were recorded before and after the training. The results are shown below. Using a 0.01 level of significance, test the claim that the training technique is effective in raising
the gymnasts' scores. Include your null and alternative hypotheses, the test statistic, P-value or
critical value(s), conclusion about the null hypothesis, and conclusion about the claim in your
answer.
have been randomly selected from normally distributed populations. A coach uses a new
technique to train gymnasts. 7 gymnasts were randomly selected and their competition scores
were recorded before and after the training. The results are shown below.
Using a 0.01 level of significance, test the claim that the training technique is effective in raisingthe gymnasts' scores. Include your null and alternative hypotheses, the test statistic, P-value or
critical value(s), conclusion about the null hypothesis, and conclusion about the claim in your
answer.
Unlock Deck
Unlock for access to all 60 flashcards in this deck.
Unlock Deck
k this deck
44
Unlock Deck
Unlock for access to all 60 flashcards in this deck.
Unlock Deck
k this deck
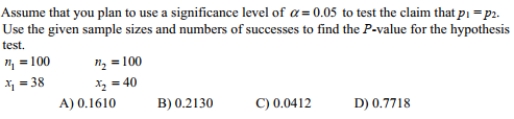
45
Assume
marketing survey involves product recognition in New York and California. Of 558 New
Yorkers surveyed, 193 knew the product while 196 out of 614 Californians knew the product.
At the 0.05 significance level, test the claim that the recognition rates are the same in both
states. Include your null and alternative hypotheses, the test statistic, P-value or critical value(s),
conclusion about the null hypothesis, and conclusion about the claim in your answer.
Unlock Deck
Unlock for access to all 60 flashcards in this deck.
Unlock Deck
k this deck
46
Assume that the two samples are independent simple random samples selected from normally
distributed populations. Do not assume that the population standard deviations are equal. A
researcher wishes to determine whether people can reduce their resting heart rate by following
a particular diet. Construct a 95% confidence interval estimate for the following data. Does
the confidence interval support that the mean resting heart rate for those on the diet is lower
than that of those not on the diet? Explain your reasoning.
distributed populations. Do not assume that the population standard deviations are equal. A
researcher wishes to determine whether people can reduce their resting heart rate by following
a particular diet. Construct a 95% confidence interval estimate for the following data. Does
the confidence interval support that the mean resting heart rate for those on the diet is lower
than that of those not on the diet? Explain your reasoning.
Unlock Deck
Unlock for access to all 60 flashcards in this deck.
Unlock Deck
k this deck
47
Test the indicated claim about the variances or standard deviations of two populations.
that both samples are independent simple random samples from populations having normal
distributions. When 25 randomly selected customers enter any one of several waiting lines,
their waiting times have a standard deviation of 5.35 minutes. When 16 randomly selected
customers enter a single main waiting line, their waiting times have a standard deviation of 2.2
minutes. Use a 0.05 significance level to test the claim that there is more variation in the
waiting times when several lines are used. Include your null and alternative hypotheses, the
test statistic, P-value or critical value(s), conclusion about the null hypothesis, and conclusion
about the claim in your answer.
Unlock Deck
Unlock for access to all 60 flashcards in this deck.
Unlock Deck
k this deck
48
A researcher wishes to determine whether the blood pressure of vegetarians is, on average,
lower than the blood pressure of nonvegetarians. Independent simple random samples of 85
vegetarians and 75 nonvegetarians yielded the following sample statistics for systolic blood
pressure: Use a significance level of 0.01 to test the claim that the mean systolic blood pressure of
vegetarians is lower than the mean systolic blood pressure of nonvegetarians. Include your null
and alternative hypotheses, the test statistic, P-value or critical value(s), conclusion about the
null hypothesis, and conclusion about the claim in your answer.
lower than the blood pressure of nonvegetarians. Independent simple random samples of 85
vegetarians and 75 nonvegetarians yielded the following sample statistics for systolic blood
pressure:
Use a significance level of 0.01 to test the claim that the mean systolic blood pressure ofvegetarians is lower than the mean systolic blood pressure of nonvegetarians. Include your null
and alternative hypotheses, the test statistic, P-value or critical value(s), conclusion about the
null hypothesis, and conclusion about the claim in your answer.
Unlock Deck
Unlock for access to all 60 flashcards in this deck.
Unlock Deck
k this deck
49
Test the given claim about the means of two populations. Assume that two dependent samples
have been randomly selected from normally distributed populations. A test of abstract reasoning
is given to a random sample of students before and after they completed a formal logic course.
The results are given below. At the 0.05 significance level, test the claim that the mean score is
not affected by the course. Include your null and alternative hypotheses, the test statistic, P-value
or critical value(s), conclusion about the null hypothesis, and conclusion about the claim in your
answer.
Unlock Deck
Unlock for access to all 60 flashcards in this deck.
Unlock Deck
k this deck
50
Test the indicated claim about the variances or standard deviations of two populations?
Assume that both samples are independent simple random samples from populations having
normal distributions. A random sample of 16 women resulted in blood pressure levels with a
standard deviation of 23 mm Hg. A random sample of 17 men resulted in blood pressure
levels with a standard deviation of 19.2 mm Hg. Use a 0.05 significance level to test the claim
that blood pressure levels for women vary more than blood pressure levels for men. Include
your null and alternative hypotheses, the test statistic, P-value or critical value(s), conclusion
about the null hypothesis, and conclusion about the claim in your answer.
Unlock Deck
Unlock for access to all 60 flashcards in this deck.
Unlock Deck
k this deck
51
Unlock Deck
Unlock for access to all 60 flashcards in this deck.
Unlock Deck
k this deck
52
A Dean of Students conducted a survey to test the claim that women spend more time visiting
the STEM lab than men do. A survey was administered to a simple random sample of 15
female student volunteers and 12 male volunteers that asked, "How many minutes have you
spent in the STEM lab this semester?" The results are shown below. Test the claim at the 1% level of significance. Assume that the number of minutes that
women and men spent in the STEM lab is normally distributed. Do not assume that the
population standard deviations are equal. Include your null and alternative hypotheses, the
test statistic, P-value or critical value(s), conclusion about the null hypothesis, and conclusion
about the claim in your answer.
the STEM lab than men do. A survey was administered to a simple random sample of 15
female student volunteers and 12 male volunteers that asked, "How many minutes have you
spent in the STEM lab this semester?" The results are shown below.
Test the claim at the 1% level of significance. Assume that the number of minutes thatwomen and men spent in the STEM lab is normally distributed. Do not assume that the
population standard deviations are equal. Include your null and alternative hypotheses, the
test statistic, P-value or critical value(s), conclusion about the null hypothesis, and conclusion
about the claim in your answer.
Unlock Deck
Unlock for access to all 60 flashcards in this deck.
Unlock Deck
k this deck
53
Test the indicated claim about the means of two populations. Assume that the two samples are
independent simple random samples selected from normally distributed populations. Do not
assume that the population standard deviations are equal. A researcher wishes to determine
whether people with high blood pressure can reduce their blood pressure, measured in mm Hg,
by following a particular diet. Use a significance level of 0.01 to test the claim that the treatment
group is from a population with a smaller mean than the control group. Include your null and
alternative hypotheses, the test statistic, P-value or critical value(s), conclusion about the null
hypothesis, and conclusion about the claim in your answer.
Unlock Deck
Unlock for access to all 60 flashcards in this deck.
Unlock Deck
k this deck
54
Test the given claim about the means of two populations. Assume that two dependent samples
have been randomly selected from normally distributed populations. Using a 0.01 level of significance, test the claim that the tutoring has an effect on the math
scores. Include your null and alternative hypotheses, the test statistic, P-value or critical
value(s), conclusion about the null hypothesis, and conclusion about the claim in your answer.
have been randomly selected from normally distributed populations.
Using a 0.01 level of significance, test the claim that the tutoring has an effect on the mathscores. Include your null and alternative hypotheses, the test statistic, P-value or critical
value(s), conclusion about the null hypothesis, and conclusion about the claim in your answer.
Unlock Deck
Unlock for access to all 60 flashcards in this deck.
Unlock Deck
k this deck
55
Test the indicated claim about the means of two populations. Assume that the two samples are
independent simple random samples selected from normally distributed populations. Do not
assume that the population standard deviations are equal. Use a 0.10 significance level to test the claim that the mean GPA of students at college A is
different from the mean GPA of students at college B. Include your null and alternative
hypotheses, the test statistic, p-value or critical value(s), conclusion about the null hypothesis,
and conclusion about the claim in your answer.
independent simple random samples selected from normally distributed populations. Do not
assume that the population standard deviations are equal.
Use a 0.10 significance level to test the claim that the mean GPA of students at college A isdifferent from the mean GPA of students at college B.
Include your null and alternativehypotheses, the test statistic, p-value or critical value(s), conclusion about the null hypothesis,
and conclusion about the claim in your answer.
Unlock Deck
Unlock for access to all 60 flashcards in this deck.
Unlock Deck
k this deck
56
Test the indicated claim about the means of two populations. Assume that the two samples are
independent simple random samples selected from normally distributed populations. Do not
assume that the population standard deviations are equal. Use a 0.05 significance level to test the claim that the mean amount of time spent watching
television by women is smaller than the mean amount of time spent watching television by
men. Include your null and alternative hypotheses, the test statistic, P-value or critical value(s),
conclusion about the null hypothesis, and conclusion about the claim in your answer.
independent simple random samples selected from normally distributed populations. Do not
assume that the population standard deviations are equal.
Use a 0.05 significance level to test the claim that the mean amount of time spent watchingtelevision by women is smaller than the mean amount of time spent watching television by
men. Include your null and alternative hypotheses, the test statistic, P-value or critical value(s),
conclusion about the null hypothesis, and conclusion about the claim in your answer.
Unlock Deck
Unlock for access to all 60 flashcards in this deck.
Unlock Deck
k this deck
57
When testing for a difference between the means of a treatment group and a placebo group, the
computer display below is obtained. Using a 0.05 significance level, is there sufficient evidence
to support the claim that the treatment group (variable 1)comes from a population with a mean
that is less than the mean for the placebo population? Explain.
computer display below is obtained. Using a 0.05 significance level, is there sufficient evidence
to support the claim that the treatment group (variable 1)comes from a population with a mean
that is less than the mean for the placebo population? Explain.
Unlock Deck
Unlock for access to all 60 flashcards in this deck.
Unlock Deck
k this deck
58
To test the null hypothesis that the difference between two population proportions is
equal to a nonzero constant c, use the test statistic
equal to a nonzero constant c, use the test statistic
Unlock Deck
Unlock for access to all 60 flashcards in this deck.
Unlock Deck
k this deck
59
Unlock Deck
Unlock for access to all 60 flashcards in this deck.
Unlock Deck
k this deck
60
A researcher wishes to compare how students at two different schools perform on a math test?
He randomly selects 40 students from each school and obtains their test scores. He pairs the
first score from school A with the first school from school B, the second score from school A
with the second school from school B and so on. He then performs a hypothesis test for
matched pairs. Is this approach valid? Why or why not? If it is not valid, how should the
researcher have proceeded?
Unlock Deck
Unlock for access to all 60 flashcards in this deck.
Unlock Deck
k this deck
Unlock Deck
Unlock for access to all 60 flashcards in this deck.


