Deck 8: Sampling Distributions
Full screen (f)
Question
Provide an appropriate response.

Question
Describe the Distribution of the Sample Mean-Samples from a Population That Is Not Normal
Question
Provide an appropriate response.

Question
Describe the Distribution of the Sample Mean-Samples from a Population That Is Not Normal
Question
Describe the Distribution of the Sample Mean-Samples from a Population That Is Not Normal
Question
Provide an appropriate response.
Question
Provide an appropriate response.

Question
Describe the Distribution of the Sample Mean-Samples from a Population That Is Not Normal
Question
Provide an appropriate response.
Question
Describe the Distribution of the Sample Mean-Samples from a Population That Is Not Normal
Question
Provide an appropriate response.
Question
Provide an appropriate response.
Question
Provide an appropriate response.
Question
Provide an appropriate response.

Question
Provide an appropriate response.

Question
Describe the Distribution of the Sample Mean-Samples from a Population That Is Not Normal
Question
Provide an appropriate response.
Question
Provide an appropriate response.

Question
Question
Question
Describe the Sampling Distribution of a Sample Proportion
Question
Describe the Sampling Distribution of a Sample Proportion
Question
Describe the Distribution of the Sample Mean-Samples from a Population That Is Not Normal

Question
Describe the Sampling Distribution of a Sample Proportion
Question
Question
Describe the Sampling Distribution of a Sample Proportion
Question
Question
Question
Describe the Sampling Distribution of a Sample Proportion
Question
Compute Probabilities of a Sample Proportion
Question
Compute Probabilities of a Sample Proportion
Question
Question
Describe the Distribution of the Sample Mean-Samples from a Population That Is Not Normal

Question
Describe the Sampling Distribution of a Sample Proportion
Question
Describe the Sampling Distribution of a Sample Proportion
Question
Describe the Sampling Distribution of a Sample Proportion
Question
Question
Describe the Sampling Distribution of a Sample Proportion
Question
Describe the Sampling Distribution of a Sample Proportion
Question
Describe the Sampling Distribution of a Sample Proportion

Question
Compute Probabilities of a Sample Proportion
Question
Question
Compute Probabilities of a Sample Proportion
Question
Compute Probabilities of a Sample Proportion
Question
Question
Compute Probabilities of a Sample Proportion

Unlock Deck
Sign up to unlock the cards in this deck!
Unlock Deck
Unlock Deck
1/46
Play
Full screen (f)
Deck 8: Sampling Distributions
1
Provide an appropriate response.
A
2
Describe the Distribution of the Sample Mean-Samples from a Population That Is Not Normal
A
3
Provide an appropriate response.

4
Describe the Distribution of the Sample Mean-Samples from a Population That Is Not Normal
Unlock Deck
Unlock for access to all 46 flashcards in this deck.
Unlock Deck
k this deck
5
Describe the Distribution of the Sample Mean-Samples from a Population That Is Not Normal
Unlock Deck
Unlock for access to all 46 flashcards in this deck.
Unlock Deck
k this deck
6
Provide an appropriate response.
Unlock Deck
Unlock for access to all 46 flashcards in this deck.
Unlock Deck
k this deck
7
Provide an appropriate response.
Unlock Deck
Unlock for access to all 46 flashcards in this deck.
Unlock Deck
k this deck
8
Describe the Distribution of the Sample Mean-Samples from a Population That Is Not Normal
Unlock Deck
Unlock for access to all 46 flashcards in this deck.
Unlock Deck
k this deck
9
Provide an appropriate response.
Unlock Deck
Unlock for access to all 46 flashcards in this deck.
Unlock Deck
k this deck
10
Describe the Distribution of the Sample Mean-Samples from a Population That Is Not Normal
Unlock Deck
Unlock for access to all 46 flashcards in this deck.
Unlock Deck
k this deck
11
Provide an appropriate response.
Unlock Deck
Unlock for access to all 46 flashcards in this deck.
Unlock Deck
k this deck
12
Provide an appropriate response.
Unlock Deck
Unlock for access to all 46 flashcards in this deck.
Unlock Deck
k this deck
13
Provide an appropriate response.
Unlock Deck
Unlock for access to all 46 flashcards in this deck.
Unlock Deck
k this deck
14
Provide an appropriate response.
Unlock Deck
Unlock for access to all 46 flashcards in this deck.
Unlock Deck
k this deck
15
Provide an appropriate response.
Unlock Deck
Unlock for access to all 46 flashcards in this deck.
Unlock Deck
k this deck
16
Describe the Distribution of the Sample Mean-Samples from a Population That Is Not Normal
Unlock Deck
Unlock for access to all 46 flashcards in this deck.
Unlock Deck
k this deck
17
Provide an appropriate response.
Unlock Deck
Unlock for access to all 46 flashcards in this deck.
Unlock Deck
k this deck
18
Provide an appropriate response.
Unlock Deck
Unlock for access to all 46 flashcards in this deck.
Unlock Deck
k this deck
19
Provide an appropriate response.
The number of violent crimes committed in a day possesses a distribution with a mean of 3.8 crimes per day and a standard deviation of 2 crimes per day. A random sample of 100 days was observed, and the mean number of crimes for the sample was calculated. Describe the sampling distribution of the sample mean.
A) approximately normal with mean = 3.8 and standard deviation = 0.2
B) approximately normal with mean = 3.8 and standard deviation = 2
C) shape unknown with mean = 3.8 and standard deviation = 2
D) shape unknown with mean = 3.8 and standard deviation = 0.2
Unlock Deck
Unlock for access to all 46 flashcards in this deck.
Unlock Deck
k this deck
20
Provide an appropriate response.
The amount of money collected by a snack bar at a large university has been recorded daily for the past five years. Records indicate that the mean daily amount collected is $1950 and the standard deviation is $500. The distribution is skewed to the right due to several high volume days (including football game days). Suppose that 100 days were randomly selected from the five years and the average amount collected from those days was recorded. Which of the following describes the sampling distribution of the sample mean
A) normally distributed with a mean of $1950 and a standard deviation of $50
B) normally distributed with a mean of $1950 and a standard deviation of $500
C) normally distributed with a mean of $195 and a standard deviation of $50
D) skewed to the right with a mean of $1950 and a standard deviation of $500
Unlock Deck
Unlock for access to all 46 flashcards in this deck.
Unlock Deck
k this deck
21
Describe the Sampling Distribution of a Sample Proportion
Unlock Deck
Unlock for access to all 46 flashcards in this deck.
Unlock Deck
k this deck
22
Describe the Sampling Distribution of a Sample Proportion
Unlock Deck
Unlock for access to all 46 flashcards in this deck.
Unlock Deck
k this deck
23
Describe the Distribution of the Sample Mean-Samples from a Population That Is Not Normal
Unlock Deck
Unlock for access to all 46 flashcards in this deck.
Unlock Deck
k this deck
24
Describe the Sampling Distribution of a Sample Proportion
Unlock Deck
Unlock for access to all 46 flashcards in this deck.
Unlock Deck
k this deck
25
Describe the Distribution of the Sample Mean-Samples from a Population That Is Not Normal
John has six bills of paper money in the following denominations: $1, $5, $10, $20, $50, and $100 If he selects 3 bills at a time what is the probability of selecting a group that has an average value of at least $26
A) 0.55
B) 0.50
C) 0.60
D) 0.45
John has six bills of paper money in the following denominations: $1, $5, $10, $20, $50, and $100 If he selects 3 bills at a time what is the probability of selecting a group that has an average value of at least $26
A) 0.55
B) 0.50
C) 0.60
D) 0.45
Unlock Deck
Unlock for access to all 46 flashcards in this deck.
Unlock Deck
k this deck
26
Describe the Sampling Distribution of a Sample Proportion
Unlock Deck
Unlock for access to all 46 flashcards in this deck.
Unlock Deck
k this deck
27
Describe the Distribution of the Sample Mean-Samples from a Population That Is Not Normal
The ages of five randomly chosen cars in a parking garage are determined to be 7, 9, 3, 4, and 6 years old. If we consider this sample of 5 in groups of 3, what is the probability of the population mean falling between 5.5 and 6.5 years
A) 0.5
B) 0.4
C) 0.55
D) 0.6
The ages of five randomly chosen cars in a parking garage are determined to be 7, 9, 3, 4, and 6 years old. If we consider this sample of 5 in groups of 3, what is the probability of the population mean falling between 5.5 and 6.5 years
A) 0.5
B) 0.4
C) 0.55
D) 0.6
Unlock Deck
Unlock for access to all 46 flashcards in this deck.
Unlock Deck
k this deck
28
Describe the Distribution of the Sample Mean-Samples from a Population That Is Not Normal
John has six bills of paper money in the following denominations: $1, $5, $10, $20, $50, and $100 If he selects 3 bills at a time what is the probability of selecting a group that has an average value of between $40 and $45
A) 0.15
B) 0.05
C) 0.25
D) 0.20
John has six bills of paper money in the following denominations: $1, $5, $10, $20, $50, and $100 If he selects 3 bills at a time what is the probability of selecting a group that has an average value of between $40 and $45
A) 0.15
B) 0.05
C) 0.25
D) 0.20
Unlock Deck
Unlock for access to all 46 flashcards in this deck.
Unlock Deck
k this deck
29
Describe the Sampling Distribution of a Sample Proportion
Unlock Deck
Unlock for access to all 46 flashcards in this deck.
Unlock Deck
k this deck
30
Compute Probabilities of a Sample Proportion
Unlock Deck
Unlock for access to all 46 flashcards in this deck.
Unlock Deck
k this deck
31
Compute Probabilities of a Sample Proportion
Unlock Deck
Unlock for access to all 46 flashcards in this deck.
Unlock Deck
k this deck
32
Describe the Distribution of the Sample Mean-Samples from a Population That Is Not Normal
John has six bills of paper money in the following denominations: $1, $5, $10, $20, $50, and $100 If he selects 3 bills at a time what is the probability of selecting a group that has an average value of equal to or less than $25
A) 0.45
B) 0.86
C) 0.50
D) 0.35
John has six bills of paper money in the following denominations: $1, $5, $10, $20, $50, and $100 If he selects 3 bills at a time what is the probability of selecting a group that has an average value of equal to or less than $25
A) 0.45
B) 0.86
C) 0.50
D) 0.35
Unlock Deck
Unlock for access to all 46 flashcards in this deck.
Unlock Deck
k this deck
33
Describe the Distribution of the Sample Mean-Samples from a Population That Is Not Normal
Unlock Deck
Unlock for access to all 46 flashcards in this deck.
Unlock Deck
k this deck
34
Describe the Sampling Distribution of a Sample Proportion
Unlock Deck
Unlock for access to all 46 flashcards in this deck.
Unlock Deck
k this deck
35
Describe the Sampling Distribution of a Sample Proportion
Unlock Deck
Unlock for access to all 46 flashcards in this deck.
Unlock Deck
k this deck
36
Describe the Sampling Distribution of a Sample Proportion
Unlock Deck
Unlock for access to all 46 flashcards in this deck.
Unlock Deck
k this deck
37
Describe the Distribution of the Sample Mean-Samples from a Population That Is Not Normal
The ages of five randomly chosen cars in a parking garage are determined to be 7, 9, 3, 4, and 6 years old. If we consider this sample of 5 in groups of 3, what is the probability of the population mean being more than 6 years
A) 0.4
B) 0.5
C) 0.1
D) 0.6
The ages of five randomly chosen cars in a parking garage are determined to be 7, 9, 3, 4, and 6 years old. If we consider this sample of 5 in groups of 3, what is the probability of the population mean being more than 6 years
A) 0.4
B) 0.5
C) 0.1
D) 0.6
Unlock Deck
Unlock for access to all 46 flashcards in this deck.
Unlock Deck
k this deck
38
Describe the Sampling Distribution of a Sample Proportion
Unlock Deck
Unlock for access to all 46 flashcards in this deck.
Unlock Deck
k this deck
39
Describe the Sampling Distribution of a Sample Proportion
Unlock Deck
Unlock for access to all 46 flashcards in this deck.
Unlock Deck
k this deck
40
Describe the Sampling Distribution of a Sample Proportion
Unlock Deck
Unlock for access to all 46 flashcards in this deck.
Unlock Deck
k this deck
41
Compute Probabilities of a Sample Proportion
Unlock Deck
Unlock for access to all 46 flashcards in this deck.
Unlock Deck
k this deck
42
Compute Probabilities of a Sample Proportion
The National Association of Realtors estimates that 23% of all homes purchased in 2004 were considered investment properties. If a sample of 800 homes sold in 2004 is obtained and it was noted that 248 homes were to be used as investment property, would this be unusual Answer Yes or No.
A) Yes
B) No
Unlock Deck
Unlock for access to all 46 flashcards in this deck.
Unlock Deck
k this deck
43
Compute Probabilities of a Sample Proportion
Unlock Deck
Unlock for access to all 46 flashcards in this deck.
Unlock Deck
k this deck
44
Compute Probabilities of a Sample Proportion
Unlock Deck
Unlock for access to all 46 flashcards in this deck.
Unlock Deck
k this deck
45
Compute Probabilities of a Sample Proportion
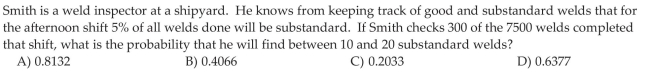
The National Association of Realtors estimates that 23% of all homes purchased in 2004 were considered investment properties. If a sample of 800 homes sold in 2004 is obtained what is the probability that between 175 and 200 homes are going to be used as investment property
A) 0.1335
B) 0.9099
C) 0.7764
D) 0.2236
Unlock Deck
Unlock for access to all 46 flashcards in this deck.
Unlock Deck
k this deck
46
Compute Probabilities of a Sample Proportion
Unlock Deck
Unlock for access to all 46 flashcards in this deck.
Unlock Deck
k this deck
Unlock Deck
Unlock for access to all 46 flashcards in this deck.


