Deck 3: Describing Data Using Numerical Measures
Full screen (f)
Question
Suppose a study of houses that have sold recently in your community showed the following frequency distribution for the number of bedrooms: 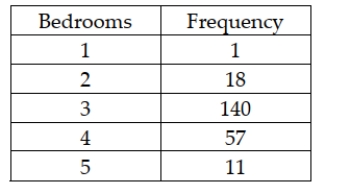 Based on this information the mean number of bedrooms in houses that sold is approximately 3.26.
Based on this information the mean number of bedrooms in houses that sold is approximately 3.26. Question
Question
You are given the following data: 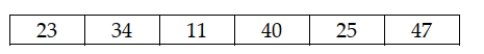 Assuming that the data reflect a sample from a larger population, the sample mean is 30.00.
Assuming that the data reflect a sample from a larger population, the sample mean is 30.00. Question
Question
Question
Question
You are given the following data:  Assuming that the data reflect the population of interest, the mean of the population is 36.00.
Assuming that the data reflect the population of interest, the mean of the population is 36.00. Question
You are given the following data: 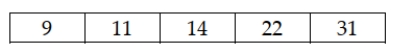 Assuming that these data reflect the population of interest, these data can be considered symmetric.
Assuming that these data reflect the population of interest, these data can be considered symmetric. Question
Question
Question
Question
Question
Question
Question
Question
Suppose a study of houses that have sold recently in your community showed the following frequency distribution for the number of bedrooms: 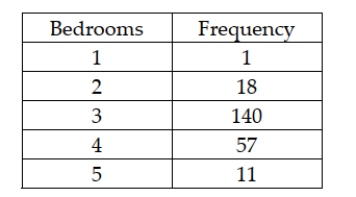 Based on this information, the mode for the data is 140.
Based on this information, the mode for the data is 140. Question
You are given the following data:  Assuming that these data are a sample selected from a larger population, the median value for these sample data is 25.5.
Assuming that these data are a sample selected from a larger population, the median value for these sample data is 25.5. Question
Question
You are given the following data: 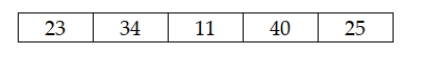 If these data were considered to be a population and you computed the mean, you would get the same answer as if these data were considered to be a sample from a larger population.
If these data were considered to be a population and you computed the mean, you would get the same answer as if these data were considered to be a sample from a larger population. Question
Question
Question
Question
Question
Question
Question
Question
Question
Question
Question
Question
Question
Question
Suppose a study of houses that have sold recently in your community showed the following frequency distribution for the number of bedrooms: 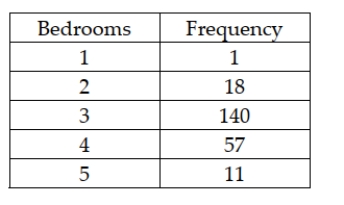 Based on this information, it is possible to determine that the distribution of bedrooms in homes sold is right-skewed.
Based on this information, it is possible to determine that the distribution of bedrooms in homes sold is right-skewed. Question
Question
Question
Suppose a study of houses that have sold recently in your community showed the following frequency distribution for the number of bedrooms:  Based on this information, the median number of bedrooms in houses sold is 3.20.
Based on this information, the median number of bedrooms in houses sold is 3.20. Question
Question
Question
Question
Question
A store manager tracks the number of customer complaints each week. The following data reflect a random sample of ten weeks.  The variance for these data is approximately 27.78.
The variance for these data is approximately 27.78. Question
Question
Question
Question
Question
Question
Question
The Good-Guys Car Dealership has tracked the number of used cars sold at its downtown dealership.Consider the following data as representing the population of cars sold in each of the 8 weeks that the dealership has been open.  The population standard deviation is approximately 2.87 cars.
The population standard deviation is approximately 2.87 cars. Question
Question
The Good-Guys Car Dealership has tracked the number of used cars sold at its downtown dealership.Consider the following data as representing the population of cars sold in each of the 8 weeks that the dealership has been open.  The population variance is approximately 9.43.
The population variance is approximately 9.43. Question
Question
Question
Question
A store manager tracks the number of customer complaints each week. The following data reflect a random sample of ten weeks.  The standard deviation for these data is approximately 27.78.
The standard deviation for these data is approximately 27.78. Question
The Good-Guys Car Dealership has tracked the number of used cars sold at its downtown dealership.Consider the following data as representing the population of cars sold in each of the 8 weeks that the dealership has been open.  The population range is 9.
The population range is 9. Question
Question
Question
Question
Question
A store manager tracks the number of customer complaints each week. The following data reflect a random sample of ten weeks.  The range for these data is 8.
The range for these data is 8. Question
Question
Question
Question
Question
Question
Question
Question
Question
Consider the following sample data:  For these data the sample mean is:
A) 8
B) 10
C) 3
D) 12
For these data the sample mean is:A) 8
B) 10
C) 3
D) 12
Question
Question
Question
A small company has 7 employees. The numbers of years these employees have worked for this company are shown as follows:  Based upon this information, the median number of years that employees have been with this company is:
A) 9 years.
B) 16 years.
C) 10 years.
D) 14 years.
Based upon this information, the median number of years that employees have been with this company is:A) 9 years.
B) 16 years.
C) 10 years.
D) 14 years.
Question
A small company has 7 employees. The numbers of years these employees have worked for this company are shown as follows:  Based upon this information, the mode number of years that employees have been with this company is:
A) 16
B) 2
C) 9
D) 10
Based upon this information, the mode number of years that employees have been with this company is:A) 16
B) 2
C) 9
D) 10
Question
Question
Question
Question
Consider the following sample data:  For these data the median is:
A) 7.5
B) 3.5
C) 10
D) None of the above
For these data the median is:A) 7.5
B) 3.5
C) 10
D) None of the above
Question
Question
A small company has 7 employees. The numbers of years these employees have worked for this company are shown as follows:  Based upon this information, the mean number of years that employees have been with this company is:
A) 16
B) x
C) 8.40
D) 10
Based upon this information, the mean number of years that employees have been with this company is:A) 16
B) x
C) 8.40
D) 10
Question

Unlock Deck
Sign up to unlock the cards in this deck!
Unlock Deck
Unlock Deck
1/138
Play
Full screen (f)
Deck 3: Describing Data Using Numerical Measures
1
Suppose a study of houses that have sold recently in your community showed the following frequency distribution for the number of bedrooms: Based on this information the mean number of bedrooms in houses that sold is approximately 3.26.
Based on this information the mean number of bedrooms in houses that sold is approximately 3.26.True
2
The sample mean is an estimate of μ and may be either higher or lower than μ depending on the sample.
True
3
You are given the following data: Assuming that the data reflect a sample from a larger population, the sample mean is 30.00.
Assuming that the data reflect a sample from a larger population, the sample mean is 30.00.True
4
One of the primary advantages of using the median as a measure of the center for a set of data is that the median is not affected by extreme values in the data.
Unlock Deck
Unlock for access to all 138 flashcards in this deck.
Unlock Deck
k this deck
5
A distribution is said to be symmetric when the sample mean and the population mean are equal.
Unlock Deck
Unlock for access to all 138 flashcards in this deck.
Unlock Deck
k this deck
6
The symbol μ is used to represent the sample mean.
Unlock Deck
Unlock for access to all 138 flashcards in this deck.
Unlock Deck
k this deck
7
You are given the following data: Assuming that the data reflect the population of interest, the mean of the population is 36.00.
Assuming that the data reflect the population of interest, the mean of the population is 36.00. Unlock Deck
Unlock for access to all 138 flashcards in this deck.
Unlock Deck
k this deck
8
You are given the following data: Assuming that these data reflect the population of interest, these data can be considered symmetric.
Assuming that these data reflect the population of interest, these data can be considered symmetric. Unlock Deck
Unlock for access to all 138 flashcards in this deck.
Unlock Deck
k this deck
9
Data are considered to be right-skewed when the mean lies to the right of the median.
Unlock Deck
Unlock for access to all 138 flashcards in this deck.
Unlock Deck
k this deck
10
A statistic is a value that describes a population characteristic while a parameter is computed from a sample.
Unlock Deck
Unlock for access to all 138 flashcards in this deck.
Unlock Deck
k this deck
11
If after graphing the data for a quantitative variable of interest, you notice that the distribution is highly skewed in the positive direction, the measure of central location that would likely provide the best assessment of the center would be the median.
Unlock Deck
Unlock for access to all 138 flashcards in this deck.
Unlock Deck
k this deck
12
A marketing manager for the Verizon cell phone company selected a random sample of 250 customers from the list of 10,556 total customers in a particular region. The mean monthly bill for the last six months based on the sample data is $65.70. The manager should realize that the mean bill for all 10,556 customers will actually be much higher than the sample mean of $65.70.
Unlock Deck
Unlock for access to all 138 flashcards in this deck.
Unlock Deck
k this deck
13
A lakeside neighborhood in Washington is home to a couple of successful baseball and football players in Seattle. If news articles usually report the median household income in that neighborhood rather than the mean income, this would be because income is a left-skewed distribution.
Unlock Deck
Unlock for access to all 138 flashcards in this deck.
Unlock Deck
k this deck
14
The Parks and Recreation manager for the city of Detroit recently submitted a report to the city council in which he indicated that a random sample of 500 park users indicated that the average number of visits per month was 4.56. This value should be viewed as a statistic by the city council.
Unlock Deck
Unlock for access to all 138 flashcards in this deck.
Unlock Deck
k this deck
15
In a recent study of the sales prices of houses in a Midwestern city, the mean sales price has been reported to be $167,811 while the median sales price was $155,600. From this information, you can determine that the data involved in the study are left-skewed.
Unlock Deck
Unlock for access to all 138 flashcards in this deck.
Unlock Deck
k this deck
16
Suppose a study of houses that have sold recently in your community showed the following frequency distribution for the number of bedrooms: Based on this information, the mode for the data is 140.
Based on this information, the mode for the data is 140. Unlock Deck
Unlock for access to all 138 flashcards in this deck.
Unlock Deck
k this deck
17
You are given the following data: Assuming that these data are a sample selected from a larger population, the median value for these sample data is 25.5.
Assuming that these data are a sample selected from a larger population, the median value for these sample data is 25.5. Unlock Deck
Unlock for access to all 138 flashcards in this deck.
Unlock Deck
k this deck
18
A statistic is just another name for a parameter.
Unlock Deck
Unlock for access to all 138 flashcards in this deck.
Unlock Deck
k this deck
19
You are given the following data: If these data were considered to be a population and you computed the mean, you would get the same answer as if these data were considered to be a sample from a larger population.
If these data were considered to be a population and you computed the mean, you would get the same answer as if these data were considered to be a sample from a larger population. Unlock Deck
Unlock for access to all 138 flashcards in this deck.
Unlock Deck
k this deck
20
The owner of a local gasoline station has kept track of the number of gallons of regular unleaded sold at his station every day since he purchased the station. This morning, he computed the mean number of gallons. This value would be considered a statistic.
Unlock Deck
Unlock for access to all 138 flashcards in this deck.
Unlock Deck
k this deck
21
First Pacific Bank has determined that the mean checking account balance for all its customers is currently $743.50. Based on this, it is fair to say that about half the customers have balances exceeding $743.50.
Unlock Deck
Unlock for access to all 138 flashcards in this deck.
Unlock Deck
k this deck
22
For a symmetric distribution, if the median value is 150 and the second quartile is 40, the fourth quartile must also be 40.
Unlock Deck
Unlock for access to all 138 flashcards in this deck.
Unlock Deck
k this deck
23
Recently an article in a newspaper stated that 75 percent of the households in the state had incomes of $20,200 or below. Given this input, it is certain that mean household income is less than $20,200.
Unlock Deck
Unlock for access to all 138 flashcards in this deck.
Unlock Deck
k this deck
24
When surveyed, a sample of 1,250 patients at a regional hospital provided interviewers with the following summary statistics pertaining to the hospital charges: Minimum = $278.00 Q1 = $1,245 Q2 = $3,567 Q3= $4,702. Based on these data, if you were to construct a box and whisker plot, the value corresponding to the right-hand edge of the box would be $4,702.
Unlock Deck
Unlock for access to all 138 flashcards in this deck.
Unlock Deck
k this deck
25
The right and left edges of the box in a box and whisker plot represent the 3rd and 1st quartiles, respectively.
Unlock Deck
Unlock for access to all 138 flashcards in this deck.
Unlock Deck
k this deck
26
A recent study involving a sample of 3,000 vehicles in California showed the following statistics related to the number of miles driven per day: Q1 = 12, Q2 = 45, and Q3 = 56. Based on these data, if a box and whisker plot is developed, a value of 110 is an outlier.
Unlock Deck
Unlock for access to all 138 flashcards in this deck.
Unlock Deck
k this deck
27
When analyzing annual incomes of adults in a market area, the marketing manager's report indicated that the 90th percentile is $123,400. That means that 90 percent of the adult incomes in the market area fall at or below $123,400.
Unlock Deck
Unlock for access to all 138 flashcards in this deck.
Unlock Deck
k this deck
28
In drawing a box and whisker plot the upper limit length of the whiskers is 1.5(Q3-Q1).
Unlock Deck
Unlock for access to all 138 flashcards in this deck.
Unlock Deck
k this deck
29
The second quartile for a set of data will have the same value as the 50th percentile only when the data are symmetric.
Unlock Deck
Unlock for access to all 138 flashcards in this deck.
Unlock Deck
k this deck
30
If a set of data has 1,500 values, the 30th percentile value will correspond to the 450th value in the data when the data have been arranged in numerical order.
Unlock Deck
Unlock for access to all 138 flashcards in this deck.
Unlock Deck
k this deck
31
A set of data is considered to be symmetric if the 3rd quartile is three times larger than the 1st quartile.
Unlock Deck
Unlock for access to all 138 flashcards in this deck.
Unlock Deck
k this deck
32
It is possible for a set of data to have multiple modes as well as multiple medians, but there can be only one mean.
Unlock Deck
Unlock for access to all 138 flashcards in this deck.
Unlock Deck
k this deck
33
Suppose a study of houses that have sold recently in your community showed the following frequency distribution for the number of bedrooms: Based on this information, it is possible to determine that the distribution of bedrooms in homes sold is right-skewed.
Based on this information, it is possible to determine that the distribution of bedrooms in homes sold is right-skewed. Unlock Deck
Unlock for access to all 138 flashcards in this deck.
Unlock Deck
k this deck
34
A box and whisker plot shows where the mean value falls relative to the median for a variable.
Unlock Deck
Unlock for access to all 138 flashcards in this deck.
Unlock Deck
k this deck
35
If a set of data has 540 values, the 3rd quartile corresponds to approximately the 135th value when the data have been arranged in numerical order.
Unlock Deck
Unlock for access to all 138 flashcards in this deck.
Unlock Deck
k this deck
36
Suppose a study of houses that have sold recently in your community showed the following frequency distribution for the number of bedrooms: Based on this information, the median number of bedrooms in houses sold is 3.20.
Based on this information, the median number of bedrooms in houses sold is 3.20. Unlock Deck
Unlock for access to all 138 flashcards in this deck.
Unlock Deck
k this deck
37
A recent study involving a sample of 3,000 vehicles in California showed the following statistics related to the number of miles driven per day: Q1 = 12, Q2 = 45, and Q3 = 56. Based on these data, we know that the distribution is skewed.
Unlock Deck
Unlock for access to all 138 flashcards in this deck.
Unlock Deck
k this deck
38
When the median of a data set is 110 and the mean is 127, the percentile associated with the mean must be higher than 50 percent.
Unlock Deck
Unlock for access to all 138 flashcards in this deck.
Unlock Deck
k this deck
39
A data set in which the mean, median, and mode are all equal is said to be a skewed distribution.
Unlock Deck
Unlock for access to all 138 flashcards in this deck.
Unlock Deck
k this deck
40
A recent study involving a sample of 3,000 vehicles in California showed the following statistics related to the number of miles driven per day: Q1 = 12, Q2 = 45, and Q3 = 56. Based on these data, if a box and whisker plot is developed, the upper limit value is 122 miles.
Unlock Deck
Unlock for access to all 138 flashcards in this deck.
Unlock Deck
k this deck
41
A store manager tracks the number of customer complaints each week. The following data reflect a random sample of ten weeks. The variance for these data is approximately 27.78.
The variance for these data is approximately 27.78. Unlock Deck
Unlock for access to all 138 flashcards in this deck.
Unlock Deck
k this deck
42
The interquartile range contains the middle 50 percent of a data set.
Unlock Deck
Unlock for access to all 138 flashcards in this deck.
Unlock Deck
k this deck
43
Populations with larger means will also have larger standard deviations since the data will be more spread out for populations with larger means.
Unlock Deck
Unlock for access to all 138 flashcards in this deck.
Unlock Deck
k this deck
44
The interquartile range is the difference between the mean and the median.
Unlock Deck
Unlock for access to all 138 flashcards in this deck.
Unlock Deck
k this deck
45
If a population standard deviation is computed to be 345, it will almost always be the case that a standard deviation computed from a random sample from that population will be larger than 345.
Unlock Deck
Unlock for access to all 138 flashcards in this deck.
Unlock Deck
k this deck
46
The advantage of using the interquartile range as a measure of variation is that it utilizes all the data in its computation.
Unlock Deck
Unlock for access to all 138 flashcards in this deck.
Unlock Deck
k this deck
47
Suppose the standard deviation for a given sample is known to be 20. If the data in the sample are doubled, the standard deviation will be significantly greater.
Unlock Deck
Unlock for access to all 138 flashcards in this deck.
Unlock Deck
k this deck
48
The Good-Guys Car Dealership has tracked the number of used cars sold at its downtown dealership.Consider the following data as representing the population of cars sold in each of the 8 weeks that the dealership has been open. The population standard deviation is approximately 2.87 cars.
The population standard deviation is approximately 2.87 cars. Unlock Deck
Unlock for access to all 138 flashcards in this deck.
Unlock Deck
k this deck
49
The range is an ideal measure of variation since it is not sensitive to extreme values in the data.
Unlock Deck
Unlock for access to all 138 flashcards in this deck.
Unlock Deck
k this deck
50
The Good-Guys Car Dealership has tracked the number of used cars sold at its downtown dealership.Consider the following data as representing the population of cars sold in each of the 8 weeks that the dealership has been open. The population variance is approximately 9.43.
The population variance is approximately 9.43. Unlock Deck
Unlock for access to all 138 flashcards in this deck.
Unlock Deck
k this deck
51
In comparing two distributions with the same mean, the coefficient of variation is the only way to assess which distribution has the greatest relative variability.
Unlock Deck
Unlock for access to all 138 flashcards in this deck.
Unlock Deck
k this deck
52
One of the reasons that the standard deviation is preferred as a measure of variation over the variance is that the standard deviation is measured in the original units.
Unlock Deck
Unlock for access to all 138 flashcards in this deck.
Unlock Deck
k this deck
53
For a given set of data, if the data are treated as a population, the calculated standard deviation will be less than it would be had the data been treated as a sample.
Unlock Deck
Unlock for access to all 138 flashcards in this deck.
Unlock Deck
k this deck
54
A store manager tracks the number of customer complaints each week. The following data reflect a random sample of ten weeks. The standard deviation for these data is approximately 27.78.
The standard deviation for these data is approximately 27.78. Unlock Deck
Unlock for access to all 138 flashcards in this deck.
Unlock Deck
k this deck
55
The Good-Guys Car Dealership has tracked the number of used cars sold at its downtown dealership.Consider the following data as representing the population of cars sold in each of the 8 weeks that the dealership has been open. The population range is 9.
The population range is 9. Unlock Deck
Unlock for access to all 138 flashcards in this deck.
Unlock Deck
k this deck
56
When a variance is calculated for a data set, the resulting value is the same regardless of whether the data set is treated as a population or a sample.
Unlock Deck
Unlock for access to all 138 flashcards in this deck.
Unlock Deck
k this deck
57
A dairy farm in Wisconsin bottles milk in one gallon containers. At a recent meeting, the production manager asked top management for a new filling machine that he argued would assure that all containers had exactly one gallon of milk. Based on sound statistical principles, the top management group should conclude that the production manager could have merit to his argument.
Unlock Deck
Unlock for access to all 138 flashcards in this deck.
Unlock Deck
k this deck
58
When surveyed, a sample of 1,250 patients at a regional hospital provided interviewers with the following summary statistics pertaining to the hospital charges: Minimum = $278.00 Q1 = $1,245 Q2 = $3,567 Q3= $4,702. Based on these data, if you were to construct a box and whisker plot, the value $278 would be considered an outlier.
Unlock Deck
Unlock for access to all 138 flashcards in this deck.
Unlock Deck
k this deck
59
When surveyed, a sample of 1,250 patients at a regional hospital provided interviewers with the following summary statistics pertaining to the hospital charges: Minimum = $278.00 Q1 = $1,245 Q2 = $3,567 Q3= $4,702. Based on these data, the distribution is seen to be symmetric.
Unlock Deck
Unlock for access to all 138 flashcards in this deck.
Unlock Deck
k this deck
60
A store manager tracks the number of customer complaints each week. The following data reflect a random sample of ten weeks. The range for these data is 8.
The range for these data is 8. Unlock Deck
Unlock for access to all 138 flashcards in this deck.
Unlock Deck
k this deck
61
The most frequently used measure of central tendency is:
A) median.
B) mean.
C) mode.
D) middle value.
A) median.
B) mean.
C) mode.
D) middle value.
Unlock Deck
Unlock for access to all 138 flashcards in this deck.
Unlock Deck
k this deck
62
The distribution of dollars paid for car insurance by car owners in a major east coast city is bell- shaped with a mean equal to $750 every six months and a standard deviation equal to $100. Based on this information we should use Tchebysheff's theorem to determine the conservative percentage of car owners that will pay between $550 and $950 for car insurance.
Unlock Deck
Unlock for access to all 138 flashcards in this deck.
Unlock Deck
k this deck
63
Which of the following statements is true?
A) The mean of a population will always be larger than the population standard deviation.
B) The mean of the population will generally be larger than the mean of the sample selected from that population.
C) The population mean and a sample mean for a sample selected from that population will usually be different values.
D) The population mean and sample mean will always be identical.
Unlock Deck
Unlock for access to all 138 flashcards in this deck.
Unlock Deck
k this deck
64
Acme Taxi has two taxi cabs. The manager tracks the daily revenue for each cab. Over the past 20 days, Cab A has averaged $76.00 per night with a standard deviation equal to $11.00. Cab B has averaged $200.00 per night with a standard deviation of $18.00. Based on this information, the coefficient of variation for Cab B is 9 percent.
Unlock Deck
Unlock for access to all 138 flashcards in this deck.
Unlock Deck
k this deck
65
Suppose a distribution has a mean of 80 and standard deviation of 10. It is found that 84 percent of the values in the data set lie between 70 and 90. This implies that the distribution is not bell-shaped.
Unlock Deck
Unlock for access to all 138 flashcards in this deck.
Unlock Deck
k this deck
66
The distribution of bankcard balances for customers is highly right-skewed with a mean of $1,100 and a standard deviation equal to $250. Based on this information, approximately 68 percent of the customers will have bank balances between $850 and $1,350.
Unlock Deck
Unlock for access to all 138 flashcards in this deck.
Unlock Deck
k this deck
67
A population measure, such as the population mean, is called a:
A) statistic.
B) parameter.
C) prime number.
D) sample value.
A) statistic.
B) parameter.
C) prime number.
D) sample value.
Unlock Deck
Unlock for access to all 138 flashcards in this deck.
Unlock Deck
k this deck
68
Acme Taxi has two taxi cabs. The manager tracks the daily revenue for each cab. Over the past 20 days, Cab A has averaged $76.00 per night with a standard deviation equal to $11.00. Cab B has averaged $200.00 per night with a standard deviation of $18.00. Based on this information, Cab B has the greatest relative variation.
Unlock Deck
Unlock for access to all 138 flashcards in this deck.
Unlock Deck
k this deck
69
Consider the following sample data: For these data the sample mean is:
A) 8
B) 10
C) 3
D) 12
For these data the sample mean is:A) 8
B) 10
C) 3
D) 12
Unlock Deck
Unlock for access to all 138 flashcards in this deck.
Unlock Deck
k this deck
70
If a business manager selected a sample of customers and computed the mean income for this sample of customers, she has computed:
A) a statistic.
B) an ordinal value.
C) a nominal value.
D) a parameter.
A) a statistic.
B) an ordinal value.
C) a nominal value.
D) a parameter.
Unlock Deck
Unlock for access to all 138 flashcards in this deck.
Unlock Deck
k this deck
71
The credit card balances for customers at State Bank and Trust has a mean equal to $800 and a standard deviation equal to $60.00. Kevin Smith's balance is $1,352. Based on this, his standardized value is 9.20.
Unlock Deck
Unlock for access to all 138 flashcards in this deck.
Unlock Deck
k this deck
72
A small company has 7 employees. The numbers of years these employees have worked for this company are shown as follows: Based upon this information, the median number of years that employees have been with this company is:
A) 9 years.
B) 16 years.
C) 10 years.
D) 14 years.
Based upon this information, the median number of years that employees have been with this company is:A) 9 years.
B) 16 years.
C) 10 years.
D) 14 years.
Unlock Deck
Unlock for access to all 138 flashcards in this deck.
Unlock Deck
k this deck
73
A small company has 7 employees. The numbers of years these employees have worked for this company are shown as follows: Based upon this information, the mode number of years that employees have been with this company is:
A) 16
B) 2
C) 9
D) 10
Based upon this information, the mode number of years that employees have been with this company is:A) 16
B) 2
C) 9
D) 10
Unlock Deck
Unlock for access to all 138 flashcards in this deck.
Unlock Deck
k this deck
74
Based on the empirical rule we can assume that all bell-shaped distributions have approximately 95 percent of the values within ± 2 standard deviations of the mean.
Unlock Deck
Unlock for access to all 138 flashcards in this deck.
Unlock Deck
k this deck
75
A sample of people who have attended a college football game at your university has a mean = 3.2 members in their family. The mode number of family members is 2 and the median number is 2.0. Based on this information:
A) the population mean exceeds 3.2.
B) the distribution is bell-shaped.
C) the distribution is right-skewed.
D) the distribution is left-skewed.
A) the population mean exceeds 3.2.
B) the distribution is bell-shaped.
C) the distribution is right-skewed.
D) the distribution is left-skewed.
Unlock Deck
Unlock for access to all 138 flashcards in this deck.
Unlock Deck
k this deck
76
A major automobile maker has two models of sedans. The first model has been shown to get an average of 27 mpg on the highway with a standard deviation equal to 5 mpg. The second model gets 33 mpg on average with a standard deviation of 8 mpg. Based on this information the first car model is relatively more variable than the second car model.
Unlock Deck
Unlock for access to all 138 flashcards in this deck.
Unlock Deck
k this deck
77
Consider the following sample data: For these data the median is:
A) 7.5
B) 3.5
C) 10
D) None of the above
For these data the median is:A) 7.5
B) 3.5
C) 10
D) None of the above
Unlock Deck
Unlock for access to all 138 flashcards in this deck.
Unlock Deck
k this deck
78
Based on the empirical rule we can expect about 95 percent of the values in bell-shaped distributions to be within ± one standard deviation of the mean.
Unlock Deck
Unlock for access to all 138 flashcards in this deck.
Unlock Deck
k this deck
79
A small company has 7 employees. The numbers of years these employees have worked for this company are shown as follows: Based upon this information, the mean number of years that employees have been with this company is:
A) 16
B) x
C) 8.40
D) 10
Based upon this information, the mean number of years that employees have been with this company is:A) 16
B) x
C) 8.40
D) 10
Unlock Deck
Unlock for access to all 138 flashcards in this deck.
Unlock Deck
k this deck
80
Consider a situation involving two populations where population 1 is known to have a higher coefficient of variation than population 2. In this situation, we know that population 1 has a higher standard deviation than population 2.
Unlock Deck
Unlock for access to all 138 flashcards in this deck.
Unlock Deck
k this deck
Unlock Deck
Unlock for access to all 138 flashcards in this deck.


