Deck 15: Multiple Regression Analysis and Model Building
Full screen (f)
Question
Question
Question
Question
Question
Question
Question
Question
Question
Question
Question
Question
Question
Question
Question
Question
Question
Question
Question
Question
Question
Question
A major car magazine has recently collected data on 30 leading cars in the U.S. market. It is interested in building a multiple regression model to explain the variation in highway miles. The following correlation matrix has been computed from the data collected: 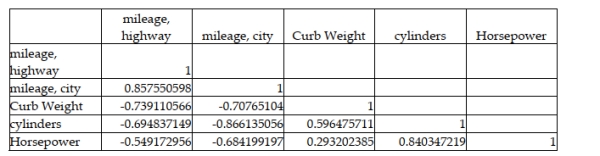 If the independent variables, curb weight, cylinders, and horsepower are used together in a multiple regression model, there may be a potential problem with multicollinearity since horsepower and cylinders are highly correlated.
If the independent variables, curb weight, cylinders, and horsepower are used together in a multiple regression model, there may be a potential problem with multicollinearity since horsepower and cylinders are highly correlated. Question
A major car magazine has recently collected data on 30 leading cars in the U.S. market. It is interested in building a multiple regression model to explain the variation in highway miles. The following correltion matrix has been computed from the data collected: 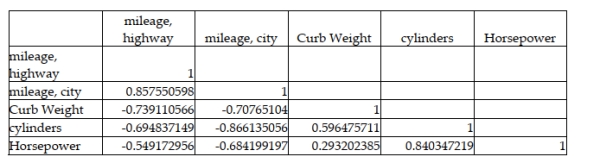 The analysts also produced the following multiple regression output using curb weight, cylinders, and horsepower as the three independent variables. Note, a number of the output fields are missing, but can be determined from the information provided.
  Based on the information provided, holding the other variables constant, increasing horsepower by one unit results in an average decrease in highway mileage by 0.016 miles per gallon.
The analysts also produced the following multiple regression output using curb weight, cylinders, and horsepower as the three independent variables. Note, a number of the output fields are missing, but can be determined from the information provided. Based on the information provided, holding the other variables constant, increasing horsepower by one unit results in an average decrease in highway mileage by 0.016 miles per gallon. Question
Question
A major car magazine has recently collected data on 30 leading cars in the U.S. market. It is interested in building a multiple regression model to explain the variation in highway miles. The following correlation matrix has been computed from the data collected: 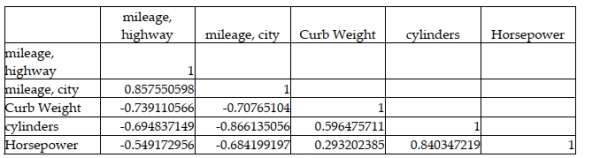 The analysts also produced the following multiple regression output using curb weight, cylinders, and horsepower as the three independent variables. Note, a number of the output fields are missing, but can be determined from the information provided.
  Based on the above information, the test statistic for testing whether the overall model is statistically significant is approximately F = 17.4
The analysts also produced the following multiple regression output using curb weight, cylinders, and horsepower as the three independent variables. Note, a number of the output fields are missing, but can be determined from the information provided. Based on the above information, the test statistic for testing whether the overall model is statistically significant is approximately F = 17.4 Question
A major car magazine has recently collected data on 30 leading cars in the U.S. market. It is interested in building a multiple regression model to explain the variation in highway miles. The following correlation matrix has been computed from the data collected: 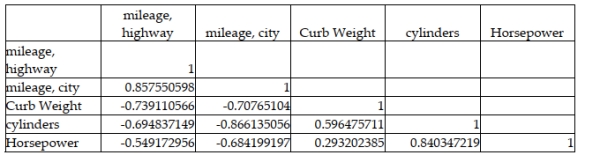 If only one independent variable (ignoring city mileage) is to be used in explaining the dependent variable in a regression model, the percentage of variation that will be explained will be nearly 74 percent.
If only one independent variable (ignoring city mileage) is to be used in explaining the dependent variable in a regression model, the percentage of variation that will be explained will be nearly 74 percent. Question
A major car magazine has recently collected data on 30 leading cars in the U.S. market. It is interested in building a multiple regression model to explain the variation in highway miles. The following correlation matrix has been computed from the data collected: 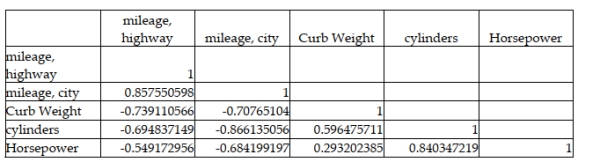 The analysts also produced the following multiple regression output using curb weight, cylinders, and horsepower as the three independent variables. Note, a number of the output fields are missing, but can be determined from the information provided.
  Based on this information, the standard error of the estimate for the regression model is approximately 6.46 miles per gallon.
The analysts also produced the following multiple regression output using curb weight, cylinders, and horsepower as the three independent variables. Note, a number of the output fields are missing, but can be determined from the information provided. Based on this information, the standard error of the estimate for the regression model is approximately 6.46 miles per gallon. Question
A study has recently been conducted by a major computer magazine publisher in which the objective was to develop a multiple regression model to explain the variation in price of personal computers. Three independent variables were used. The following computer printout shows the final output. However, several values are omitted from the printout.  Given this information, the calculated test statistic for the regression slope coefficient on the variable RAM, is approximately 1.54.
Given this information, the calculated test statistic for the regression slope coefficient on the variable RAM, is approximately 1.54. Question
Question
A study has recently been conducted by a major computer magazine publisher in which the objective was to develop a multiple regression model to explain the variation in price of personal computers. Three independent variables were used. The following computer printout shows the final output. However, several values are omitted from the printout. 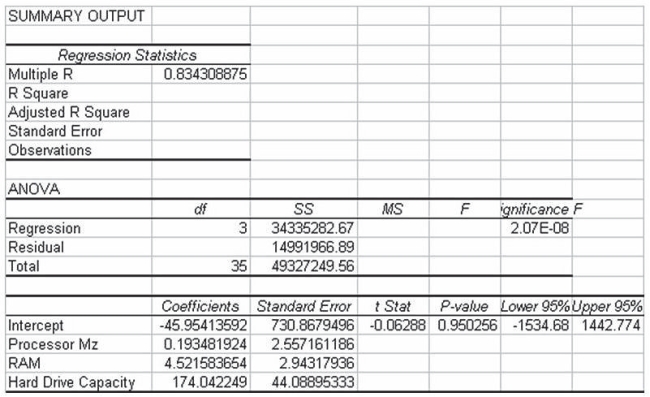 Given this information, the regression model explains just under 70 percent of the variation in the price of personal computers.
Given this information, the regression model explains just under 70 percent of the variation in the price of personal computers. Question
Question
Question
Question
Question
A study has recently been conducted by a major computer magazine publisher in which the objective was to develop a multiple regression model to explain the variation in price of personal computers. Three independent variables were used. The following computer printout shows the final output. However, several values are omitted from the printout.  Given this information, using an alpha = .05 level, you can conclude that the overall regression model is statistically significant.
Given this information, using an alpha = .05 level, you can conclude that the overall regression model is statistically significant. Question
Based on the correlations below: 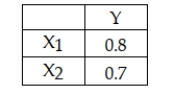 we could say that x1 accounts for 64 percent of the variation in y and x2 accounts for 49 percent of the variation in y. So if both xs are included in a multiple regression model, then the resulting R-square = 1.13.
we could say that x1 accounts for 64 percent of the variation in y and x2 accounts for 49 percent of the variation in y. So if both xs are included in a multiple regression model, then the resulting R-square = 1.13. Question
Question
A major car magazine has recently collected data on 30 leading cars in the U.S. market. It is interested in building a multiple regression model to explain the variation in highway miles. The following correlation matrix has been computed from the data collected: 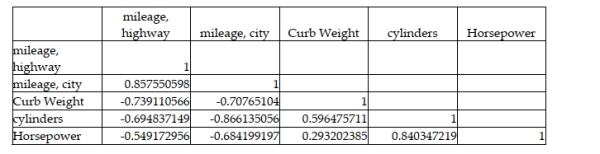 The analysts also produced the following multiple regression output using curb weight, cylinders, and horsepower as the three independent variables. Note, a number of the output fields are missing, but can be determined from the information provided.
  If the analysts are interested in testing whether the overall regression model is statistically significant, the appropriate null and alternative hypotheses are: H0 : β1 = β2 = β3 Ha : β1 ≠ β2 ≠ β3
The analysts also produced the following multiple regression output using curb weight, cylinders, and horsepower as the three independent variables. Note, a number of the output fields are missing, but can be determined from the information provided. If the analysts are interested in testing whether the overall regression model is statistically significant, the appropriate null and alternative hypotheses are: H0 : β1 = β2 = β3 Ha : β1 ≠ β2 ≠ β3 Question
A major car magazine has recently collected data on 30 leading cars in the U.S. market. It is interested in building a multiple regression model to explain the variation in highway miles. The following correlation matrix has been computed from the data collected: 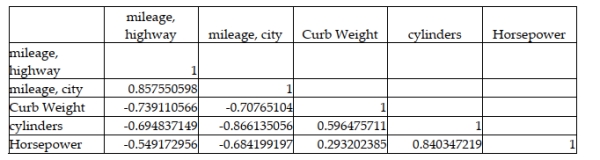 Based on this information, if we test using a 0.05 level of significance, the critical value for testing whether any of the independent variables are significantly correlated with the dependent variable is t = 2.0484.
Based on this information, if we test using a 0.05 level of significance, the critical value for testing whether any of the independent variables are significantly correlated with the dependent variable is t = 2.0484. Question
A major car magazine has recently collected data on 30 leading cars in the U.S. market. It is interested in building a multiple regression model to explain the variation in highway miles. The following correlation matrix has been computed from the data collected: 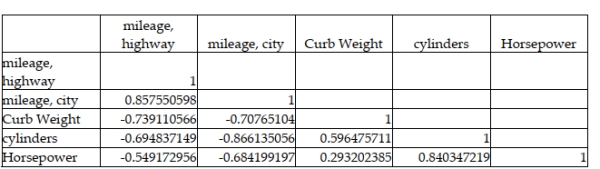 The analysts also produced the following multiple regression output using curb weight, cylinders, and horsepower as the three independent variables. Note that a number of the output fields are missing, but can be determined from the information provided.
 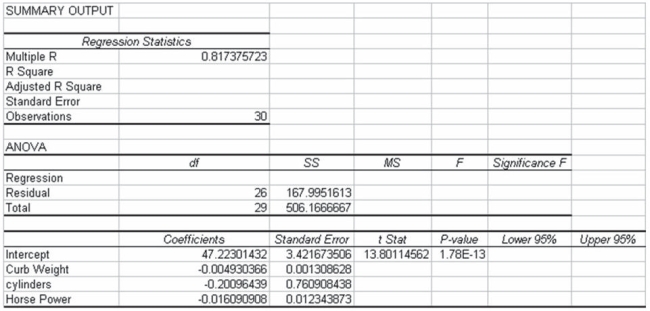 Based on the information provided, the three independent variables explain approximately 67 percent of the variation in the highway mileage among these 30 cars.
The analysts also produced the following multiple regression output using curb weight, cylinders, and horsepower as the three independent variables. Note that a number of the output fields are missing, but can be determined from the information provided. Based on the information provided, the three independent variables explain approximately 67 percent of the variation in the highway mileage among these 30 cars. Question
A major car magazine has recently collected data on 30 leading cars in the U.S. market. It is interested in building a multiple regression model to explain the variation in highway miles. The following correlation matrix has been computed from the data collected: 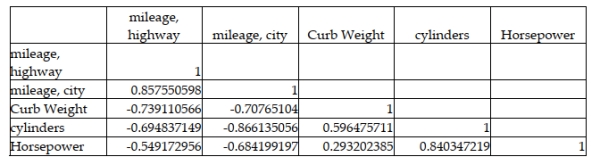 The analysts also produced the following multiple regression output using curb weight, cylinders, and horsepower as the three independent variables. Note, a number of the output fields are missing, but can be determined from the information provided.
 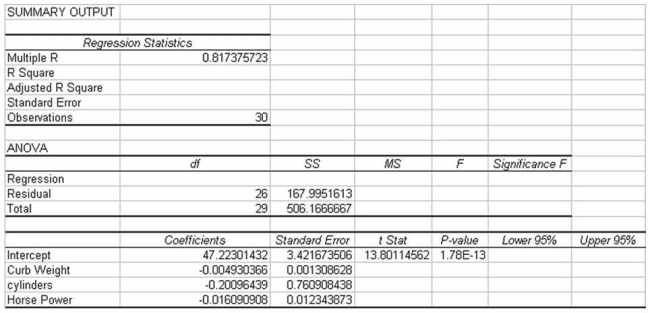 Based on the information provided, using a 0.05 level of statistical significance, both curb weight and horsepower are statistically significant variables in explaining the variation in the dependent variable when they are included in the model along with cylinders.
The analysts also produced the following multiple regression output using curb weight, cylinders, and horsepower as the three independent variables. Note, a number of the output fields are missing, but can be determined from the information provided. Based on the information provided, using a 0.05 level of statistical significance, both curb weight and horsepower are statistically significant variables in explaining the variation in the dependent variable when they are included in the model along with cylinders. Question
Question
Question
Question
Question
A study has recently been conducted by a major computer magazine publisher in which the objective was to develop a multiple regression model to explain the variation in price of personal computers. Three quantitative independent variables were used along with one qualitative variable. The qualitative variable was coded 1 if the computer included a monitor, 0 otherwise. The following computer printout shows the final output. 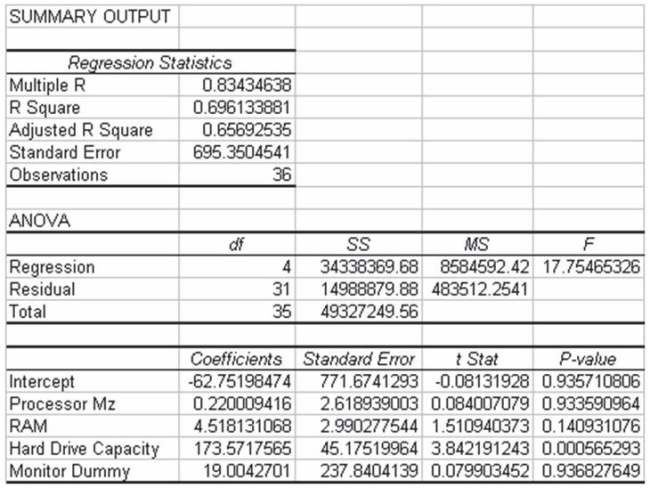 Based on this information, given the other variables in the model, whether or not a monitor is included has a significant impact on the price of the personal computer.
Based on this information, given the other variables in the model, whether or not a monitor is included has a significant impact on the price of the personal computer. Question
Question
Question
Question
A regression model of the form: 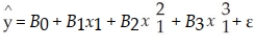 is called a 3rd order polynomial model.
is called a 3rd order polynomial model. Question
Question
Question
A major car magazine has recently collected data on 30 leading cars in the U.S. market. It is interested in building a multiple regression model to explain the variation in highway miles. The following correlation matrix has been computed from the data collected: 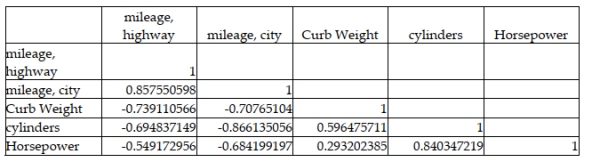 The analysts also produced the following multiple regression output using curb weight, cylinders, and horsepower as the three independent variables. Note, a number of the output fields are missing, but can be determined from the information provided.
  Based on the information provided, the 95 percent confidence interval estimate for regression slope coefficient for horsepower is approximately - 0.041 to 0.009 and since this interval crosses zero, we are unable to conclude that the regression slope coefficient for this variable is different from zero.
The analysts also produced the following multiple regression output using curb weight, cylinders, and horsepower as the three independent variables. Note, a number of the output fields are missing, but can be determined from the information provided. Based on the information provided, the 95 percent confidence interval estimate for regression slope coefficient for horsepower is approximately - 0.041 to 0.009 and since this interval crosses zero, we are unable to conclude that the regression slope coefficient for this variable is different from zero. Question
Question
Question
Consider the following regression model: 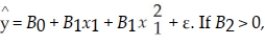 then the parabola will open downward and if B2 < 0, then the parabola will open downward.
then the parabola will open downward and if B2 < 0, then the parabola will open downward. Question
Question
Question
Question
A study has recently been conducted by a major computer magazine publisher in which the objective was to develop a multiple regression model to explain the variation in price of personal computers. Three quantitative independent variables were used along with one qualitative variable. The qualitative variable was coded 1 if the computer included a monitor, 0 otherwise. The following computer printout shows the final output.  Based on this information, it is possible to determine that 4 of the PCs in the data set did not have a monitor included.
Based on this information, it is possible to determine that 4 of the PCs in the data set did not have a monitor included. Question
Consider the following scatter plot: 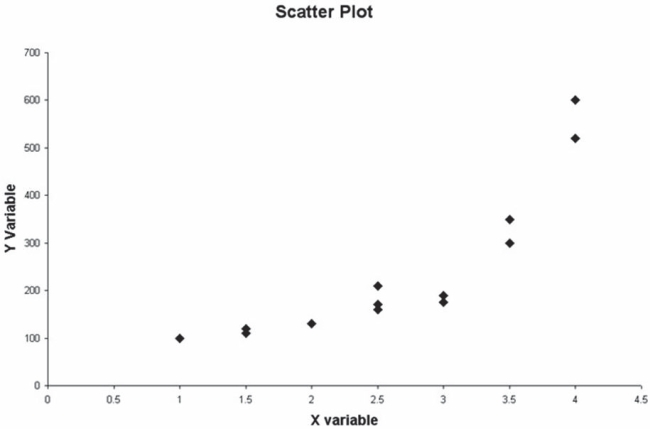 Given the apparent relationship between the x and y variable, a possible curvilinear regression model to consider would be a second-order polynomial model.
Given the apparent relationship between the x and y variable, a possible curvilinear regression model to consider would be a second-order polynomial model. Question
The following output is for a second-order polynomial regression model where the independent variables are x and x2 (x^2 in output). Some of the output has been omitted.  Considering the above information, it is clear that the second-order polynomial model will be a more effective regression model for explaining the variation in the y variable than would a linear regression model involving only one independent variable, x.
Considering the above information, it is clear that the second-order polynomial model will be a more effective regression model for explaining the variation in the y variable than would a linear regression model involving only one independent variable, x. Question
The following output is for a second-order polynomial regression model where the independent variables are x and x2 (x^2 in output). Some of the output has been omitted. 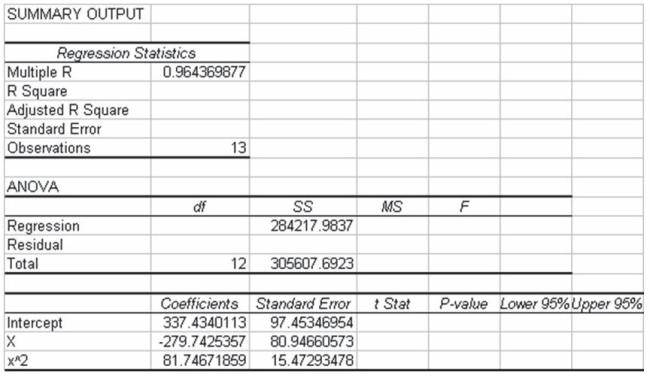 Considering the above information, both independent variables in the model are considered statistically significant at the alpha = 0.05 level.
Considering the above information, both independent variables in the model are considered statistically significant at the alpha = 0.05 level. Question
Question
Question
Question
Question
Question
Question
Question
Question
In regression model: 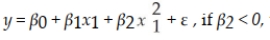 then the value of y is expected to increase with x until x reaches a certain point after which the value of y is expected to decrease.
then the value of y is expected to increase with x until x reaches a certain point after which the value of y is expected to decrease. Question
Question
Question
Question
The following output is for a second-order polynomial regression model where the independent variables are x and x2 (x^2 in output). Some of the output has been omitted.  Considering the above information, the model explains approximately 56.7 percent of the variation in the y variable.
Considering the above information, the model explains approximately 56.7 percent of the variation in the y variable. Question
Question
Question
Question

Unlock Deck
Sign up to unlock the cards in this deck!
Unlock Deck
Unlock Deck
1/148
Play
Full screen (f)
Deck 15: Multiple Regression Analysis and Model Building
1
Where there are two independent variables in a multiple regression, the regression equation forms a plane.
True
2
In conducting multiple regression analysis, t-tests are one way to test for significance between x and y variables prior to conducting the F-test.
True
3
The multiple coefficient of determination is the average of all the squared correlations of the independent variables.
False
4
In a multiple regression model, the regression coefficients are calculated such that the quantity, , is minimized.
Unlock Deck
Unlock for access to all 148 flashcards in this deck.
Unlock Deck
k this deck
5
In simple linear regression analysis, the regression model forms a straight line in two-dimensional space through the x,y data points, while a multiple regression model forms a plane through multidimensional space.
Unlock Deck
Unlock for access to all 148 flashcards in this deck.
Unlock Deck
k this deck
6
The multiple coefficient of determination measures the percentage of variation in the dependent variable that is explained by the independent variables in the model.
Unlock Deck
Unlock for access to all 148 flashcards in this deck.
Unlock Deck
k this deck
7
A correlation matrix shows the correlation between each independent variable and the dependent variable but gives no information about the potential for multicollinearity problems.
Unlock Deck
Unlock for access to all 148 flashcards in this deck.
Unlock Deck
k this deck
8
In a multiple regression model, it is assumed that the errors or residuals are normally distributed.
Unlock Deck
Unlock for access to all 148 flashcards in this deck.
Unlock Deck
k this deck
9
In a multiple regression model, R-square can be computed by squaring the highest correlation coefficient between the dependent variable and any independent variable.
Unlock Deck
Unlock for access to all 148 flashcards in this deck.
Unlock Deck
k this deck
10
In multiple regression analysis, the residual is the absolute difference between the actual value of y and the predicted value of y.
Unlock Deck
Unlock for access to all 148 flashcards in this deck.
Unlock Deck
k this deck
11
Multicollinearity occurs when one or more independent variables is highly correlated with the dependent variable.
Unlock Deck
Unlock for access to all 148 flashcards in this deck.
Unlock Deck
k this deck
12
A model is a representation of an actual system.
Unlock Deck
Unlock for access to all 148 flashcards in this deck.
Unlock Deck
k this deck
13
In multiple regression analysis, the model will be developed with one dependent variable and two or more independent variables.
Unlock Deck
Unlock for access to all 148 flashcards in this deck.
Unlock Deck
k this deck
14
It is generally suggested that the sample size in developing a multiple regression model should be at least four times the number of independent variables.
Unlock Deck
Unlock for access to all 148 flashcards in this deck.
Unlock Deck
k this deck
15
If a decision maker has several potential independent variables to select from in building a regression model, the variable that, by itself, will always be the most effective in explaining the variation in the dependent variable will be the variable that has a correlation closest to positive 1.00.
Unlock Deck
Unlock for access to all 148 flashcards in this deck.
Unlock Deck
k this deck
16
In a multiple regression model, each regression slope coefficient measures the average change in the dependent variable for a one-unit change in the independent variable, all other variables held constant.
Unlock Deck
Unlock for access to all 148 flashcards in this deck.
Unlock Deck
k this deck
17
The correlation matrix is an effective means of determining whether any of the independent variables has a curvilinear relationship with the dependent variable.
Unlock Deck
Unlock for access to all 148 flashcards in this deck.
Unlock Deck
k this deck
18
In the model diagnosis step in regression modeling, we are interested in whether the overall regression model and individual variables are significant in addition to satisfying regression analysis assumptions.
Unlock Deck
Unlock for access to all 148 flashcards in this deck.
Unlock Deck
k this deck
19
The three components of the regression model-building process are model specification, model fitting, and model diagnosis.
Unlock Deck
Unlock for access to all 148 flashcards in this deck.
Unlock Deck
k this deck
20
The standard error of the estimate is a term that is used for the standard deviation of the residuals in a multiple regression model.
Unlock Deck
Unlock for access to all 148 flashcards in this deck.
Unlock Deck
k this deck
21
In a multiple regression model, the adjusted R-square value measures the explained variation in the dependent variable after taking into account the relationship between the sample size and the number of independent variables in the model.
Unlock Deck
Unlock for access to all 148 flashcards in this deck.
Unlock Deck
k this deck
22
A major car magazine has recently collected data on 30 leading cars in the U.S. market. It is interested in building a multiple regression model to explain the variation in highway miles. The following correlation matrix has been computed from the data collected: If the independent variables, curb weight, cylinders, and horsepower are used together in a multiple regression model, there may be a potential problem with multicollinearity since horsepower and cylinders are highly correlated.
If the independent variables, curb weight, cylinders, and horsepower are used together in a multiple regression model, there may be a potential problem with multicollinearity since horsepower and cylinders are highly correlated. Unlock Deck
Unlock for access to all 148 flashcards in this deck.
Unlock Deck
k this deck
23
A major car magazine has recently collected data on 30 leading cars in the U.S. market. It is interested in building a multiple regression model to explain the variation in highway miles. The following correltion matrix has been computed from the data collected: The analysts also produced the following multiple regression output using curb weight, cylinders, and horsepower as the three independent variables. Note, a number of the output fields are missing, but can be determined from the information provided. Based on the information provided, holding the other variables constant, increasing horsepower by one unit results in an average decrease in highway mileage by 0.016 miles per gallon.
The analysts also produced the following multiple regression output using curb weight, cylinders, and horsepower as the three independent variables. Note, a number of the output fields are missing, but can be determined from the information provided. Based on the information provided, holding the other variables constant, increasing horsepower by one unit results in an average decrease in highway mileage by 0.016 miles per gallon. Unlock Deck
Unlock for access to all 148 flashcards in this deck.
Unlock Deck
k this deck
24
The variance inflation factor is an indication of how much multicollinearity there is in the regression model.
Unlock Deck
Unlock for access to all 148 flashcards in this deck.
Unlock Deck
k this deck
25
A major car magazine has recently collected data on 30 leading cars in the U.S. market. It is interested in building a multiple regression model to explain the variation in highway miles. The following correlation matrix has been computed from the data collected: The analysts also produced the following multiple regression output using curb weight, cylinders, and horsepower as the three independent variables. Note, a number of the output fields are missing, but can be determined from the information provided. Based on the above information, the test statistic for testing whether the overall model is statistically significant is approximately F = 17.4
The analysts also produced the following multiple regression output using curb weight, cylinders, and horsepower as the three independent variables. Note, a number of the output fields are missing, but can be determined from the information provided. Based on the above information, the test statistic for testing whether the overall model is statistically significant is approximately F = 17.4 Unlock Deck
Unlock for access to all 148 flashcards in this deck.
Unlock Deck
k this deck
26
A major car magazine has recently collected data on 30 leading cars in the U.S. market. It is interested in building a multiple regression model to explain the variation in highway miles. The following correlation matrix has been computed from the data collected: If only one independent variable (ignoring city mileage) is to be used in explaining the dependent variable in a regression model, the percentage of variation that will be explained will be nearly 74 percent.
If only one independent variable (ignoring city mileage) is to be used in explaining the dependent variable in a regression model, the percentage of variation that will be explained will be nearly 74 percent. Unlock Deck
Unlock for access to all 148 flashcards in this deck.
Unlock Deck
k this deck
27
A major car magazine has recently collected data on 30 leading cars in the U.S. market. It is interested in building a multiple regression model to explain the variation in highway miles. The following correlation matrix has been computed from the data collected: The analysts also produced the following multiple regression output using curb weight, cylinders, and horsepower as the three independent variables. Note, a number of the output fields are missing, but can be determined from the information provided. Based on this information, the standard error of the estimate for the regression model is approximately 6.46 miles per gallon.
The analysts also produced the following multiple regression output using curb weight, cylinders, and horsepower as the three independent variables. Note, a number of the output fields are missing, but can be determined from the information provided. Based on this information, the standard error of the estimate for the regression model is approximately 6.46 miles per gallon. Unlock Deck
Unlock for access to all 148 flashcards in this deck.
Unlock Deck
k this deck
28
A study has recently been conducted by a major computer magazine publisher in which the objective was to develop a multiple regression model to explain the variation in price of personal computers. Three independent variables were used. The following computer printout shows the final output. However, several values are omitted from the printout. Given this information, the calculated test statistic for the regression slope coefficient on the variable RAM, is approximately 1.54.
Given this information, the calculated test statistic for the regression slope coefficient on the variable RAM, is approximately 1.54. Unlock Deck
Unlock for access to all 148 flashcards in this deck.
Unlock Deck
k this deck
29
If the R-square for a multiple regression model with two independent variables is .64, the correlation between the two independent variables will be .80
Unlock Deck
Unlock for access to all 148 flashcards in this deck.
Unlock Deck
k this deck
30
A study has recently been conducted by a major computer magazine publisher in which the objective was to develop a multiple regression model to explain the variation in price of personal computers. Three independent variables were used. The following computer printout shows the final output. However, several values are omitted from the printout. Given this information, the regression model explains just under 70 percent of the variation in the price of personal computers.
Given this information, the regression model explains just under 70 percent of the variation in the price of personal computers. Unlock Deck
Unlock for access to all 148 flashcards in this deck.
Unlock Deck
k this deck
31
In a multiple regression model where three independent variables are included in the model, the percentage of explained variation will be equal to the square of the sum of the correlations between the independent variables and the dependent variable.
Unlock Deck
Unlock for access to all 148 flashcards in this deck.
Unlock Deck
k this deck
32
When an independent variable, that has a positive correlation with the dependent variable, receives a negative slope in a multiple regression, this is probably caused by multicollinearity.
Unlock Deck
Unlock for access to all 148 flashcards in this deck.
Unlock Deck
k this deck
33
In a multiple regression analysis with three independent variables the alternative hypothesis for conducting the test of the overall model is: HA : More than one βi ≠ 0.
Unlock Deck
Unlock for access to all 148 flashcards in this deck.
Unlock Deck
k this deck
34
The variance inflation factor (VIF) provides a measure for each independent variable of how much multicollinearity is associated with that particular independent variable.
Unlock Deck
Unlock for access to all 148 flashcards in this deck.
Unlock Deck
k this deck
35
A study has recently been conducted by a major computer magazine publisher in which the objective was to develop a multiple regression model to explain the variation in price of personal computers. Three independent variables were used. The following computer printout shows the final output. However, several values are omitted from the printout. Given this information, using an alpha = .05 level, you can conclude that the overall regression model is statistically significant.
Given this information, using an alpha = .05 level, you can conclude that the overall regression model is statistically significant. Unlock Deck
Unlock for access to all 148 flashcards in this deck.
Unlock Deck
k this deck
36
Based on the correlations below: we could say that x1 accounts for 64 percent of the variation in y and x2 accounts for 49 percent of the variation in y. So if both xs are included in a multiple regression model, then the resulting R-square = 1.13.
we could say that x1 accounts for 64 percent of the variation in y and x2 accounts for 49 percent of the variation in y. So if both xs are included in a multiple regression model, then the resulting R-square = 1.13. Unlock Deck
Unlock for access to all 148 flashcards in this deck.
Unlock Deck
k this deck
37
The adjusted R2 value is a particularly important measure when the number of independent variables is large relative to the sample size.
Unlock Deck
Unlock for access to all 148 flashcards in this deck.
Unlock Deck
k this deck
38
A major car magazine has recently collected data on 30 leading cars in the U.S. market. It is interested in building a multiple regression model to explain the variation in highway miles. The following correlation matrix has been computed from the data collected: The analysts also produced the following multiple regression output using curb weight, cylinders, and horsepower as the three independent variables. Note, a number of the output fields are missing, but can be determined from the information provided. If the analysts are interested in testing whether the overall regression model is statistically significant, the appropriate null and alternative hypotheses are: H0 : β1 = β2 = β3 Ha : β1 ≠ β2 ≠ β3
The analysts also produced the following multiple regression output using curb weight, cylinders, and horsepower as the three independent variables. Note, a number of the output fields are missing, but can be determined from the information provided. If the analysts are interested in testing whether the overall regression model is statistically significant, the appropriate null and alternative hypotheses are: H0 : β1 = β2 = β3 Ha : β1 ≠ β2 ≠ β3 Unlock Deck
Unlock for access to all 148 flashcards in this deck.
Unlock Deck
k this deck
39
A major car magazine has recently collected data on 30 leading cars in the U.S. market. It is interested in building a multiple regression model to explain the variation in highway miles. The following correlation matrix has been computed from the data collected: Based on this information, if we test using a 0.05 level of significance, the critical value for testing whether any of the independent variables are significantly correlated with the dependent variable is t = 2.0484.
Based on this information, if we test using a 0.05 level of significance, the critical value for testing whether any of the independent variables are significantly correlated with the dependent variable is t = 2.0484. Unlock Deck
Unlock for access to all 148 flashcards in this deck.
Unlock Deck
k this deck
40
A major car magazine has recently collected data on 30 leading cars in the U.S. market. It is interested in building a multiple regression model to explain the variation in highway miles. The following correlation matrix has been computed from the data collected: The analysts also produced the following multiple regression output using curb weight, cylinders, and horsepower as the three independent variables. Note that a number of the output fields are missing, but can be determined from the information provided. Based on the information provided, the three independent variables explain approximately 67 percent of the variation in the highway mileage among these 30 cars.
The analysts also produced the following multiple regression output using curb weight, cylinders, and horsepower as the three independent variables. Note that a number of the output fields are missing, but can be determined from the information provided. Based on the information provided, the three independent variables explain approximately 67 percent of the variation in the highway mileage among these 30 cars. Unlock Deck
Unlock for access to all 148 flashcards in this deck.
Unlock Deck
k this deck
41
A major car magazine has recently collected data on 30 leading cars in the U.S. market. It is interested in building a multiple regression model to explain the variation in highway miles. The following correlation matrix has been computed from the data collected: The analysts also produced the following multiple regression output using curb weight, cylinders, and horsepower as the three independent variables. Note, a number of the output fields are missing, but can be determined from the information provided. Based on the information provided, using a 0.05 level of statistical significance, both curb weight and horsepower are statistically significant variables in explaining the variation in the dependent variable when they are included in the model along with cylinders.
The analysts also produced the following multiple regression output using curb weight, cylinders, and horsepower as the three independent variables. Note, a number of the output fields are missing, but can be determined from the information provided. Based on the information provided, using a 0.05 level of statistical significance, both curb weight and horsepower are statistically significant variables in explaining the variation in the dependent variable when they are included in the model along with cylinders. Unlock Deck
Unlock for access to all 148 flashcards in this deck.
Unlock Deck
k this deck
42
Consider the following regression equation: = 356 + 180x1 - 2.5x2. The x1 variable is a quantitative variable and the x2 variable is a dummy with values 1 and 0. Given this, we can interpret the slope coefficient on variable x2 as follows: Holding x1 constant, if the value of x2 is changed from 0 to 1, the average value of y will decrease by 2.5 units.
Unlock Deck
Unlock for access to all 148 flashcards in this deck.
Unlock Deck
k this deck
43
A complete polynomial model contains terms of all orders less than or equal to the pth order.
Unlock Deck
Unlock for access to all 148 flashcards in this deck.
Unlock Deck
k this deck
44
A dummy variable is a dependent variable whose value is set at either zero or one.
Unlock Deck
Unlock for access to all 148 flashcards in this deck.
Unlock Deck
k this deck
45
One of the variables that are being considered for inclusion in a multiple regression model is marital status of the customer. There are four possible responses listed for this variable. Based on this, three dummy variables will need to be created and incorporated into the regression model.
Unlock Deck
Unlock for access to all 148 flashcards in this deck.
Unlock Deck
k this deck
46
A study has recently been conducted by a major computer magazine publisher in which the objective was to develop a multiple regression model to explain the variation in price of personal computers. Three quantitative independent variables were used along with one qualitative variable. The qualitative variable was coded 1 if the computer included a monitor, 0 otherwise. The following computer printout shows the final output. Based on this information, given the other variables in the model, whether or not a monitor is included has a significant impact on the price of the personal computer.
Based on this information, given the other variables in the model, whether or not a monitor is included has a significant impact on the price of the personal computer. Unlock Deck
Unlock for access to all 148 flashcards in this deck.
Unlock Deck
k this deck
47
In a study of individuals' television viewing hours per week, the predictors are defined as income, job in terms of hours per week, number of people living in the household and stress level. The stress level is the only categorical variable with self-reported levels of stress as 1 = none to 5 = extreme. The stress level can be used as a number in the regression equation.
Unlock Deck
Unlock for access to all 148 flashcards in this deck.
Unlock Deck
k this deck
48
If one independent variable affects the relationship between a second independent variable and the dependent variable, it is said that there is interaction between the two independent variables.
Unlock Deck
Unlock for access to all 148 flashcards in this deck.
Unlock Deck
k this deck
49
The method used in regression analysis for incorporating a categorical variable into the model is by organizing the categorical variable into one or more dummy variables.
Unlock Deck
Unlock for access to all 148 flashcards in this deck.
Unlock Deck
k this deck
50
A regression model of the form: is called a 3rd order polynomial model.
is called a 3rd order polynomial model. Unlock Deck
Unlock for access to all 148 flashcards in this deck.
Unlock Deck
k this deck
51
A regression equation that predicts the price of homes in thousands of dollars is yˆ = 24.6 + 0.055x1 - 3.6x2, where x2 is a dummy variable that represents whether the house is on a busy street or not. Here x2 = 1 means the house is on a busy street and x2 = 0 means it is not. From this we can conclude that on average homes that are on busy streets are worth $3600 more than homes that are not on busy streets.
Unlock Deck
Unlock for access to all 148 flashcards in this deck.
Unlock Deck
k this deck
52
To describe variable credit status that has three levels: Excellent, Good, and Poor, we need to use two different dummy variables.
Unlock Deck
Unlock for access to all 148 flashcards in this deck.
Unlock Deck
k this deck
53
A major car magazine has recently collected data on 30 leading cars in the U.S. market. It is interested in building a multiple regression model to explain the variation in highway miles. The following correlation matrix has been computed from the data collected: The analysts also produced the following multiple regression output using curb weight, cylinders, and horsepower as the three independent variables. Note, a number of the output fields are missing, but can be determined from the information provided. Based on the information provided, the 95 percent confidence interval estimate for regression slope coefficient for horsepower is approximately - 0.041 to 0.009 and since this interval crosses zero, we are unable to conclude that the regression slope coefficient for this variable is different from zero.
The analysts also produced the following multiple regression output using curb weight, cylinders, and horsepower as the three independent variables. Note, a number of the output fields are missing, but can be determined from the information provided. Based on the information provided, the 95 percent confidence interval estimate for regression slope coefficient for horsepower is approximately - 0.041 to 0.009 and since this interval crosses zero, we are unable to conclude that the regression slope coefficient for this variable is different from zero. Unlock Deck
Unlock for access to all 148 flashcards in this deck.
Unlock Deck
k this deck
54
Models can be specified as linear or nonlinear.
Unlock Deck
Unlock for access to all 148 flashcards in this deck.
Unlock Deck
k this deck
55
On a survey there is a question that asks whether someone lives in a house, apartment, or condominium. These three responses could be coded in a dummy variable using value 0, 1, and 2.
Unlock Deck
Unlock for access to all 148 flashcards in this deck.
Unlock Deck
k this deck
56
Consider the following regression model: then the parabola will open downward and if B2 < 0, then the parabola will open downward.
then the parabola will open downward and if B2 < 0, then the parabola will open downward. Unlock Deck
Unlock for access to all 148 flashcards in this deck.
Unlock Deck
k this deck
57
You should not include more than one categorical variable in a multiple regression because the use of two or more will cause misleading results.
Unlock Deck
Unlock for access to all 148 flashcards in this deck.
Unlock Deck
k this deck
58
In a study of employees at a local company, the human resource manager wants to develop a multiple regression model to explain the difference in employee wage rates. She is thinking of including a variable, degree status, in which the following categories exist: no degree, H.S. degree, junior college degree, bachelor degree, graduate degree. Two other variables are being considered; Age and Years With the Company. Given this, the appropriate number of variables in the model will be six.
Unlock Deck
Unlock for access to all 148 flashcards in this deck.
Unlock Deck
k this deck
59
If given a choice in collecting data on age for use as an independent variable in a regression model, a decision maker would generally prefer to record the actual age rather than an age category so as to avoid using dummy variables.
Unlock Deck
Unlock for access to all 148 flashcards in this deck.
Unlock Deck
k this deck
60
A study has recently been conducted by a major computer magazine publisher in which the objective was to develop a multiple regression model to explain the variation in price of personal computers. Three quantitative independent variables were used along with one qualitative variable. The qualitative variable was coded 1 if the computer included a monitor, 0 otherwise. The following computer printout shows the final output. Based on this information, it is possible to determine that 4 of the PCs in the data set did not have a monitor included.
Based on this information, it is possible to determine that 4 of the PCs in the data set did not have a monitor included. Unlock Deck
Unlock for access to all 148 flashcards in this deck.
Unlock Deck
k this deck
61
Consider the following scatter plot: Given the apparent relationship between the x and y variable, a possible curvilinear regression model to consider would be a second-order polynomial model.
Given the apparent relationship between the x and y variable, a possible curvilinear regression model to consider would be a second-order polynomial model. Unlock Deck
Unlock for access to all 148 flashcards in this deck.
Unlock Deck
k this deck
62
The following output is for a second-order polynomial regression model where the independent variables are x and x2 (x^2 in output). Some of the output has been omitted. Considering the above information, it is clear that the second-order polynomial model will be a more effective regression model for explaining the variation in the y variable than would a linear regression model involving only one independent variable, x.
Considering the above information, it is clear that the second-order polynomial model will be a more effective regression model for explaining the variation in the y variable than would a linear regression model involving only one independent variable, x. Unlock Deck
Unlock for access to all 148 flashcards in this deck.
Unlock Deck
k this deck
63
The following output is for a second-order polynomial regression model where the independent variables are x and x2 (x^2 in output). Some of the output has been omitted. Considering the above information, both independent variables in the model are considered statistically significant at the alpha = 0.05 level.
Considering the above information, both independent variables in the model are considered statistically significant at the alpha = 0.05 level. Unlock Deck
Unlock for access to all 148 flashcards in this deck.
Unlock Deck
k this deck
64
A decision maker is considering constructing a multiple regression model with two independent variables. The correlation between x1 and y is 0.70, and the correlation between variable x2 and y is 0.50. Based on this, the regression model containing both independent variables will explain 74 percent of the variation in the dependent variable.
Unlock Deck
Unlock for access to all 148 flashcards in this deck.
Unlock Deck
k this deck
65
When a regression equation includes a term such as x1x2 where two independent variables are multiplied, this is an interaction term.
Unlock Deck
Unlock for access to all 148 flashcards in this deck.
Unlock Deck
k this deck
66
In curvilinear regression modeling, a composite model is one that contains either the basic terms or the interactive terms but not both.
Unlock Deck
Unlock for access to all 148 flashcards in this deck.
Unlock Deck
k this deck
67
A multiple regression model of the form = B0 + B1x + B2x2 + ε is called a second-degree polynomial model.
Unlock Deck
Unlock for access to all 148 flashcards in this deck.
Unlock Deck
k this deck
68
In a second-order polynomial regression model, the regression coefficient, B2, will be positive if the parabola opens downward and negative when the parabola opens upward.
Unlock Deck
Unlock for access to all 148 flashcards in this deck.
Unlock Deck
k this deck
69
It is possible for the standard error of the estimate to actually increase if variables are added to the model that do not aid in explaining the variation in the dependent variable.
Unlock Deck
Unlock for access to all 148 flashcards in this deck.
Unlock Deck
k this deck
70
Backward elimination is the reverse of the forward stepwise selection procedure. The resulting model can be different than the forward model.
Unlock Deck
Unlock for access to all 148 flashcards in this deck.
Unlock Deck
k this deck
71
In a forward stepwise regression process, it is actually possible for the R-square value to decline if variables are added to the regression model that do not help to explain the variation in the dependent variable.
Unlock Deck
Unlock for access to all 148 flashcards in this deck.
Unlock Deck
k this deck
72
In regression model: then the value of y is expected to increase with x until x reaches a certain point after which the value of y is expected to decrease.
then the value of y is expected to increase with x until x reaches a certain point after which the value of y is expected to decrease. Unlock Deck
Unlock for access to all 148 flashcards in this deck.
Unlock Deck
k this deck
73
Stepwise regression is the approach that is always taken when developing a regression model to fit a curvilinear relationship between the dependent and potential independent variables.
Unlock Deck
Unlock for access to all 148 flashcards in this deck.
Unlock Deck
k this deck
74
A multiple regression model of the form = B0 + B1x + B2x2 + B3x3 + ε is called an expanded second- order polynomial since it contains all the terms up to x3 in the model at one time.
Unlock Deck
Unlock for access to all 148 flashcards in this deck.
Unlock Deck
k this deck
75
If a polynomial model has a larger R-square than a linear model for the same set of data, this is one indication that the polynomial model fits the data better than the linear model.
Unlock Deck
Unlock for access to all 148 flashcards in this deck.
Unlock Deck
k this deck
76
The following output is for a second-order polynomial regression model where the independent variables are x and x2 (x^2 in output). Some of the output has been omitted. Considering the above information, the model explains approximately 56.7 percent of the variation in the y variable.
Considering the above information, the model explains approximately 56.7 percent of the variation in the y variable. Unlock Deck
Unlock for access to all 148 flashcards in this deck.
Unlock Deck
k this deck
77
In a forward selection stepwise regression process, the second variable to be selected from the list of potential independent variables is always the one that has the second highest correlation with the dependent variable.
Unlock Deck
Unlock for access to all 148 flashcards in this deck.
Unlock Deck
k this deck
78
In a forward selection stepwise regression process, the first variable to be selected will be the variable that can, by itself, do the most to explain the variation in the dependent variable. This will be the variable that provided the highest possible R-square value by itself.
Unlock Deck
Unlock for access to all 148 flashcards in this deck.
Unlock Deck
k this deck
79
Interaction terms and polynomial terms should not be included in the same multiple regression model.
Unlock Deck
Unlock for access to all 148 flashcards in this deck.
Unlock Deck
k this deck
80
Standard stepwise regression combines attributes of both forward selection and backward elimination.
Unlock Deck
Unlock for access to all 148 flashcards in this deck.
Unlock Deck
k this deck
Unlock Deck
Unlock for access to all 148 flashcards in this deck.


