Deck 10: Correlation
Full screen (f)
Question
Question
Question
Question
Question
Question
Question
Question
Question
Question
Question
Question
Question
Question
Question
Question
Question
Question
Question
Question
Question
Question
Question
The question below refers to the following information:
A professor is interested in knowing if the number of absences a student has during the semester is a good indication of how well a student does on the final exam. At the end of the year, the professor compares absence rates and exam grades for eight students. The data she found are as follows: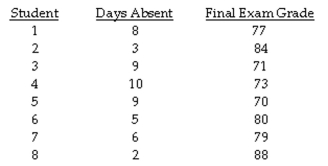
Is the correlation statistically significant and, if so, at what level?
Question
The question below refers to the following information:
A professor is interested in knowing if the number of absences a student has during the semester is a good indication of how well a student does on the final exam. At the end of the year, the professor compares absence rates and exam grades for eight students. The data she found are as follows: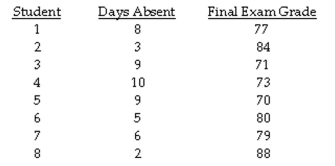
Calculate t in order to see if the correlation is statistically significant.
Question
Question
Question
The question below refers to the following information:
A professor is interested in knowing if the number of absences a student has during the semester is a good indication of how well a student does on the final exam. At the end of the year, the professor compares absence rates and exam grades for eight students. The data she found are as follows: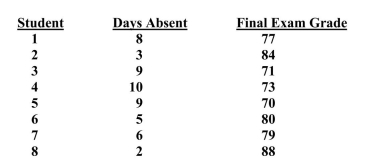
The correlation for the above data has a __________ direction.
Question
Question
Question
Question
The question below refers to the following information:
A professor is interested in knowing if the number of absences a student has during the semester is a good indication of how well a student does on the final exam. At the end of the year, the professor compares absence rates and exam grades for eight students. The data she found are as follows: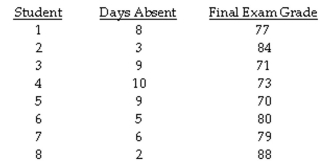
What is the research hypothesis?
Question
The question below refers to the following information:
A professor is interested in knowing if the number of absences a student has during the semester is a good indication of how well a student does on the final exam. At the end of the year, the professor compares absence rates and exam grades for eight students. The data she found are as follows: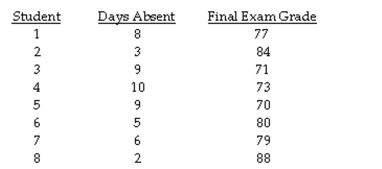
Calculate the Pearson's correlation coefficient.
Question
Question
Question
Question
Question
Question
Question
Question
The question below refers to the following information:
A professor is interested in knowing if the number of absences a student has during the semester is a good indication of how well a student does on the final exam. At the end of the year, the professor compares absence rates and exam grades for eight students. The data she found are as follows: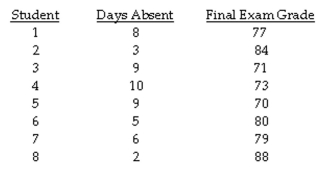
What is the null hypothesis?
Question
Question
Calculate the Pearson's r of the following set of data: 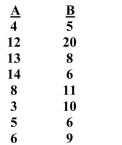
Question
An administrator at a university is interested in studying the relationship between student satisfaction at the university(on a 1-10 scale) and the student's GPA. Here are the data she collected: 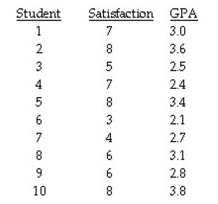
Compute the Pearson's r and test the significance of the obtained correlation (use α = .05) using Table F of Appendix C.
Compute the Pearson's r and test the significance of the obtained correlation (use α = .05) using Table F of Appendix C.
Question
The question below refers to the following information:
A professor is interested in knowing if the number of absences a student has during the semester is a good indication of how well a student does on the final exam. At the end of the year, the professor compares absence rates and exam grades for eight students. The data she found are as follows: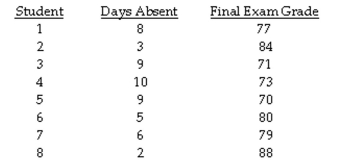
What are your conclusions about the null hypothesis?
Question
The question below refers to the following situation:
A social researcher is interested in studying the relationship between years of education and income. Here are the data he is working with: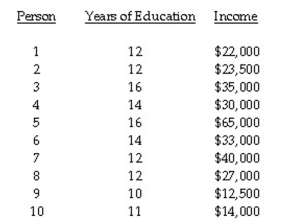
Test the significance of the obtained correlation (use α = .05) using Table F of Appendix C.
A social researcher is interested in studying the relationship between years of education and income. Here are the data he is working with:
Test the significance of the obtained correlation (use α = .05) using Table F of Appendix C.
Question
Use the following data to calculate the Pearson's r and test the significance of the obtained correlation (use α = .05) using Table F of Appendix C: 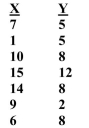
Question
The question below refers to the following situation:
A social researcher is interested in studying the relationship between years of education and income. Here are the data he is working with: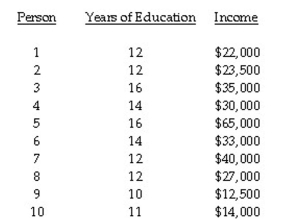
Compute the appropriate correlation coefficient.
A social researcher is interested in studying the relationship between years of education and income. Here are the data he is working with:
Compute the appropriate correlation coefficient.

Unlock Deck
Sign up to unlock the cards in this deck!
Unlock Deck
Unlock Deck
1/47
Play
Full screen (f)
Deck 10: Correlation
1
In statistics, r is called:
A)Yate's correction.
B)Franklin's fudge factor.
C)Pearson's correlation coefficient.
D)Pearson's correlation correction.
A)Yate's correction.
B)Franklin's fudge factor.
C)Pearson's correlation coefficient.
D)Pearson's correlation correction.
Pearson's correlation coefficient.
2
The strength of a correlation is indicated by:
A)its sign (+ or - ).
B)its numerical value.
C)both a and b
D)none of the above
A)its sign (+ or - ).
B)its numerical value.
C)both a and b
D)none of the above
its numerical value.
3
Choose the weakest correlation:
A)-.28
B)-.76
C)+.66
D)+.1 2
A)-.28
B)-.76
C)+.66
D)+.1 2
+.1 2
4
If the variable Crime increases as the variable Police decreases, the correlation is said to Be:
A)positive.
B)negative.
C)weak.
D )curvilinear.
A)positive.
B)negative.
C)weak.
D )curvilinear.
Unlock Deck
Unlock for access to all 47 flashcards in this deck.
Unlock Deck
k this deck
5
A strong straight-line correlation between variables X and Y implies:
A)high scores on X are associated with high scores on Y.
B)low scores on X are associated with low scores on Y.
C)X is a good predictor of Y.
D)X is not good predictor of Y.
A)high scores on X are associated with high scores on Y.
B)low scores on X are associated with low scores on Y.
C)X is a good predictor of Y.
D)X is not good predictor of Y.
Unlock Deck
Unlock for access to all 47 flashcards in this deck.
Unlock Deck
k this deck
6
If the variable Tasty remains constant as variable Cost increases, the correlation is said to Be:
A)positive.
B)negative.
C)weak.
D)zero.
A)positive.
B)negative.
C)weak.
D)zero.
Unlock Deck
Unlock for access to all 47 flashcards in this deck.
Unlock Deck
k this deck
7
An important first step to visualize the relationship of two interval level variables is to:
A)calculate a correlation coefficient.
B)look at a scatter plot.
C)do a test of significance.
D)calculate the variance of the independent variable.
A)calculate a correlation coefficient.
B)look at a scatter plot.
C)do a test of significance.
D)calculate the variance of the independent variable.
Unlock Deck
Unlock for access to all 47 flashcards in this deck.
Unlock Deck
k this deck
8
Choose the strongest correlation:
A)-.28
B)-.76
C)+.66
D)+.1 2
A)-.28
B)-.76
C)+.66
D)+.1 2
Unlock Deck
Unlock for access to all 47 flashcards in this deck.
Unlock Deck
k this deck
9
If a correlation between variables A and B is found to be equal to -1.16:
A)the relationship is negative.
B)the relationship is significant.
C)there has been a miscalculation.
D)none of the above
A)the relationship is negative.
B)the relationship is significant.
C)there has been a miscalculation.
D)none of the above
Unlock Deck
Unlock for access to all 47 flashcards in this deck.
Unlock Deck
k this deck
10
If TV viewing initially decreases with age, but then after age 40 reverses itself, this Correlation would be an example of:
A)a positive relationship.
B)a negative relationship.
C)a curvilinear relationship.
D )cannot tell from the above information
A)a positive relationship.
B)a negative relationship.
C)a curvilinear relationship.
D )cannot tell from the above information
Unlock Deck
Unlock for access to all 47 flashcards in this deck.
Unlock Deck
k this deck
11
The strength of the correlation is indicated by:
A)its sign (+ or - ).
B)its numerical value.
C)both a and b
D)none of the above
A)its sign (+ or - ).
B)its numerical value.
C)both a and b
D)none of the above
Unlock Deck
Unlock for access to all 47 flashcards in this deck.
Unlock Deck
k this deck
12
The correlation coefficient:
A)presents the strength of the relationship.
B)presents the direction of the relationship.
C)varies from -1.0 to +1.0.
D)all of the above
A)presents the strength of the relationship.
B)presents the direction of the relationship.
C)varies from -1.0 to +1.0.
D)all of the above
Unlock Deck
Unlock for access to all 47 flashcards in this deck.
Unlock Deck
k this deck
13
Correlation can vary with respect to:
A)time.
B)direction.
C)strength.
D)b and c
A)time.
B)direction.
C)strength.
D)b and c
Unlock Deck
Unlock for access to all 47 flashcards in this deck.
Unlock Deck
k this deck
14
Which statement is NOT true of correlation coefficients?
A)Correlations can never exceed 1.0.
B)Correlations provide statements of causation.
C)Correlations can be negative.
D )All of the above are true.
A)Correlations can never exceed 1.0.
B)Correlations provide statements of causation.
C)Correlations can be negative.
D )All of the above are true.
Unlock Deck
Unlock for access to all 47 flashcards in this deck.
Unlock Deck
k this deck
15
If the variable Wealth increases as the variable Education increases, the correlation is said To be:
A)positive.
B)negative.
C)strong.
D )curvilinear.
A)positive.
B)negative.
C)strong.
D )curvilinear.
Unlock Deck
Unlock for access to all 47 flashcards in this deck.
Unlock Deck
k this deck
16
Pearson's r is useful for detecting a relationship that is:
A)strong and positive.
B)strong and negative.
C)curvilinear.
D)a and b
A)strong and positive.
B)strong and negative.
C)curvilinear.
D)a and b
Unlock Deck
Unlock for access to all 47 flashcards in this deck.
Unlock Deck
k this deck
17
A negative correlation between variables X and Y implies:
A)high scores on X are associated with high scores on Y.
B)high scores on X are associated with low scores on Y.
C)low scores on X are associated with low scores on Y.
D)the variables X and Y are not strongly related.
A)high scores on X are associated with high scores on Y.
B)high scores on X are associated with low scores on Y.
C)low scores on X are associated with low scores on Y.
D)the variables X and Y are not strongly related.
Unlock Deck
Unlock for access to all 47 flashcards in this deck.
Unlock Deck
k this deck
18
A positive correlation between variables X and Y implies:
A)high scores on X are associated with high scores on Y.
B)high scores on X are associated with low scores on Y.
C)low scores on X are associated with high scores on Y.
D)the variables X and Y are not strongly related.
A)high scores on X are associated with high scores on Y.
B)high scores on X are associated with low scores on Y.
C)low scores on X are associated with high scores on Y.
D)the variables X and Y are not strongly related.
Unlock Deck
Unlock for access to all 47 flashcards in this deck.
Unlock Deck
k this deck
19
If the variable Attractiveness increases as the variable Weight remains constant, the Correlation is said to be:
A)positive.
B)negative.
C)strong.
D)zero.
A)positive.
B)negative.
C)strong.
D)zero.
Unlock Deck
Unlock for access to all 47 flashcards in this deck.
Unlock Deck
k this deck
20
The direction of a correlation is indicated by:
A)its sign (+ or - ).
B)its numerical value.
C)both a and b
D)none of the above
A)its sign (+ or - ).
B)its numerical value.
C)both a and b
D)none of the above
Unlock Deck
Unlock for access to all 47 flashcards in this deck.
Unlock Deck
k this deck
21
A weak correlation coefficient could result from a curvilinear relationship.
Unlock Deck
Unlock for access to all 47 flashcards in this deck.
Unlock Deck
k this deck
22
The population correlation is known as:
A)row (ρ)
B)rho (ρ)
C)roe (θ)
D)theta (θ)
A)row (ρ)
B)rho (ρ)
C)roe (θ)
D)theta (θ)
Unlock Deck
Unlock for access to all 47 flashcards in this deck.
Unlock Deck
k this deck
23
The question below refers to the following information:
A professor is interested in knowing if the number of absences a student has during the semester is a good indication of how well a student does on the final exam. At the end of the year, the professor compares absence rates and exam grades for eight students. The data she found are as follows:
Is the correlation statistically significant and, if so, at what level?
Unlock Deck
Unlock for access to all 47 flashcards in this deck.
Unlock Deck
k this deck
24
The question below refers to the following information:
A professor is interested in knowing if the number of absences a student has during the semester is a good indication of how well a student does on the final exam. At the end of the year, the professor compares absence rates and exam grades for eight students. The data she found are as follows:
Calculate t in order to see if the correlation is statistically significant.
Unlock Deck
Unlock for access to all 47 flashcards in this deck.
Unlock Deck
k this deck
25
Pearson's r is only useful for detecting a __________ line relationship.
Unlock Deck
Unlock for access to all 47 flashcards in this deck.
Unlock Deck
k this deck
26
Testing the significance of Pearson's r requires both X and Y variables to be __________ distributed in the population.
Unlock Deck
Unlock for access to all 47 flashcards in this deck.
Unlock Deck
k this deck
27
The question below refers to the following information:
A professor is interested in knowing if the number of absences a student has during the semester is a good indication of how well a student does on the final exam. At the end of the year, the professor compares absence rates and exam grades for eight students. The data she found are as follows:
The correlation for the above data has a __________ direction.
Unlock Deck
Unlock for access to all 47 flashcards in this deck.
Unlock Deck
k this deck
28
The closer the correlation coefficient is to __________, the weaker the correlation.
Unlock Deck
Unlock for access to all 47 flashcards in this deck.
Unlock Deck
k this deck
29
A correlation coefficient of -.60 is a stronger correlation than a correlation coefficient of +.55
Unlock Deck
Unlock for access to all 47 flashcards in this deck.
Unlock Deck
k this deck
30
The closer the correlation coefficient is to 1 or -1, the __________ the correlation.
Unlock Deck
Unlock for access to all 47 flashcards in this deck.
Unlock Deck
k this deck
31
The question below refers to the following information:
A professor is interested in knowing if the number of absences a student has during the semester is a good indication of how well a student does on the final exam. At the end of the year, the professor compares absence rates and exam grades for eight students. The data she found are as follows:
What is the research hypothesis?
Unlock Deck
Unlock for access to all 47 flashcards in this deck.
Unlock Deck
k this deck
32
The question below refers to the following information:
A professor is interested in knowing if the number of absences a student has during the semester is a good indication of how well a student does on the final exam. At the end of the year, the professor compares absence rates and exam grades for eight students. The data she found are as follows:
Calculate the Pearson's correlation coefficient.
Unlock Deck
Unlock for access to all 47 flashcards in this deck.
Unlock Deck
k this deck
33
Pearson's correlation coefficient assesses the strength and direction of curvilinear relationships.
Unlock Deck
Unlock for access to all 47 flashcards in this deck.
Unlock Deck
k this deck
34
A Person's r of .71 for Age and Attention Span would be an example of a __________ correlation.
Unlock Deck
Unlock for access to all 47 flashcards in this deck.
Unlock Deck
k this deck
35
Correlation coefficients do NOT indicate the strength of a relationship.
Unlock Deck
Unlock for access to all 47 flashcards in this deck.
Unlock Deck
k this deck
36
__________ correlations have a Pearson's r of 1 or -1.
Unlock Deck
Unlock for access to all 47 flashcards in this deck.
Unlock Deck
k this deck
37
For Pearson's r, both X and Y variables must be measured at the __________ level.
Unlock Deck
Unlock for access to all 47 flashcards in this deck.
Unlock Deck
k this deck
38
A Person's r of -.86 for Bigotry and Attractiveness would be an example of a __________ correlation.
Unlock Deck
Unlock for access to all 47 flashcards in this deck.
Unlock Deck
k this deck
39
To calculate for the significance of Pearson's r, one can use the __________ ratio.
Unlock Deck
Unlock for access to all 47 flashcards in this deck.
Unlock Deck
k this deck
40
The question below refers to the following information:
A professor is interested in knowing if the number of absences a student has during the semester is a good indication of how well a student does on the final exam. At the end of the year, the professor compares absence rates and exam grades for eight students. The data she found are as follows:
What is the null hypothesis?
Unlock Deck
Unlock for access to all 47 flashcards in this deck.
Unlock Deck
k this deck
41
Calculate the Pearson's correlation coefficient for the following set of matched (x,y) data:
(4,6) (4,9) (3,5) (5,3) (9,4) (7,7)
(4,6) (4,9) (3,5) (5,3) (9,4) (7,7)
Unlock Deck
Unlock for access to all 47 flashcards in this deck.
Unlock Deck
k this deck
42
Calculate the Pearson's r of the following set of data:
Unlock Deck
Unlock for access to all 47 flashcards in this deck.
Unlock Deck
k this deck
43
An administrator at a university is interested in studying the relationship between student satisfaction at the university(on a 1-10 scale) and the student's GPA. Here are the data she collected:
Compute the Pearson's r and test the significance of the obtained correlation (use α = .05) using Table F of Appendix C.
Compute the Pearson's r and test the significance of the obtained correlation (use α = .05) using Table F of Appendix C.
Unlock Deck
Unlock for access to all 47 flashcards in this deck.
Unlock Deck
k this deck
44
The question below refers to the following information:
A professor is interested in knowing if the number of absences a student has during the semester is a good indication of how well a student does on the final exam. At the end of the year, the professor compares absence rates and exam grades for eight students. The data she found are as follows:
What are your conclusions about the null hypothesis?
Unlock Deck
Unlock for access to all 47 flashcards in this deck.
Unlock Deck
k this deck
45
The question below refers to the following situation:
A social researcher is interested in studying the relationship between years of education and income. Here are the data he is working with:
Test the significance of the obtained correlation (use α = .05) using Table F of Appendix C.
A social researcher is interested in studying the relationship between years of education and income. Here are the data he is working with:
Test the significance of the obtained correlation (use α = .05) using Table F of Appendix C.
Unlock Deck
Unlock for access to all 47 flashcards in this deck.
Unlock Deck
k this deck
46
Use the following data to calculate the Pearson's r and test the significance of the obtained correlation (use α = .05) using Table F of Appendix C:
Unlock Deck
Unlock for access to all 47 flashcards in this deck.
Unlock Deck
k this deck
47
The question below refers to the following situation:
A social researcher is interested in studying the relationship between years of education and income. Here are the data he is working with:
Compute the appropriate correlation coefficient.
A social researcher is interested in studying the relationship between years of education and income. Here are the data he is working with:
Compute the appropriate correlation coefficient.
Unlock Deck
Unlock for access to all 47 flashcards in this deck.
Unlock Deck
k this deck
Unlock Deck
Unlock for access to all 47 flashcards in this deck.


