Deck 15: Graphs, Charts, and Numbers: the Data Show and Tell
Full screen (f)
Question
You and several friends in your dorm are having a jalapeño eating competition. You each record the number of jalapeños that you can eat in one minute. 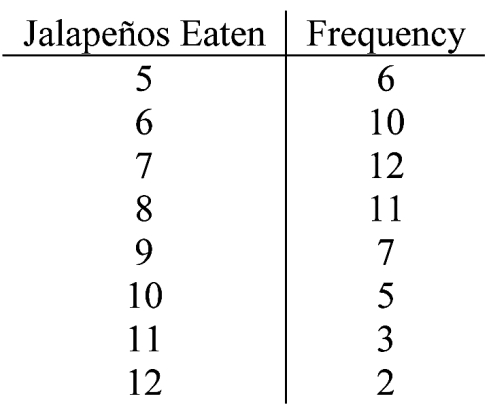
Refer to the situation described above ; what is the mean number of jalapeños eaten in one
minute? Round your answer to two decimal places.
Refer to the situation described above ; what is the mean number of jalapeños eaten in one
minute? Round your answer to two decimal places.
Question
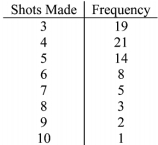
You and several friends in your dorm are having a free-throw shooting competition. You each shoot ten free-throws and record the number of shots made.
Refer to the situation described above ; what is the first quartile or Q1 number of shots made?
Refer to the situation described above ; what is the first quartile or Q1 number of shots made?
Question
The histogram shown below gives the final exam grade, as a percent, for a Finite Math class with 26
students.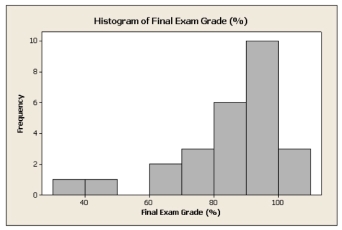
Refer to the situation above ; you are not able to determine the exact value of either the mean or
the median, but you should be able to get a sense of where they lie based on the graph. Knowing this,
which one of these two measures would be larger, the mean or the median? Explain.
students.
Refer to the situation above ; you are not able to determine the exact value of either the mean or
the median, but you should be able to get a sense of where they lie based on the graph. Knowing this,
which one of these two measures would be larger, the mean or the median? Explain.
Question
You and several friends in your dorm are having a jalapeño eating competition. You each record the number of jalapeños that you can eat in one minute.
Refer to the situation described above ; what is the median number of jalapeños eaten in one
minute?
Refer to the situation described above ; what is the median number of jalapeños eaten in one
minute?
Question
You and several friends in your dorm are having a jalapeño eating competition. You each record the number of jalapeños that you can eat in one minute.
Refer to the situation described above; what is the first quartile or Q1 number of jalapeños eaten
in one minute?
Refer to the situation described above; what is the first quartile or Q1 number of jalapeños eaten
in one minute?
Question
You and several friends in your dorm are having a jalapeño eating competition. You each record the number of jalapeños that you can eat in one minute.
Refer to the situation described above ; what is the 80th percentile of jalapeños eaten?
Refer to the situation described above ; what is the 80th percentile of jalapeños eaten?
Question
The pie-chart shown below gives the responses answered on Question 12 of a recent Finite Math final exam. The question was a multiple choice question with options (A, B, C, D, or E). Assuming that the graph was created correctly, what number of responses had option B as the choice? Note that the angle measures for each pie slice are given. 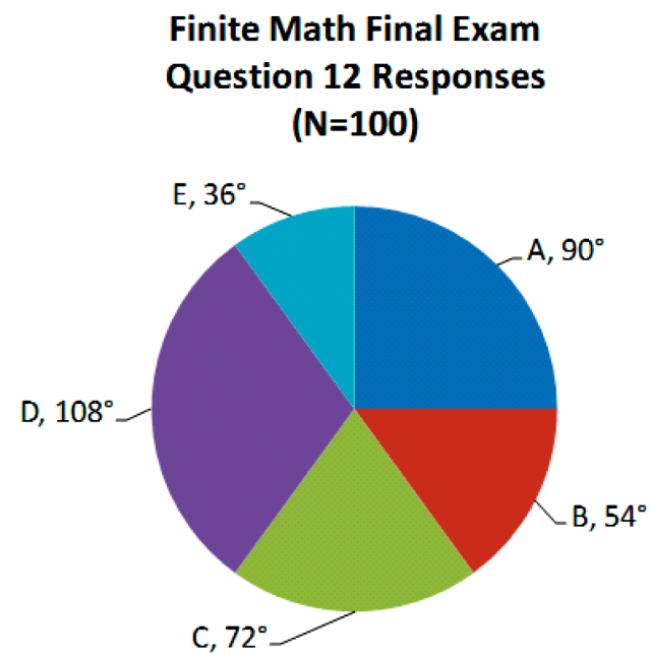
Question
You and several friends in your dorm are having a free-throw shooting competition. You each shoot ten free-throws and record the number of shots made.
Refer to the situation described above ; what is the mean number of shots made? Round your
answer to two decimal places.
Refer to the situation described above ; what is the mean number of shots made? Round your
answer to two decimal places.
Question
You and several friends in your dorm are having a jalapeño eating competition. You each record the number of jalapeños that you can eat in one minute. How many people took part in the jalapeño eating competition?
How many people took part in the jalapeño eating competition? Question
The histogram shown below gives the annual income of 35 recent college graduates. 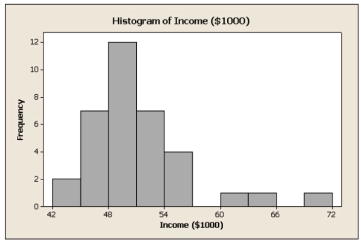 What percent of the recent college graduates have an income of less than $48000 annually? Round
your answer percent answer to the nearest whole number.
What percent of the recent college graduates have an income of less than $48000 annually? Roundyour answer percent answer to the nearest whole number.
Question
Question
The pie-chart shown below gives the responses answered on Question 12 of a recent Finite Math final exam. The question was a multiple choice question with options (A, B, C, D, or E). Assuming that the graph was created correctly, what should be the interior angle measure of the pie-slice representing
choice D?
choice D?
Question
You and several friends in your dorm are having a free-throw shooting competition. You each shoot ten free-throws and record the number of shots made.
Refer to the situation described above ; what is the median number of shots made?
Refer to the situation described above ; what is the median number of shots made?
Question
You and several friends in your dorm are having a free-throw shooting competition. You each shoot ten free-throws and record the number of shots made.
Refer to the situation described above ; what number of shots made is at the 85th percentile?
Refer to the situation described above ; what number of shots made is at the 85th percentile?
Question
Question
The histogram shown below gives the final exam grade, as a percent, for a Finite Math class with 26
students. What percent of the class had a grade at or above an 80%? Round your percent answer to the nearest whole number.
students.
What percent of the class had a grade at or above an 80%? Round your percent answer to the nearest whole number. Question
You and several friends in your dorm are having a free-throw shooting competition. You each shoot ten free-throws and record the number of shots made.
How many people took part in the free-throw shooting competition?
How many people took part in the free-throw shooting competition?
Question
The box-plot shown below was constructed from data regarding the annual salaries of both Opera
singers and Country Western singers.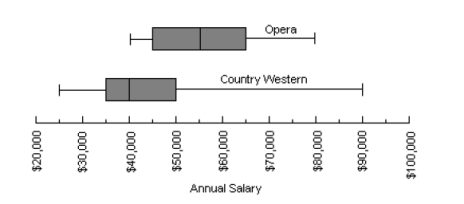 Based on the graph above, is there a larger proportion of Opera singers or a larger proportion of Country Western singers with a salary range above $50,000? Explain.
singers and Country Western singers.
Based on the graph above, is there a larger proportion of Opera singers or a larger proportion of Country Western singers with a salary range above $50,000? Explain. Question
The box-plot shown below was constructed from data regarding the starting salaries, in thousands of dollars, of both Civil and Electrical Engineers. Starting Salaries of Civil and Electrical Engineers 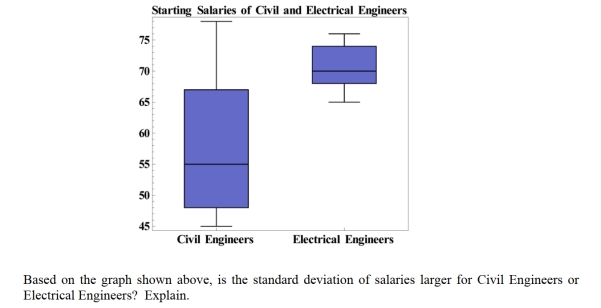
Based on the graph shown above, is the standard deviation of salaries larger for Civil Engineers or
Electrical Engineers? Explain
Based on the graph shown above, is the standard deviation of salaries larger for Civil Engineers or
Electrical Engineers? Explain
Question
Question
The histogram shown below gives the heights of 27 recent college graduates. 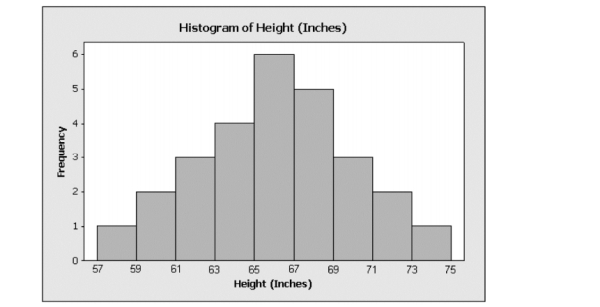
Refer to the situation in above ; the median height is within which interval?
A) 63 inches to 65 inches
B) 65 inches to 67 inches
C) 67 inches to 69 inches
D) Can't determine from this graph.
E) None of the above.
Refer to the situation in above ; the median height is within which interval?
A) 63 inches to 65 inches
B) 65 inches to 67 inches
C) 67 inches to 69 inches
D) Can't determine from this graph.
E) None of the above.
Question
In order to qualify for the game show Jeopardy, each contestant must complete a grueling six-hour exam. The results for the latest round of testing are given below. 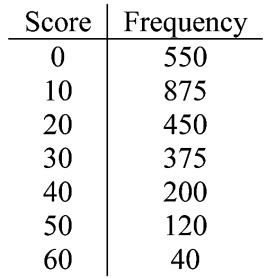
Refer to the situation described above ; what is the score of the exam found at the 65th percentile?
A) 0
B) 10
C) 20
D) 30
E) None of the above.
Refer to the situation described above ; what is the score of the exam found at the 65th percentile?
A) 0
B) 10
C) 20
D) 30
E) None of the above.
Question
The pie-chart shown below gives the responses answered on Question 12 of a recent Finite Math final exam. The question was a multiple choice question with options (A, B, C, D, or E). Assuming that the graph was created correctly, what number of responses had option D as the choice? Note that the angle measures for each pie slice are given. 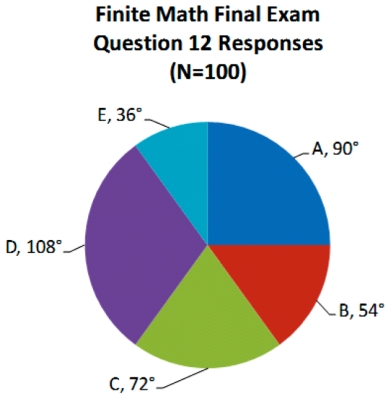 (a) 30
(b) 36
(c) 60
(d) 108
(e) None of the above.
(a) 30(b) 36
(c) 60
(d) 108
(e) None of the above.
Question
The members of the golf club at your university decide to have a friendly golf competition. Each member plays 18 holes at a local golf course and records his or her score. 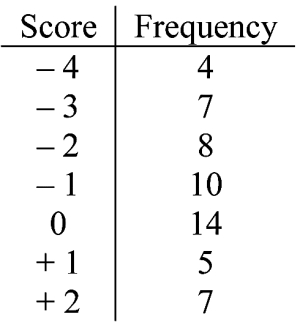
Refer to the situation described above ; what was the median golf score?
A) - 2
B) - 1
C) 0
D) + 1
E) None of the above.
Refer to the situation described above ; what was the median golf score?
A) - 2
B) - 1
C) 0
D) + 1
E) None of the above.
Question
Question
In order to qualify for the game show Jeopardy, each contestant must complete a grueling six-hour exam. The results for the latest round of testing are given below.
Refer to the situation described above ; what was the first quartile or Q1 of the exam scores?
A) 10
B) 20
C) 30
D) 40
E) None of the above.
Refer to the situation described above ; what was the first quartile or Q1 of the exam scores?
A) 10
B) 20
C) 30
D) 40
E) None of the above.
Question
In order to qualify for the game show Jeopardy, each contestant must complete a grueling six-hour exam. The results for the latest round of testing are given below.
Refer to the situation described above ; what was the mean exam score? Round your answer to one decimal place.
A) 16.2
B) 16.8
C) 17.1
D) 17.4
E) None of the above.
Refer to the situation described above ; what was the mean exam score? Round your answer to one decimal place.
A) 16.2
B) 16.8
C) 17.1
D) 17.4
E) None of the above.
Question
The box-plot shown below was constructed from data regarding the annual salaries of both Opera singers and Country Western singers.  Based on the graph shown above, what is the inter-quartile range of annual salaries for Opera signers?
A) $15000
B) $20000
C) $45000
D) $66000
E) None of the above.
Based on the graph shown above, what is the inter-quartile range of annual salaries for Opera signers? A) $15000
B) $20000
C) $45000
D) $66000
E) None of the above.
Question
The members of the golf club at your university decide to have a friendly golf competition. Each member plays 18 holes at a local golf course and records his or her score.
Refer to the situation described above ; what was the first quartile or Q1 of the golf scores?
A) - 3
B) - 2
C) - 1
D) 0
E) None of the above.
Refer to the situation described above ; what was the first quartile or Q1 of the golf scores?
A) - 3
B) - 2
C) - 1
D) 0
E) None of the above.
Question
In order to qualify for the game show Jeopardy, each contestant must complete a grueling six-hour exam. The results for the latest round of testing are given below.
Refer to the situation described above ; what was the median exam score?
A) 10
B) 15
C) 20
D) 25
E) None of the above.
Refer to the situation described above ; what was the median exam score?
A) 10
B) 15
C) 20
D) 25
E) None of the above.
Question
The members of the golf club at your university decide to have a friendly golf competition. Each member plays 18 holes at a local golf course and records his or her score.
Refer to the situation described above ; what was the mean golf score? Round your answer to one decimal place.
A) - 1.2
B) - 1
C) - 0.8
D) + 0.6
E) None of the above.
Refer to the situation described above ; what was the mean golf score? Round your answer to one decimal place.
A) - 1.2
B) - 1
C) - 0.8
D) + 0.6
E) None of the above.
Question
The histogram shown below gives the annual income of 35 recent college graduates. 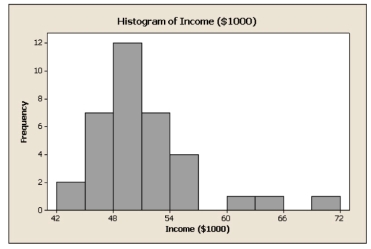
Refer to the situation in above ; based on the shape of the histogram, which of the following is the best answer?
A) median is less than the mean
B) median is greater than the mean
C) median is roughly equivalent than the mean
D) median is greater than $60000
E) None of the above.
Refer to the situation in above ; based on the shape of the histogram, which of the following is the best answer?
A) median is less than the mean
B) median is greater than the mean
C) median is roughly equivalent than the mean
D) median is greater than $60000
E) None of the above.
Question
The members of the golf club at your university decide to have a friendly golf competition. Each member plays 18 holes at a local golf course and records his or her score.
Refer to the situation described above ; what score is at the 75th percentile?
A) -2
B) -1
C) 0
D) 14
E) None of the above.
Refer to the situation described above ; what score is at the 75th percentile?
A) -2
B) -1
C) 0
D) 14
E) None of the above.
Question
The pie-chart shown below gives the responses answered on Question 12 of a recent Finite Math final exam. The question was a multiple choice question with options (A, B, C, D, or E). Assuming that the Graph was created correctly, what should be the interior angle measure of the pie-slice representing Choice C?
A) 57°
B) 68°
C) 72°
D) 84°
E) None of the above.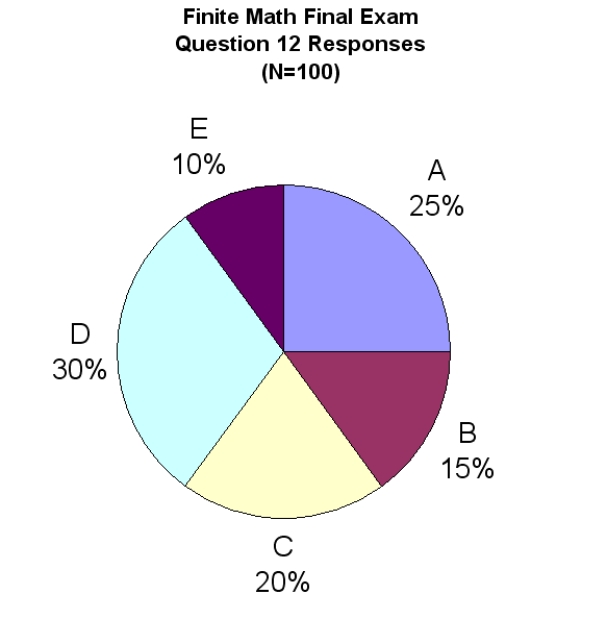
A) 57°
B) 68°
C) 72°
D) 84°
E) None of the above.
Question
The histogram shown below gives the heights of 27 recent college graduates. What percent of the recent college graduates are 67 inches or taller?
A) 11%
B) 16%
C) 28%
D) 41%
E) None of the above.
What percent of the recent college graduates are 67 inches or taller? A) 11%
B) 16%
C) 28%
D) 41%
E) None of the above.
Question
The members of the golf club at your university decide to have a friendly golf competition. Each member plays 18 holes at a local golf course and records his or her score. How many people took part in the golf competition?
A) 48
B) 53
C) 55
D) 62
E) None of the above.
How many people took part in the golf competition? A) 48
B) 53
C) 55
D) 62
E) None of the above.
Question
The histogram shown below gives the annual income of 35 recent college graduates. What percent of the recent college graduates have an income of $54000 or more annually?
A) 2%
B) 7%
C) 23%
D) 67%
E) None of the above.
What percent of the recent college graduates have an income of $54000 or more annually? A) 2%
B) 7%
C) 23%
D) 67%
E) None of the above.
Question
In order to qualify for the game show Jeopardy, each contestant must complete a grueling six-hour exam. The results for the latest round of testing are given below. How many people took the qualifying exam?
A) 210
B) 2550
C) 2610
D) 45400
E) None of the above.
How many people took the qualifying exam? A) 210
B) 2550
C) 2610
D) 45400
E) None of the above.
Question
Question
The box-plot shown below was constructed from data regarding the starting salaries, in thousands of dollars, of both Civil and Electrical Engineers. Starting Salaries of Civil and Electrical Engineers 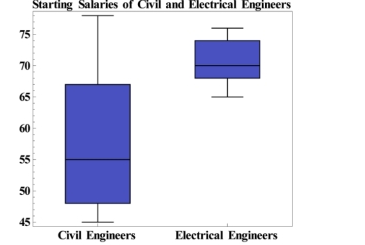
Based on the graph shown above, what is the median starting salary of Electrical Engineers?
A) $35000
B) $40000
C) $50000
D) Can't determine from this graph.
E) None of the above.
Based on the graph shown above, what is the median starting salary of Electrical Engineers?
A) $35000
B) $40000
C) $50000
D) Can't determine from this graph.
E) None of the above.

Unlock Deck
Sign up to unlock the cards in this deck!
Unlock Deck
Unlock Deck
1/40
Play
Full screen (f)
Deck 15: Graphs, Charts, and Numbers: the Data Show and Tell
1
You and several friends in your dorm are having a jalapeño eating competition. You each record the number of jalapeños that you can eat in one minute.
Refer to the situation described above ; what is the mean number of jalapeños eaten in one
minute? Round your answer to two decimal places.
Refer to the situation described above ; what is the mean number of jalapeños eaten in one
minute? Round your answer to two decimal places.
7.71 jalapeños eaten
2
You and several friends in your dorm are having a free-throw shooting competition. You each shoot ten free-throws and record the number of shots made.
Refer to the situation described above ; what is the first quartile or Q1 number of shots made?
Refer to the situation described above ; what is the first quartile or Q1 number of shots made?
3 shots made
3
The histogram shown below gives the final exam grade, as a percent, for a Finite Math class with 26
students.
Refer to the situation above ; you are not able to determine the exact value of either the mean or
the median, but you should be able to get a sense of where they lie based on the graph. Knowing this,
which one of these two measures would be larger, the mean or the median? Explain.
students.
Refer to the situation above ; you are not able to determine the exact value of either the mean or
the median, but you should be able to get a sense of where they lie based on the graph. Knowing this,
which one of these two measures would be larger, the mean or the median? Explain.
The median would be larger because
the mean gets pulled away from it by
the skew.
the mean gets pulled away from it by
the skew.
4
You and several friends in your dorm are having a jalapeño eating competition. You each record the number of jalapeños that you can eat in one minute.
Refer to the situation described above ; what is the median number of jalapeños eaten in one
minute?
Refer to the situation described above ; what is the median number of jalapeños eaten in one
minute?
Unlock Deck
Unlock for access to all 40 flashcards in this deck.
Unlock Deck
k this deck
5
You and several friends in your dorm are having a jalapeño eating competition. You each record the number of jalapeños that you can eat in one minute.
Refer to the situation described above; what is the first quartile or Q1 number of jalapeños eaten
in one minute?
Refer to the situation described above; what is the first quartile or Q1 number of jalapeños eaten
in one minute?
Unlock Deck
Unlock for access to all 40 flashcards in this deck.
Unlock Deck
k this deck
6
You and several friends in your dorm are having a jalapeño eating competition. You each record the number of jalapeños that you can eat in one minute.
Refer to the situation described above ; what is the 80th percentile of jalapeños eaten?
Refer to the situation described above ; what is the 80th percentile of jalapeños eaten?
Unlock Deck
Unlock for access to all 40 flashcards in this deck.
Unlock Deck
k this deck
7
The pie-chart shown below gives the responses answered on Question 12 of a recent Finite Math final exam. The question was a multiple choice question with options (A, B, C, D, or E). Assuming that the graph was created correctly, what number of responses had option B as the choice? Note that the angle measures for each pie slice are given.
Unlock Deck
Unlock for access to all 40 flashcards in this deck.
Unlock Deck
k this deck
8
You and several friends in your dorm are having a free-throw shooting competition. You each shoot ten free-throws and record the number of shots made.
Refer to the situation described above ; what is the mean number of shots made? Round your
answer to two decimal places.
Refer to the situation described above ; what is the mean number of shots made? Round your
answer to two decimal places.
Unlock Deck
Unlock for access to all 40 flashcards in this deck.
Unlock Deck
k this deck
9
You and several friends in your dorm are having a jalapeño eating competition. You each record the number of jalapeños that you can eat in one minute. How many people took part in the jalapeño eating competition?
How many people took part in the jalapeño eating competition? Unlock Deck
Unlock for access to all 40 flashcards in this deck.
Unlock Deck
k this deck
10
The histogram shown below gives the annual income of 35 recent college graduates. What percent of the recent college graduates have an income of less than $48000 annually? Round
your answer percent answer to the nearest whole number.
What percent of the recent college graduates have an income of less than $48000 annually? Roundyour answer percent answer to the nearest whole number.
Unlock Deck
Unlock for access to all 40 flashcards in this deck.
Unlock Deck
k this deck
11
The data shown below represents the annual salaries, in thousands of dollars, of five administrators at your university. {130,140,175,200,210} What is the standard deviation of the salaries? Round your answer to two decimal places.
Unlock Deck
Unlock for access to all 40 flashcards in this deck.
Unlock Deck
k this deck
12
The pie-chart shown below gives the responses answered on Question 12 of a recent Finite Math final exam. The question was a multiple choice question with options (A, B, C, D, or E). Assuming that the graph was created correctly, what should be the interior angle measure of the pie-slice representing
choice D?
choice D?
Unlock Deck
Unlock for access to all 40 flashcards in this deck.
Unlock Deck
k this deck
13
You and several friends in your dorm are having a free-throw shooting competition. You each shoot ten free-throws and record the number of shots made.
Refer to the situation described above ; what is the median number of shots made?
Refer to the situation described above ; what is the median number of shots made?
Unlock Deck
Unlock for access to all 40 flashcards in this deck.
Unlock Deck
k this deck
14
You and several friends in your dorm are having a free-throw shooting competition. You each shoot ten free-throws and record the number of shots made.
Refer to the situation described above ; what number of shots made is at the 85th percentile?
Refer to the situation described above ; what number of shots made is at the 85th percentile?
Unlock Deck
Unlock for access to all 40 flashcards in this deck.
Unlock Deck
k this deck
15
The data shown below represents the annual salaries, in thousands of dollars, of the ten administrators at your university. {165,170,170,180,195,200,205,220,240,300}
Suppose that each salary is increased by $5,000. How would this change the variance of the data set?
Suppose that each salary is increased by $5,000. How would this change the variance of the data set?
Unlock Deck
Unlock for access to all 40 flashcards in this deck.
Unlock Deck
k this deck
16
The histogram shown below gives the final exam grade, as a percent, for a Finite Math class with 26
students. What percent of the class had a grade at or above an 80%? Round your percent answer to the nearest whole number.
students.
What percent of the class had a grade at or above an 80%? Round your percent answer to the nearest whole number. Unlock Deck
Unlock for access to all 40 flashcards in this deck.
Unlock Deck
k this deck
17
You and several friends in your dorm are having a free-throw shooting competition. You each shoot ten free-throws and record the number of shots made.
How many people took part in the free-throw shooting competition?
How many people took part in the free-throw shooting competition?
Unlock Deck
Unlock for access to all 40 flashcards in this deck.
Unlock Deck
k this deck
18
The box-plot shown below was constructed from data regarding the annual salaries of both Opera
singers and Country Western singers. Based on the graph above, is there a larger proportion of Opera singers or a larger proportion of Country Western singers with a salary range above $50,000? Explain.
singers and Country Western singers.
Based on the graph above, is there a larger proportion of Opera singers or a larger proportion of Country Western singers with a salary range above $50,000? Explain. Unlock Deck
Unlock for access to all 40 flashcards in this deck.
Unlock Deck
k this deck
19
The box-plot shown below was constructed from data regarding the starting salaries, in thousands of dollars, of both Civil and Electrical Engineers. Starting Salaries of Civil and Electrical Engineers
Based on the graph shown above, is the standard deviation of salaries larger for Civil Engineers or
Electrical Engineers? Explain
Based on the graph shown above, is the standard deviation of salaries larger for Civil Engineers or
Electrical Engineers? Explain
Unlock Deck
Unlock for access to all 40 flashcards in this deck.
Unlock Deck
k this deck
20
Refer to the situation in problem 7; you are not able to determine the exact value of either the mean or
the median, but you should be able to get a sense of where they lie based on the graph. Knowing this,
which one of these two measures would be larger, the mean or the median? Explain.
the median, but you should be able to get a sense of where they lie based on the graph. Knowing this,
which one of these two measures would be larger, the mean or the median? Explain.
Unlock Deck
Unlock for access to all 40 flashcards in this deck.
Unlock Deck
k this deck
21
The histogram shown below gives the heights of 27 recent college graduates.
Refer to the situation in above ; the median height is within which interval?
A) 63 inches to 65 inches
B) 65 inches to 67 inches
C) 67 inches to 69 inches
D) Can't determine from this graph.
E) None of the above.
Refer to the situation in above ; the median height is within which interval?
A) 63 inches to 65 inches
B) 65 inches to 67 inches
C) 67 inches to 69 inches
D) Can't determine from this graph.
E) None of the above.
Unlock Deck
Unlock for access to all 40 flashcards in this deck.
Unlock Deck
k this deck
22
In order to qualify for the game show Jeopardy, each contestant must complete a grueling six-hour exam. The results for the latest round of testing are given below.
Refer to the situation described above ; what is the score of the exam found at the 65th percentile?
A) 0
B) 10
C) 20
D) 30
E) None of the above.
Refer to the situation described above ; what is the score of the exam found at the 65th percentile?
A) 0
B) 10
C) 20
D) 30
E) None of the above.
Unlock Deck
Unlock for access to all 40 flashcards in this deck.
Unlock Deck
k this deck
23
The pie-chart shown below gives the responses answered on Question 12 of a recent Finite Math final exam. The question was a multiple choice question with options (A, B, C, D, or E). Assuming that the graph was created correctly, what number of responses had option D as the choice? Note that the angle measures for each pie slice are given. (a) 30
(b) 36
(c) 60
(d) 108
(e) None of the above.
(a) 30(b) 36
(c) 60
(d) 108
(e) None of the above.
Unlock Deck
Unlock for access to all 40 flashcards in this deck.
Unlock Deck
k this deck
24
The members of the golf club at your university decide to have a friendly golf competition. Each member plays 18 holes at a local golf course and records his or her score.
Refer to the situation described above ; what was the median golf score?
A) - 2
B) - 1
C) 0
D) + 1
E) None of the above.
Refer to the situation described above ; what was the median golf score?
A) - 2
B) - 1
C) 0
D) + 1
E) None of the above.
Unlock Deck
Unlock for access to all 40 flashcards in this deck.
Unlock Deck
k this deck
25
The data shown below represents the annual salaries, in thousands of dollars, of the top five paid individuals in your university.
{490,500,505,510,520}
What is the standard deviation of the salaries? Round your answer to two decimal places.
A) 125.00 thousand dollars
B) 125.00 (thousand dollars)2
C) 11.18 thousand dollars
D) 11.18 (thousand dollars)2
E) None of the above.
{490,500,505,510,520}
What is the standard deviation of the salaries? Round your answer to two decimal places.
A) 125.00 thousand dollars
B) 125.00 (thousand dollars)2
C) 11.18 thousand dollars
D) 11.18 (thousand dollars)2
E) None of the above.
Unlock Deck
Unlock for access to all 40 flashcards in this deck.
Unlock Deck
k this deck
26
In order to qualify for the game show Jeopardy, each contestant must complete a grueling six-hour exam. The results for the latest round of testing are given below.
Refer to the situation described above ; what was the first quartile or Q1 of the exam scores?
A) 10
B) 20
C) 30
D) 40
E) None of the above.
Refer to the situation described above ; what was the first quartile or Q1 of the exam scores?
A) 10
B) 20
C) 30
D) 40
E) None of the above.
Unlock Deck
Unlock for access to all 40 flashcards in this deck.
Unlock Deck
k this deck
27
In order to qualify for the game show Jeopardy, each contestant must complete a grueling six-hour exam. The results for the latest round of testing are given below.
Refer to the situation described above ; what was the mean exam score? Round your answer to one decimal place.
A) 16.2
B) 16.8
C) 17.1
D) 17.4
E) None of the above.
Refer to the situation described above ; what was the mean exam score? Round your answer to one decimal place.
A) 16.2
B) 16.8
C) 17.1
D) 17.4
E) None of the above.
Unlock Deck
Unlock for access to all 40 flashcards in this deck.
Unlock Deck
k this deck
28
The box-plot shown below was constructed from data regarding the annual salaries of both Opera singers and Country Western singers. Based on the graph shown above, what is the inter-quartile range of annual salaries for Opera signers?
A) $15000
B) $20000
C) $45000
D) $66000
E) None of the above.
Based on the graph shown above, what is the inter-quartile range of annual salaries for Opera signers? A) $15000
B) $20000
C) $45000
D) $66000
E) None of the above.
Unlock Deck
Unlock for access to all 40 flashcards in this deck.
Unlock Deck
k this deck
29
The members of the golf club at your university decide to have a friendly golf competition. Each member plays 18 holes at a local golf course and records his or her score.
Refer to the situation described above ; what was the first quartile or Q1 of the golf scores?
A) - 3
B) - 2
C) - 1
D) 0
E) None of the above.
Refer to the situation described above ; what was the first quartile or Q1 of the golf scores?
A) - 3
B) - 2
C) - 1
D) 0
E) None of the above.
Unlock Deck
Unlock for access to all 40 flashcards in this deck.
Unlock Deck
k this deck
30
In order to qualify for the game show Jeopardy, each contestant must complete a grueling six-hour exam. The results for the latest round of testing are given below.
Refer to the situation described above ; what was the median exam score?
A) 10
B) 15
C) 20
D) 25
E) None of the above.
Refer to the situation described above ; what was the median exam score?
A) 10
B) 15
C) 20
D) 25
E) None of the above.
Unlock Deck
Unlock for access to all 40 flashcards in this deck.
Unlock Deck
k this deck
31
The members of the golf club at your university decide to have a friendly golf competition. Each member plays 18 holes at a local golf course and records his or her score.
Refer to the situation described above ; what was the mean golf score? Round your answer to one decimal place.
A) - 1.2
B) - 1
C) - 0.8
D) + 0.6
E) None of the above.
Refer to the situation described above ; what was the mean golf score? Round your answer to one decimal place.
A) - 1.2
B) - 1
C) - 0.8
D) + 0.6
E) None of the above.
Unlock Deck
Unlock for access to all 40 flashcards in this deck.
Unlock Deck
k this deck
32
The histogram shown below gives the annual income of 35 recent college graduates.
Refer to the situation in above ; based on the shape of the histogram, which of the following is the best answer?
A) median is less than the mean
B) median is greater than the mean
C) median is roughly equivalent than the mean
D) median is greater than $60000
E) None of the above.
Refer to the situation in above ; based on the shape of the histogram, which of the following is the best answer?
A) median is less than the mean
B) median is greater than the mean
C) median is roughly equivalent than the mean
D) median is greater than $60000
E) None of the above.
Unlock Deck
Unlock for access to all 40 flashcards in this deck.
Unlock Deck
k this deck
33
The members of the golf club at your university decide to have a friendly golf competition. Each member plays 18 holes at a local golf course and records his or her score.
Refer to the situation described above ; what score is at the 75th percentile?
A) -2
B) -1
C) 0
D) 14
E) None of the above.
Refer to the situation described above ; what score is at the 75th percentile?
A) -2
B) -1
C) 0
D) 14
E) None of the above.
Unlock Deck
Unlock for access to all 40 flashcards in this deck.
Unlock Deck
k this deck
34
The pie-chart shown below gives the responses answered on Question 12 of a recent Finite Math final exam. The question was a multiple choice question with options (A, B, C, D, or E). Assuming that the Graph was created correctly, what should be the interior angle measure of the pie-slice representing Choice C?
A) 57°
B) 68°
C) 72°
D) 84°
E) None of the above.
A) 57°
B) 68°
C) 72°
D) 84°
E) None of the above.
Unlock Deck
Unlock for access to all 40 flashcards in this deck.
Unlock Deck
k this deck
35
The histogram shown below gives the heights of 27 recent college graduates. What percent of the recent college graduates are 67 inches or taller?
A) 11%
B) 16%
C) 28%
D) 41%
E) None of the above.
What percent of the recent college graduates are 67 inches or taller? A) 11%
B) 16%
C) 28%
D) 41%
E) None of the above.
Unlock Deck
Unlock for access to all 40 flashcards in this deck.
Unlock Deck
k this deck
36
The members of the golf club at your university decide to have a friendly golf competition. Each member plays 18 holes at a local golf course and records his or her score. How many people took part in the golf competition?
A) 48
B) 53
C) 55
D) 62
E) None of the above.
How many people took part in the golf competition? A) 48
B) 53
C) 55
D) 62
E) None of the above.
Unlock Deck
Unlock for access to all 40 flashcards in this deck.
Unlock Deck
k this deck
37
The histogram shown below gives the annual income of 35 recent college graduates. What percent of the recent college graduates have an income of $54000 or more annually?
A) 2%
B) 7%
C) 23%
D) 67%
E) None of the above.
What percent of the recent college graduates have an income of $54000 or more annually? A) 2%
B) 7%
C) 23%
D) 67%
E) None of the above.
Unlock Deck
Unlock for access to all 40 flashcards in this deck.
Unlock Deck
k this deck
38
In order to qualify for the game show Jeopardy, each contestant must complete a grueling six-hour exam. The results for the latest round of testing are given below. How many people took the qualifying exam?
A) 210
B) 2550
C) 2610
D) 45400
E) None of the above.
How many people took the qualifying exam? A) 210
B) 2550
C) 2610
D) 45400
E) None of the above.
Unlock Deck
Unlock for access to all 40 flashcards in this deck.
Unlock Deck
k this deck
39
The data shown below represents the annual salaries, in thousands of dollars, of the top five paid individuals in your university.
{180,190,205,210,300}
Increasing each salary by $25,000 would have what effect on the standard deviation of the salaries?
A) Increase the standard deviation by $25,000.
B) Increase the standard deviation by $5,000.
C) No increase to the standard deviation.
D) There is not enough information to answer the question.
E) None of the above.
Unlock Deck
Unlock for access to all 40 flashcards in this deck.
Unlock Deck
k this deck
40
The box-plot shown below was constructed from data regarding the starting salaries, in thousands of dollars, of both Civil and Electrical Engineers. Starting Salaries of Civil and Electrical Engineers
Based on the graph shown above, what is the median starting salary of Electrical Engineers?
A) $35000
B) $40000
C) $50000
D) Can't determine from this graph.
E) None of the above.
Based on the graph shown above, what is the median starting salary of Electrical Engineers?
A) $35000
B) $40000
C) $50000
D) Can't determine from this graph.
E) None of the above.
Unlock Deck
Unlock for access to all 40 flashcards in this deck.
Unlock Deck
k this deck
Unlock Deck
Unlock for access to all 40 flashcards in this deck.


