Deck 15: Multiple Regression
Full screen (f)
Question
Use the following information for problems
Sales figures (number of units), selling price and amount spent on advertising (as a percentage of total advertising expenditure in the previous quarter) for the popular Sony Bravia Television were obtained for last quarter from a sample of 30 different stores. The results of a multiple regression are presented below.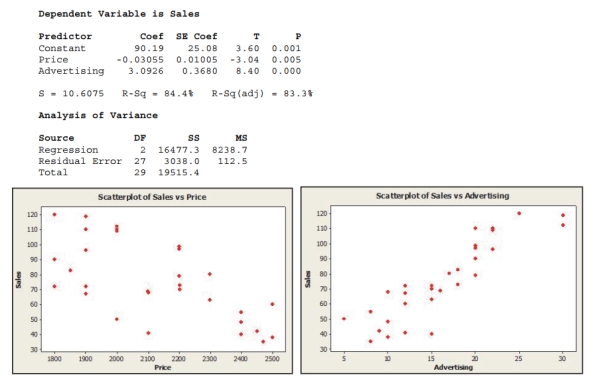
State the hypotheses for testing the regression coefficient of Price. Based on the
results, what do you conclude?
Question
Use the following information for problems
Sales figures (number of units), selling price and amount spent on advertising (as a percentage of total advertising expenditure in the previous quarter) for the popular Sony Bravia Television were obtained for last quarter from a sample of 30 different stores. The results of a multiple regression are presented below.
Write out the estimated regression equation.
Question
Use the following information for problems
To determine what affects turnover rate, a sample of 33 companies was randomly selected and data collected on the average annual bonus and turnover rate (%). In addition, a questionnaire was administered to the employees of each company to arrive at a trust index (measured on a scale of 0 - 100). Below are the multiple regression results.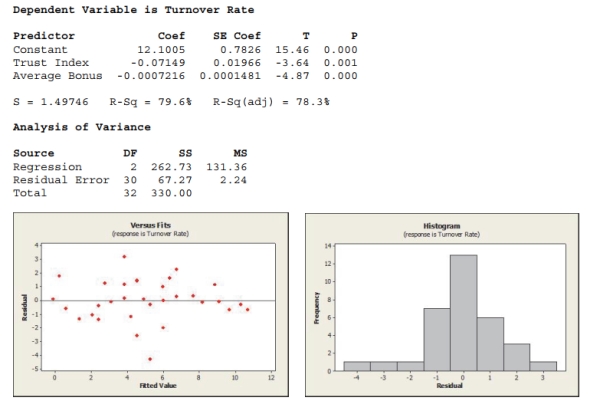
Using this model, the turnover rate for a company with a trust index score of 70 and
an average annual bonus of $6500 is predicted to be 2.41%. If the company observes
a turnover rate of 2.15%, what is the value of the residual for this company? What
does the value of the residual tell you about the prediction?
Question
A sample of 33 companies was randomly selected and data collected on the average annual bonus, turnover rate (%), and trust index (measured on a scale of 0 - 100). According to the output is shown below, what is the estimated multiple regression Model?
Dependent Variable is Turnover Rate
A) Turnover Rate Average Bonus
B) Turnover Rate Average Bonus
C) Turnover Rate Average Bonus
D) Turnover Rate Average Bonus
E) Turnover Rate Average Bonus
Dependent Variable is Turnover Rate
A) Turnover Rate
Average BonusB) Turnover Rate
Average BonusC) Turnover Rate
Average BonusD) Turnover Rate
Average BonusE) Turnover Rate
Average Bonus Question
Use the following information for problems
Sales figures (number of units), selling price and amount spent on advertising (as a percentage of total advertising expenditure in the previous quarter) for the popular Sony Bravia Television were obtained for last quarter from a sample of 30 different stores. The results of a multiple regression are presented below.
Report the adjusted R2 for this model. Write a sentence interpreting this value.
Question
Use the following information for problems
To determine what affects turnover rate, a sample of 33 companies was randomly selected and data collected on the average annual bonus and turnover rate (%). In addition, a questionnaire was administered to the employees of each company to arrive at a trust index (measured on a scale of 0 - 100). Below are the multiple regression results.
State the hypotheses for testing the regression coefficient of Average Annual Bonus.
Based on the results, what do you conclude?
Question
Use the following information for problems
To determine what affects turnover rate, a sample of 33 companies was randomly selected and data collected on the average annual bonus and turnover rate (%). In addition, a questionnaire was administered to the employees of each company to arrive at a trust index (measured on a scale of 0 - 100). Below are the multiple regression results.
Write out the estimated regression equation.
Question
Use the following information for problems
Sales figures (number of units), selling price and amount spent on advertising (as a percentage of total advertising expenditure in the previous quarter) for the popular Sony Bravia Television were obtained for last quarter from a sample of 30 different stores. The results of a multiple regression are presented below.
How much of the variability in Sales is explained by the regression equation?
Question
A sample of 33 companies was randomly selected and data collected on the average annual bonus, turnover rate (%), and trust index (measured on a scale of 0 - 100).
Based on the output, how much of the variability in Turnover Rate is explained by the
Estimated multiple regression model?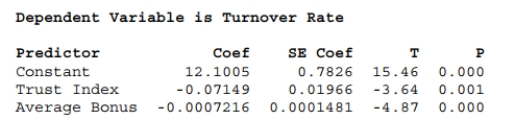
A) 78.3%
B) 79.6%
C) 12.1%
D) 95.4%
E) None of the above.
Based on the output, how much of the variability in Turnover Rate is explained by the
Estimated multiple regression model?
A) 78.3%
B) 79.6%
C) 12.1%
D) 95.4%
E) None of the above.
Question
A sample of 33 companies was randomly selected and a multiple regression model was performed using average annual bonus and trust index (scale of 0 - 100) to
Explain turnover rate. According to the output below, what is the F statistic to
Determine the overall significance of the estimated is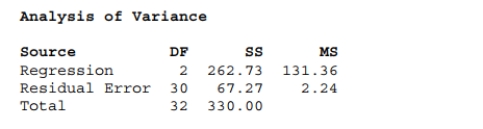
A) 58.64
B) 1.497
C) 131.36
D) 78.3
E) 2.24
Explain turnover rate. According to the output below, what is the F statistic to
Determine the overall significance of the estimated is
A) 58.64
B) 1.497
C) 131.36
D) 78.3
E) 2.24
Question
Use the following information for problems
Sales figures (number of units), selling price and amount spent on advertising (as a percentage of total advertising expenditure in the previous quarter) for the popular Sony Bravia Television were obtained for last quarter from a sample of 30 different stores. The results of a multiple regression are presented below.
Use the F-test to determine whether the slope coefficients are significantly different
from 0. Write the null and alternative hypotheses and calculate the F-statistic.
Question
Use the following information for problems
Sales figures (number of units), selling price and amount spent on advertising (as a percentage of total advertising expenditure in the previous quarter) for the popular Sony Bravia Television were obtained for last quarter from a sample of 30 different stores. The results of a multiple regression are presented below.
Use the scatterplots provided below to check assumptions for multiple regression. For each plot, list the assumption being checked, whether or not it is satisfied, and why.
Question
Use the following information for problems
To determine what affects turnover rate, a sample of 33 companies was randomly selected and data collected on the average annual bonus and turnover rate (%). In addition, a questionnaire was administered to the employees of each company to arrive at a trust index (measured on a scale of 0 - 100). Below are the multiple regression results.
Use the plots provided to check whether conditions for multiple regression are
satisfied. For each plot, list the condition being checked, whether or not it is satisfied,
and why.
Question
A sample of 33 companies was randomly selected and data collected on the average annual bonus, turnover rate (%), and trust index (measured on a scale of 0 - 100). In a Multiple regression estimating turnover rate using average bonus and trust index, What is the correct null hypotheses for testing the regression coefficient of Trust Index?
A)
B)
C)
D)
E)
A)
B)
C)
D)
E)
Question
Use the following information for problems
Sales figures (number of units), selling price and amount spent on advertising (as a percentage of total advertising expenditure in the previous quarter) for the popular Sony Bravia Television were obtained for last quarter from a sample of 30 different stores. The results of a multiple regression are presented below.
Predict the sales for a store that sells the Sony Bravia for $2199 and spends 10% of its
advertising budget on the product.
Question
Use the following information for problems
To determine what affects turnover rate, a sample of 33 companies was randomly selected and data collected on the average annual bonus and turnover rate (%). In addition, a questionnaire was administered to the employees of each company to arrive at a trust index (measured on a scale of 0 - 100). Below are the multiple regression results.
Is the regression equation significant overall? Explain.
Question
Use the following information for problems
To determine what affects turnover rate, a sample of 33 companies was randomly selected and data collected on the average annual bonus and turnover rate (%). In addition, a questionnaire was administered to the employees of each company to arrive at a trust index (measured on a scale of 0 - 100). Below are the multiple regression results.
Write the null and alternative hypotheses for the F-test in this multiple regression
model.
Question
Use the following information for problems
To determine what affects turnover rate, a sample of 33 companies was randomly selected and data collected on the average annual bonus and turnover rate (%). In addition, a questionnaire was administered to the employees of each company to arrive at a trust index (measured on a scale of 0 - 100). Below are the multiple regression results.
State the hypotheses for testing the regression coefficient of Trust Index. Based on
the results, what do you conclude?
Question
Question
Use the following information for problems
To determine what affects turnover rate, a sample of 33 companies was randomly selected and data collected on the average annual bonus and turnover rate (%). In addition, a questionnaire was administered to the employees of each company to arrive at a trust index (measured on a scale of 0 - 100). Below are the multiple regression results.
How much of the variability in Turnover Rate is explained by the regression
equation?
Question
Question
A sample of 33 companies was randomly selected and data collected on the average annual bonus, turnover rate (%), and trust index (measured on a scale of 0 - 100).
Using the output below, and a significance level of α = .01, we can conclude that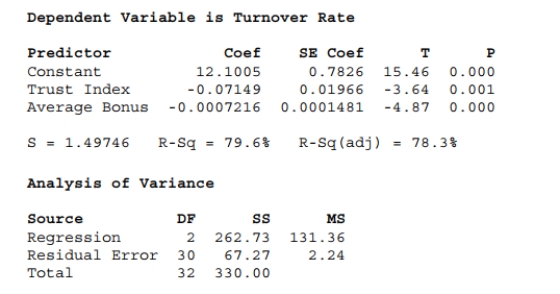
A) The multiple regression model is significant overall.
B) Trust Index is a significant independent variable in explaining turnover rate.
C) Average Annual Bonus is a significant independent variable in explaining
Turnover rate.
D) The predictor Constant is a significant independent variable in explaining
Turnover rate.
E) All of these.
Question
Question
Using the output below, calculate the predicted turnover rate for a company having a trust index score of 70 and an average annual bonus of $6500. 
A) 3.5%
B) 4.2%
C) 1.9%
D) 2.4 %
E) None of the above.
A) 3.5%
B) 4.2%
C) 1.9%
D) 2.4 %
E) None of the above.
Question
Selling price and amount spent advertising were entered into a multiple regression to determine what affects flat panel LCD TV sales. The plot of residuals versus
Predicted values is shown below. What does the residual plot suggest?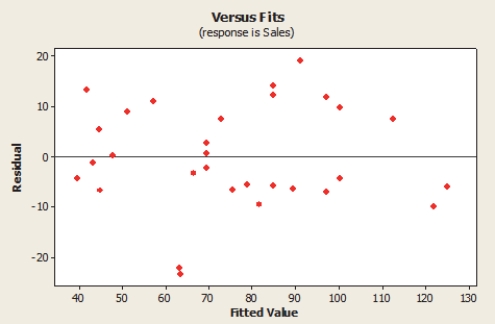
A) The Linearity condition is not satisfied.
B) There is an extreme departure from normality.
C) The variance is not constant.
D) The presence of a couple of outliers.
E) The plot thickens from left to right.5.5 Calculate and interpret the adjusted R2.
Question
Selling price and amount spent advertising were entered into a multiple regression to determine what affects flat panel LCD TV sales. According to the output below, the
Calculated t-statistic to determine if amount spent on advertising is a significant
Independent variable in explaining Sony Bravia sales is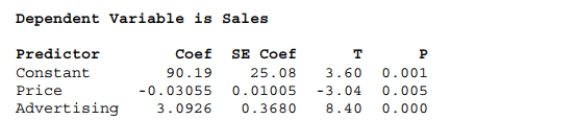
A) 3.60
B) -3.04
C) 8.40
D) 10.61
E) None of the above
Calculated t-statistic to determine if amount spent on advertising is a significant
Independent variable in explaining Sony Bravia sales is
A) 3.60
B) -3.04
C) 8.40
D) 10.61
E) None of the above
Question
Selling price and amount spent advertising were entered into a multiple regression to determine what affects flat panel LCD TV sales. Using the output below, estimate
The number of units sold on average at a store that sells the Sony Bravia for $2199
And spends 10% of its advertising budget on the product.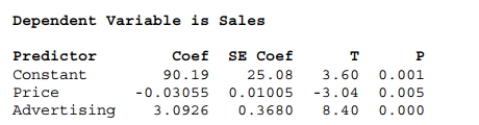
A) 53.94 units
B) 120 units
C) 66.54 units
D) 90.34 units
E) None of the above.
The number of units sold on average at a store that sells the Sony Bravia for $2199
And spends 10% of its advertising budget on the product.
A) 53.94 units
B) 120 units
C) 66.54 units
D) 90.34 units
E) None of the above.
Question
Selling price and amount spent advertising were entered into a multiple regression to determine what affects flat panel LCD TV sales. The correct null and alternative Hypotheses for testing the regression coefficient of Price is
A)
B)
C)
D)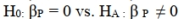
E) The regression is not significant vs.
  The regression is significant.
A)
B)
C)
D)
E)
The regression is not significant vs. The regression is significant. Question
Selling price and amount spent advertising were entered into a multiple regression to determine what affects flat panel LCD TV sales. Using the output below, calculated
F statistic to determine the overall significance of the estimated multiple regression
Model is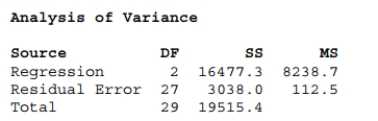
A) 10.61
B) 73.23
C) 112.5
D) 3.60
E) None of the above
F statistic to determine the overall significance of the estimated multiple regression
Model is
A) 10.61
B) 73.23
C) 112.5
D) 3.60
E) None of the above
Question
Question
Selling price and amount spent advertising were entered into a multiple regression to determine what affects flat panel LCD TV sales. Use the output shown below,
Calculate the amount of variability in Sales is explained by the estimated multiple
Regression model.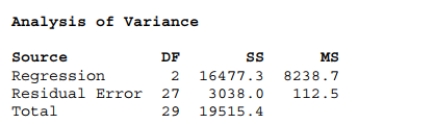
A) 15.57%
B) 6.90%
C) 84.43%
D) 29%
E) None of the above.
Calculate the amount of variability in Sales is explained by the estimated multiple
Regression model.
A) 15.57%
B) 6.90%
C) 84.43%
D) 29%
E) None of the above.
Question
Question
Selling price and amount spent advertising were entered into a multiple regression to determine what affects flat panel LCD TV sales. Based on the output below, which
Of the following statements is/are true?
A) The multiple regression model is significant overall.
B) Selling Price is a significant independent variable in explaining Bravia sales.
C) Amount Spent on Advertising is a significant independent variable in explaining
Bravia sales.
D) Only A and B
E) A, B and C
Question
Question
Question

Unlock Deck
Sign up to unlock the cards in this deck!
Unlock Deck
Unlock Deck
1/36
Play
Full screen (f)
Deck 15: Multiple Regression
1
Use the following information for problems
Sales figures (number of units), selling price and amount spent on advertising (as a percentage of total advertising expenditure in the previous quarter) for the popular Sony Bravia Television were obtained for last quarter from a sample of 30 different stores. The results of a multiple regression are presented below.
State the hypotheses for testing the regression coefficient of Price. Based on the
results, what do you conclude?

2
Use the following information for problems
Sales figures (number of units), selling price and amount spent on advertising (as a percentage of total advertising expenditure in the previous quarter) for the popular Sony Bravia Television were obtained for last quarter from a sample of 30 different stores. The results of a multiple regression are presented below.
Write out the estimated regression equation.
3
Use the following information for problems
To determine what affects turnover rate, a sample of 33 companies was randomly selected and data collected on the average annual bonus and turnover rate (%). In addition, a questionnaire was administered to the employees of each company to arrive at a trust index (measured on a scale of 0 - 100). Below are the multiple regression results.
Using this model, the turnover rate for a company with a trust index score of 70 and
an average annual bonus of $6500 is predicted to be 2.41%. If the company observes
a turnover rate of 2.15%, what is the value of the residual for this company? What
does the value of the residual tell you about the prediction?
4
A sample of 33 companies was randomly selected and data collected on the average annual bonus, turnover rate (%), and trust index (measured on a scale of 0 - 100). According to the output is shown below, what is the estimated multiple regression Model?
Dependent Variable is Turnover Rate
A) Turnover Rate Average Bonus
B) Turnover Rate Average Bonus
C) Turnover Rate Average Bonus
D) Turnover Rate Average Bonus
E) Turnover Rate Average Bonus
Dependent Variable is Turnover Rate
A) Turnover Rate
Average BonusB) Turnover Rate
Average BonusC) Turnover Rate
Average BonusD) Turnover Rate
Average BonusE) Turnover Rate
Average Bonus Unlock Deck
Unlock for access to all 36 flashcards in this deck.
Unlock Deck
k this deck
5
Use the following information for problems
Sales figures (number of units), selling price and amount spent on advertising (as a percentage of total advertising expenditure in the previous quarter) for the popular Sony Bravia Television were obtained for last quarter from a sample of 30 different stores. The results of a multiple regression are presented below.
Report the adjusted R2 for this model. Write a sentence interpreting this value.
Unlock Deck
Unlock for access to all 36 flashcards in this deck.
Unlock Deck
k this deck
6
Use the following information for problems
To determine what affects turnover rate, a sample of 33 companies was randomly selected and data collected on the average annual bonus and turnover rate (%). In addition, a questionnaire was administered to the employees of each company to arrive at a trust index (measured on a scale of 0 - 100). Below are the multiple regression results.
State the hypotheses for testing the regression coefficient of Average Annual Bonus.
Based on the results, what do you conclude?
Unlock Deck
Unlock for access to all 36 flashcards in this deck.
Unlock Deck
k this deck
7
Use the following information for problems
To determine what affects turnover rate, a sample of 33 companies was randomly selected and data collected on the average annual bonus and turnover rate (%). In addition, a questionnaire was administered to the employees of each company to arrive at a trust index (measured on a scale of 0 - 100). Below are the multiple regression results.
Write out the estimated regression equation.
Unlock Deck
Unlock for access to all 36 flashcards in this deck.
Unlock Deck
k this deck
8
Use the following information for problems
Sales figures (number of units), selling price and amount spent on advertising (as a percentage of total advertising expenditure in the previous quarter) for the popular Sony Bravia Television were obtained for last quarter from a sample of 30 different stores. The results of a multiple regression are presented below.
How much of the variability in Sales is explained by the regression equation?
Unlock Deck
Unlock for access to all 36 flashcards in this deck.
Unlock Deck
k this deck
9
A sample of 33 companies was randomly selected and data collected on the average annual bonus, turnover rate (%), and trust index (measured on a scale of 0 - 100).
Based on the output, how much of the variability in Turnover Rate is explained by the
Estimated multiple regression model?
A) 78.3%
B) 79.6%
C) 12.1%
D) 95.4%
E) None of the above.
Based on the output, how much of the variability in Turnover Rate is explained by the
Estimated multiple regression model?
A) 78.3%
B) 79.6%
C) 12.1%
D) 95.4%
E) None of the above.
Unlock Deck
Unlock for access to all 36 flashcards in this deck.
Unlock Deck
k this deck
10
A sample of 33 companies was randomly selected and a multiple regression model was performed using average annual bonus and trust index (scale of 0 - 100) to
Explain turnover rate. According to the output below, what is the F statistic to
Determine the overall significance of the estimated is
A) 58.64
B) 1.497
C) 131.36
D) 78.3
E) 2.24
Explain turnover rate. According to the output below, what is the F statistic to
Determine the overall significance of the estimated is
A) 58.64
B) 1.497
C) 131.36
D) 78.3
E) 2.24
Unlock Deck
Unlock for access to all 36 flashcards in this deck.
Unlock Deck
k this deck
11
Use the following information for problems
Sales figures (number of units), selling price and amount spent on advertising (as a percentage of total advertising expenditure in the previous quarter) for the popular Sony Bravia Television were obtained for last quarter from a sample of 30 different stores. The results of a multiple regression are presented below.
Use the F-test to determine whether the slope coefficients are significantly different
from 0. Write the null and alternative hypotheses and calculate the F-statistic.
Unlock Deck
Unlock for access to all 36 flashcards in this deck.
Unlock Deck
k this deck
12
Use the following information for problems
Sales figures (number of units), selling price and amount spent on advertising (as a percentage of total advertising expenditure in the previous quarter) for the popular Sony Bravia Television were obtained for last quarter from a sample of 30 different stores. The results of a multiple regression are presented below.
Use the scatterplots provided below to check assumptions for multiple regression. For each plot, list the assumption being checked, whether or not it is satisfied, and why.
Unlock Deck
Unlock for access to all 36 flashcards in this deck.
Unlock Deck
k this deck
13
Use the following information for problems
To determine what affects turnover rate, a sample of 33 companies was randomly selected and data collected on the average annual bonus and turnover rate (%). In addition, a questionnaire was administered to the employees of each company to arrive at a trust index (measured on a scale of 0 - 100). Below are the multiple regression results.
Use the plots provided to check whether conditions for multiple regression are
satisfied. For each plot, list the condition being checked, whether or not it is satisfied,
and why.
Unlock Deck
Unlock for access to all 36 flashcards in this deck.
Unlock Deck
k this deck
14
A sample of 33 companies was randomly selected and data collected on the average annual bonus, turnover rate (%), and trust index (measured on a scale of 0 - 100). In a Multiple regression estimating turnover rate using average bonus and trust index, What is the correct null hypotheses for testing the regression coefficient of Trust Index?
A)
B)
C)
D)
E)
A)
B)
C)
D)
E)
Unlock Deck
Unlock for access to all 36 flashcards in this deck.
Unlock Deck
k this deck
15
Use the following information for problems
Sales figures (number of units), selling price and amount spent on advertising (as a percentage of total advertising expenditure in the previous quarter) for the popular Sony Bravia Television were obtained for last quarter from a sample of 30 different stores. The results of a multiple regression are presented below.
Predict the sales for a store that sells the Sony Bravia for $2199 and spends 10% of its
advertising budget on the product.
Unlock Deck
Unlock for access to all 36 flashcards in this deck.
Unlock Deck
k this deck
16
Use the following information for problems
To determine what affects turnover rate, a sample of 33 companies was randomly selected and data collected on the average annual bonus and turnover rate (%). In addition, a questionnaire was administered to the employees of each company to arrive at a trust index (measured on a scale of 0 - 100). Below are the multiple regression results.
Is the regression equation significant overall? Explain.
Unlock Deck
Unlock for access to all 36 flashcards in this deck.
Unlock Deck
k this deck
17
Use the following information for problems
To determine what affects turnover rate, a sample of 33 companies was randomly selected and data collected on the average annual bonus and turnover rate (%). In addition, a questionnaire was administered to the employees of each company to arrive at a trust index (measured on a scale of 0 - 100). Below are the multiple regression results.
Write the null and alternative hypotheses for the F-test in this multiple regression
model.
Unlock Deck
Unlock for access to all 36 flashcards in this deck.
Unlock Deck
k this deck
18
Use the following information for problems
To determine what affects turnover rate, a sample of 33 companies was randomly selected and data collected on the average annual bonus and turnover rate (%). In addition, a questionnaire was administered to the employees of each company to arrive at a trust index (measured on a scale of 0 - 100). Below are the multiple regression results.
State the hypotheses for testing the regression coefficient of Trust Index. Based on
the results, what do you conclude?
Unlock Deck
Unlock for access to all 36 flashcards in this deck.
Unlock Deck
k this deck
19
Use the output to describe the relationship between sales figures, selling price and
amount spent on advertising for the Sony Bravia. In 2-3 sentences, summarize the
results of the multiple regression.
amount spent on advertising for the Sony Bravia. In 2-3 sentences, summarize the
results of the multiple regression.
Unlock Deck
Unlock for access to all 36 flashcards in this deck.
Unlock Deck
k this deck
20
Use the following information for problems
To determine what affects turnover rate, a sample of 33 companies was randomly selected and data collected on the average annual bonus and turnover rate (%). In addition, a questionnaire was administered to the employees of each company to arrive at a trust index (measured on a scale of 0 - 100). Below are the multiple regression results.
How much of the variability in Turnover Rate is explained by the regression
equation?
Unlock Deck
Unlock for access to all 36 flashcards in this deck.
Unlock Deck
k this deck
21
Selling price and amount spent advertising were entered into a multiple regression to determine what affects flat panel LCD TV sales. The regression coefficient for
Advertising was found to be +3.0926, which of the following is the correct
Interpretation for this value?
A) While price negatively affects the number of Sony Bravia LCD TV's sold, an
Increase in the amount of money spent on advertising will result in at least 3
Additional TV's sold.
B) At a given price, increasing the amount spent on advertising the Sony Bravia over
The previous quarter will increase sales by 3.0926 units, on average.
C) A one percent increase in the amount spent on advertising the Sony Bravia over
The previous quarter will increase sales by 3.0926 units, on average.
D) At a given price, a one percent increase in the amount spent on advertising the
Sony Bravia over the previous quarter is associated with an increase in sales of
3)0926 units, on average.
E) None of the above.2.2 Interpret the coefficients of a multiple regression model.
Unlock Deck
Unlock for access to all 36 flashcards in this deck.
Unlock Deck
k this deck
22
A sample of 33 companies was randomly selected and data collected on the average annual bonus, turnover rate (%), and trust index (measured on a scale of 0 - 100).
Using the output below, and a significance level of α = .01, we can conclude that
A) The multiple regression model is significant overall.
B) Trust Index is a significant independent variable in explaining turnover rate.
C) Average Annual Bonus is a significant independent variable in explaining
Turnover rate.
D) The predictor Constant is a significant independent variable in explaining
Turnover rate.
E) All of these.
Unlock Deck
Unlock for access to all 36 flashcards in this deck.
Unlock Deck
k this deck
23
Selling price and amount spent advertising were entered into a multiple regression to determine what affects flat panel LCD TV sales. The adjusted R2 value was reported
As 83.3%. This means that
A) Selling price and amount spent advertising do not describe TV sales well.
B) 83.3% of the variance in TV sales can be accounted for by selling price.
C) 83.3% of the variance in TV sales can be accounted for by amount spent
Advertising.
D) 83.3% of the variance in TV sales can be accounted for by the model including
Both selling price and amount spent advertising.
E) Both selling price and amount spent advertising are significant predictors of TV
Sales.
Unlock Deck
Unlock for access to all 36 flashcards in this deck.
Unlock Deck
k this deck
24
Using the output below, calculate the predicted turnover rate for a company having a trust index score of 70 and an average annual bonus of $6500.
A) 3.5%
B) 4.2%
C) 1.9%
D) 2.4 %
E) None of the above.
A) 3.5%
B) 4.2%
C) 1.9%
D) 2.4 %
E) None of the above.
Unlock Deck
Unlock for access to all 36 flashcards in this deck.
Unlock Deck
k this deck
25
Selling price and amount spent advertising were entered into a multiple regression to determine what affects flat panel LCD TV sales. The plot of residuals versus
Predicted values is shown below. What does the residual plot suggest?
A) The Linearity condition is not satisfied.
B) There is an extreme departure from normality.
C) The variance is not constant.
D) The presence of a couple of outliers.
E) The plot thickens from left to right.5.5 Calculate and interpret the adjusted R2.
Predicted values is shown below. What does the residual plot suggest?
A) The Linearity condition is not satisfied.
B) There is an extreme departure from normality.
C) The variance is not constant.
D) The presence of a couple of outliers.
E) The plot thickens from left to right.5.5 Calculate and interpret the adjusted R2.
Unlock Deck
Unlock for access to all 36 flashcards in this deck.
Unlock Deck
k this deck
26
Selling price and amount spent advertising were entered into a multiple regression to determine what affects flat panel LCD TV sales. According to the output below, the
Calculated t-statistic to determine if amount spent on advertising is a significant
Independent variable in explaining Sony Bravia sales is
A) 3.60
B) -3.04
C) 8.40
D) 10.61
E) None of the above
Calculated t-statistic to determine if amount spent on advertising is a significant
Independent variable in explaining Sony Bravia sales is
A) 3.60
B) -3.04
C) 8.40
D) 10.61
E) None of the above
Unlock Deck
Unlock for access to all 36 flashcards in this deck.
Unlock Deck
k this deck
27
Selling price and amount spent advertising were entered into a multiple regression to determine what affects flat panel LCD TV sales. Using the output below, estimate
The number of units sold on average at a store that sells the Sony Bravia for $2199
And spends 10% of its advertising budget on the product.
A) 53.94 units
B) 120 units
C) 66.54 units
D) 90.34 units
E) None of the above.
The number of units sold on average at a store that sells the Sony Bravia for $2199
And spends 10% of its advertising budget on the product.
A) 53.94 units
B) 120 units
C) 66.54 units
D) 90.34 units
E) None of the above.
Unlock Deck
Unlock for access to all 36 flashcards in this deck.
Unlock Deck
k this deck
28
Selling price and amount spent advertising were entered into a multiple regression to determine what affects flat panel LCD TV sales. The correct null and alternative Hypotheses for testing the regression coefficient of Price is
A)
B)
C)
D)
E) The regression is not significant vs. The regression is significant.
A)
B)
C)
D)
E)
The regression is not significant vs. The regression is significant. Unlock Deck
Unlock for access to all 36 flashcards in this deck.
Unlock Deck
k this deck
29
Selling price and amount spent advertising were entered into a multiple regression to determine what affects flat panel LCD TV sales. Using the output below, calculated
F statistic to determine the overall significance of the estimated multiple regression
Model is
A) 10.61
B) 73.23
C) 112.5
D) 3.60
E) None of the above
F statistic to determine the overall significance of the estimated multiple regression
Model is
A) 10.61
B) 73.23
C) 112.5
D) 3.60
E) None of the above
Unlock Deck
Unlock for access to all 36 flashcards in this deck.
Unlock Deck
k this deck
30
Selling price and amount spent advertising were entered into a multiple regression to determine what affects flat panel LCD TV sales. If the scatterplots of sales versus
Both selling price and amount spent on advertising are created, they are being used to
Determine whether
A) the nearly normal assumption is satisfied.
B) the randomization condition is satisfied.
C) the linearity condition is satisfied.
D) both A and B.
E) both A and C.
Both selling price and amount spent on advertising are created, they are being used to
Determine whether
A) the nearly normal assumption is satisfied.
B) the randomization condition is satisfied.
C) the linearity condition is satisfied.
D) both A and B.
E) both A and C.
Unlock Deck
Unlock for access to all 36 flashcards in this deck.
Unlock Deck
k this deck
31
Selling price and amount spent advertising were entered into a multiple regression to determine what affects flat panel LCD TV sales. Use the output shown below,
Calculate the amount of variability in Sales is explained by the estimated multiple
Regression model.
A) 15.57%
B) 6.90%
C) 84.43%
D) 29%
E) None of the above.
Calculate the amount of variability in Sales is explained by the estimated multiple
Regression model.
A) 15.57%
B) 6.90%
C) 84.43%
D) 29%
E) None of the above.
Unlock Deck
Unlock for access to all 36 flashcards in this deck.
Unlock Deck
k this deck
32
A sample of 33 companies was randomly selected and data collected on the average annual bonus, turnover rate (%), and trust index (measured on a scale of 0 - 100).
The regression coefficient for the variable Trust Index is -0.07149. The correct
Interpretation of this value is
A) For companies that give the same average annual bonus, an increase of 10 points
On the trust index is associated with a decrease of 0.71% in turnover rate, on
Average.
B) An increase of 10 points on the trust index results in a decrease of 7.1% in
Turnover rate.
C) Holding average annual bonus constant, increasing the trust index by 10 points
Will decrease the turnover rate by 7.1%.
D) For companies that give the same average annual bonus, an increase of 10 points
On the trust index is associated with an increase of 0.71% in turnover rate, on
Average.
E) None of the above.
Unlock Deck
Unlock for access to all 36 flashcards in this deck.
Unlock Deck
k this deck
33
Selling price and amount spent advertising were entered into a multiple regression to determine what affects flat panel LCD TV sales. Based on the output below, which
Of the following statements is/are true?
A) The multiple regression model is significant overall.
B) Selling Price is a significant independent variable in explaining Bravia sales.
C) Amount Spent on Advertising is a significant independent variable in explaining
Bravia sales.
D) Only A and B
E) A, B and C
Of the following statements is/are true?
A) The multiple regression model is significant overall.
B) Selling Price is a significant independent variable in explaining Bravia sales.
C) Amount Spent on Advertising is a significant independent variable in explaining
Bravia sales.
D) Only A and B
E) A, B and C
Unlock Deck
Unlock for access to all 36 flashcards in this deck.
Unlock Deck
k this deck
34
Selling price and amount spent advertising were entered into a multiple regression to determine what affects flat panel LCD TV sales. A multiple regression model was fit
To the data and the graph of residuals shows a unimodal and symmetric pattern. What
Does this graph suggest?
A) the nearly normal assumption is satisfied.
B) the randomization condition is satisfied.
C) the linearity condition is satisfied.
D) both A and B.
E) both A and C.
To the data and the graph of residuals shows a unimodal and symmetric pattern. What
Does this graph suggest?
A) the nearly normal assumption is satisfied.
B) the randomization condition is satisfied.
C) the linearity condition is satisfied.
D) both A and B.
E) both A and C.
Unlock Deck
Unlock for access to all 36 flashcards in this deck.
Unlock Deck
k this deck
35
Selling price and amount spent advertising were entered into a multiple regression to determine what affects flat panel LCD TV sales. The regression coefficient for Price
Was found to be -0.03055, which of the following is the correct interpretation for this
Value?
A) Increasing the price of the Sony Bravia by $100 will result in at least 3 fewer
TV's sold.
B) For a given amount spent on advertising, a $100 increase in price of the Sony
Bravia is associated with a decrease in sales of 3.055 units, on average.
C) Holding the amount spent on advertising constant, an increase of $100 in the price
Of the Sony Bravia will decrease sales by 3.055 units.
D) Holding the amount spent on advertising constant, an increase of $100 in the price
Of the Sony Bravia will decrease sales by .03%.
E) None of the above.
Unlock Deck
Unlock for access to all 36 flashcards in this deck.
Unlock Deck
k this deck
36
A sample of 33 companies was randomly selected and data collected on the average annual bonus, turnover rate (%), and trust index (measured on a scale of 0 - 100).
The regression coefficient associated with Average Bonus was found to be
-0)0007216. The correct interpretation of this value is
A) Holding the trust index constant, increasing the average annual bonus by $100
Will decrease the turnover rate by 7.2%.
B) For companies that have the same score on the trust index, increasing the average
Annual bonus by $100 is associated with a decrease in turnover rate of 7.2%, on
Average.
C) For companies that have the same score on the trust index, increasing the average
Annual bonus by $100 is associated with an increase in turnover rate of 7.2%, on
Average.
D) An increase of $100 in the average annual bonus decreases the turnover rate by
7)2%.
E) None of the above.
Unlock Deck
Unlock for access to all 36 flashcards in this deck.
Unlock Deck
k this deck
Unlock Deck
Unlock for access to all 36 flashcards in this deck.


