Deck 9: Sampling Distributions and Confidence Intervals for Proportions
Full screen (f)
Question
Question
Question
Question
Question
A Normal probability plot of the weights of individuals signed up for a popular diet program is shown below. The best description of the plot is 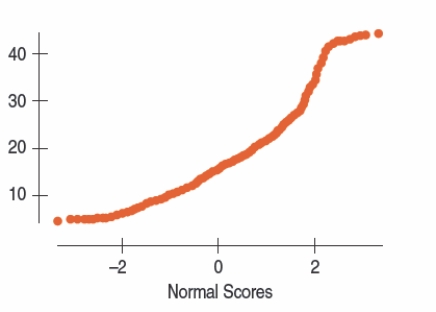
A) The distribution is fairly symmetric.
B) The distribution is right skewed and nonlinear.
C) The kink in the bend success values that don't continue the skewness consistently.
D) The distribution is left skewed and nonlinear.
E) B and C are correct.
A) The distribution is fairly symmetric.
B) The distribution is right skewed and nonlinear.
C) The kink in the bend success values that don't continue the skewness consistently.
D) The distribution is left skewed and nonlinear.
E) B and C are correct.
Question
Question
Question
Question
A government agency has 6000 employees. As an alternative to the traditional five day work week, employees were asked whether they preferred a four day work week (10
Hours per day) or flexible hours. The table below shows the results by age category.
Which of the following statements is true about work week preferences and age
Category?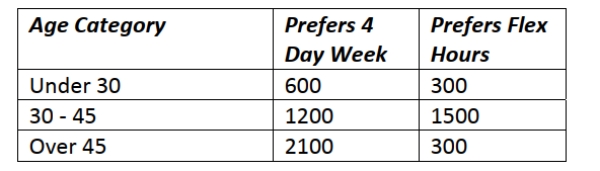
A) Work week preferences are independent of age category.
B) Work week preferences are mutually exclusive.
C) Work week preferences are not independent of age category.
D) Work week preferences are independent and mutually exclusive.
E) There is insufficient information to determine whether work week preferences and
Age category are independent or mutually exclusive.
Question
Question
Question
After the financial crisis of 2007/2008, the Dow Jones Industrial Average (DJIA) improved from a low of 7278 on March 20, 2009, to new records just a few years later.
On August 8, 2011, the Dow dropped 634.8 points. A histogram of day-to-day changes in
The DJIA looked like the histogram below. An accurate description of the distribution of
Changes in the DJIA is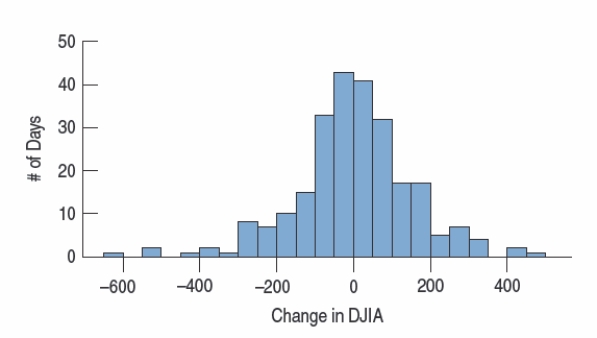
A) The distribution is fairly symmetric.
B) The distribution is somewhat left skewed with a number of low outliers.
C) A normal probability plot would add information about the normality of the data
Set)
D) Both A and C
E) Both B and C
Question
Question
IT staff for a large corporation has developed the following probability distribution for the number of calls requiring troubleshooting problems per day. Based on the
Distribution, the expected number of calls per day is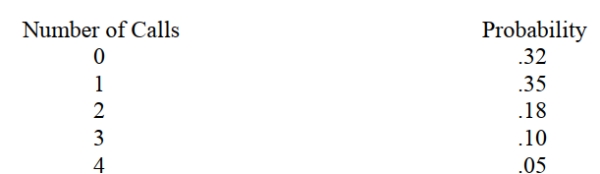
A) 2.77
B) 1.56
C) 1.21
D) 1.31
E) 1
Distribution, the expected number of calls per day is
A) 2.77
B) 1.56
C) 1.21
D) 1.31
E) 1
Question
An advocacy group is investigating whether gender has an effect on job category in large investment firms. She surveyed a sample of firms with the following results: 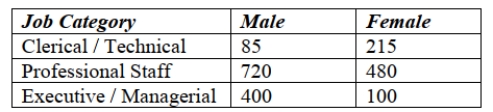 What is the probability that a randomly selected employee's job category is executive /
Managerial given that she is female?
A) 0.13
B) 0.20
C) 0.80
D) 0.05
E) 0.45
What is the probability that a randomly selected employee's job category is executive /Managerial given that she is female?
A) 0.13
B) 0.20
C) 0.80
D) 0.05
E) 0.45
Question
Question
Question
Question
Question
A government agency has 6000 employees. As an alternative to the traditional five day work week, employees were asked whether they preferred a four day work week (10
Hours per day) or flexible hours. The table below shows the results by age category.
What is the probability that an employee at this government agency prefers a four day
Work week?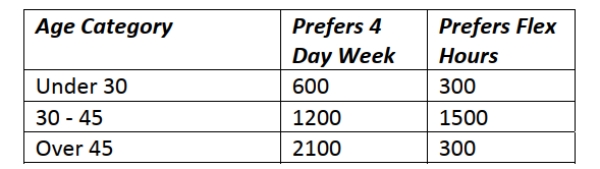
A) 0.54
B) 0.15
C) 0.50
D) 0.35
E) 0.65
Hours per day) or flexible hours. The table below shows the results by age category.
What is the probability that an employee at this government agency prefers a four day
Work week?
A) 0.54
B) 0.15
C) 0.50
D) 0.35
E) 0.65
Question
Question
A Normal probability plot of the weights of individuals signed up for a popular diet program is shown below. The best description of the plot is 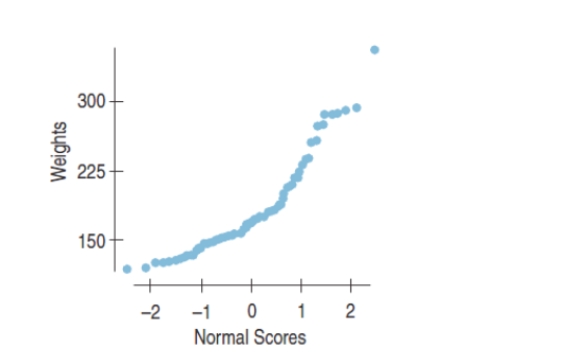
A) The distribution is fairly symmetric.
B) The distribution is right skewed and nonlinear.
C) The distribution is left skewed and nonlinear.
D) Using a Normal model for analysis is OK.
E) None of the above, cannot be determined from the plot.
A) The distribution is fairly symmetric.
B) The distribution is right skewed and nonlinear.
C) The distribution is left skewed and nonlinear.
D) Using a Normal model for analysis is OK.
E) None of the above, cannot be determined from the plot.
Question
Question
Question
Question
Question
Question
Question
Question
Question
A men's clothing store has determined the following probability distribution for the number of special size orders placed per month. Based on this distribution, the standard
Deviation in the number of special size orders placed per month is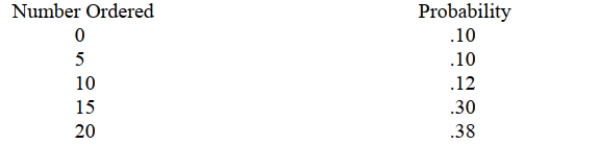
A) 43.56
B) 6.6
C) 15.345
D) 4.9
E) 3.88
Deviation in the number of special size orders placed per month is
A) 43.56
B) 6.6
C) 15.345
D) 4.9
E) 3.88
Question
Question
Question
Question
Question
Speeds of cars were measured as they passed one point on a road to study whether traffic speed controls were needed. Here's a histogram and boxplot of the measured
Speeds. Accurate statements about this distribution include.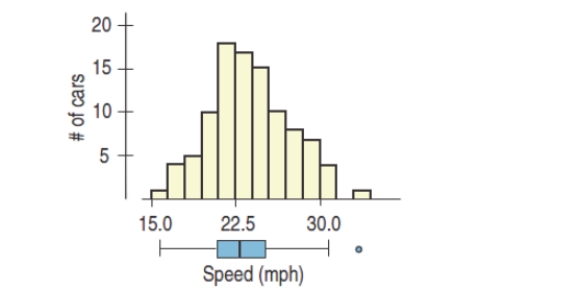
A) The distribution is fairly symmetric.
B) The distribution is right skewed with a large outlier.
C) A normal probability plot would add information about the normality of the data
Set)
D) Both A and C
E) Both B and C
Speeds. Accurate statements about this distribution include.
A) The distribution is fairly symmetric.
B) The distribution is right skewed with a large outlier.
C) A normal probability plot would add information about the normality of the data
Set)
D) Both A and C
E) Both B and C
Question
An advocacy group is investigating whether gender has an effect on job category in large investment firms. Given the results shown in the table below, which of the
Following statements is true about gender and job category?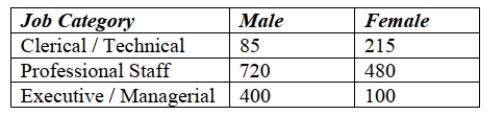
A) Gender and job category are independent.
B) Gender and job category are not independent.
C) Gender and job category are mutually exclusive.
D) Gender and job category are independent and mutually exclusive.
E) There is not sufficient information to determine whether gender and job category
Are independent or mutually exclusive.
IIA-1
Question
Question
Question
Question
Question
Question
A large software development firm recently relocated its facilities. Top management
is interested in fostering good relations with their new local community and has
encouraged their professional employees to engage in local service activities. They wish
to determine the average number of hours the firm's professionals volunteer per month.
A random sample of 24 professionals reported the following number of hours: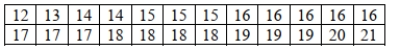
A. Based on the sample results, find the 95% confidence interval and interpret.
b. For a more accurate determination, top management wants to estimate the average
number of hours volunteered per month by their professional staff to within one hour with
99% confidence. How many randomly selected professional employees would they need
to sample?
c. Suppose 40 professional employees are randomly selected. This sample yields a mean
of 15.2 hours and a standard deviation of 1.8 hours. Find a 95% confidence interval and
interpret.
Question
Question
Question
Question
Question
Question
Question
Question
Question
Question
Question
Question
Question
Question
Question
Question
Insurance companies track life expectancy information to assist in determining the
cost of life insurance policies. Last year the average life expectancy of all policyholders
was 77 years. ABI Insurance wants to determine if their clients now have a longer life
expectancy, on average, so they randomly sample some of their recently paid policies.
The ages of the clients in the sample are shown below.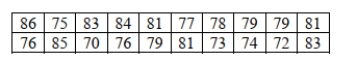
A. Based on the sample results, find the 90% confidence interval and interpret.
b. For more accurate cost determination, ABI Insurance wants to estimate the average life
expectancy to within one year with 95% confidence. How many randomly selected
recently paid policies would they need to sample?
c. Suppose ABI samples 100 recently paid policies. This sample yields a mean of 77.7
years and a standard deviation of 3.6 years. Find a 90% confidence interval and interpret.
Question
Question
Question
Question
Question
Question
Question

Unlock Deck
Sign up to unlock the cards in this deck!
Unlock Deck
Unlock Deck
1/66
Play
Full screen (f)
Deck 9: Sampling Distributions and Confidence Intervals for Proportions
1
A survey of investors finds that 60% use a full service brokerage firm to invest in stocks, 30% trade stocks online and 24% do both. The probability that an investor
Selected at random uses a full service brokerage firm or trades stocks online is
A) 90%
B) 66%
C) 34%
D) 54%
E) 60%
Selected at random uses a full service brokerage firm or trades stocks online is
A) 90%
B) 66%
C) 34%
D) 54%
E) 60%
66%
2
Assume that a set of test scores in an Introduction to Finance class is normally distributed with a mean of 72 and a standard deviation of 8. Use the 68-95-99.7 rule to
Find the percentage of scores greater than 88.
A) 0.15%
B) 0.3%
C) 2.5%
D) 5%
E) 95%
Find the percentage of scores greater than 88.
A) 0.15%
B) 0.3%
C) 2.5%
D) 5%
E) 95%
2.5%
3
A publishing company conducted a survey of its readership and found that 60% subscribed to Food & Wine, 30% subscribed to Wine Spectator, and 25% subscribed to
Both. The probability that a reader does not subscribe to either is
A) 0.10
B) 0.65
C) 0.50
D) 0.45
E) 0.35
Both. The probability that a reader does not subscribe to either is
A) 0.10
B) 0.65
C) 0.50
D) 0.45
E) 0.35
0.35
4
As a result of the financial crisis on Wall Street in September 2008 that required federal government intervention, a survey showed that 40% of Americans reallocated
Their investments to reduce exposure to the stock market. What is the probability that out
Of 5 randomly selected Americans, none will have reallocated their investments in this
Way?
A) 0.2592
B) 0.8154
C) 0.1699
D) 0.0778
E) 0.1234
Their investments to reduce exposure to the stock market. What is the probability that out
Of 5 randomly selected Americans, none will have reallocated their investments in this
Way?
A) 0.2592
B) 0.8154
C) 0.1699
D) 0.0778
E) 0.1234
Unlock Deck
Unlock for access to all 66 flashcards in this deck.
Unlock Deck
k this deck
5
A Normal probability plot of the weights of individuals signed up for a popular diet program is shown below. The best description of the plot is
A) The distribution is fairly symmetric.
B) The distribution is right skewed and nonlinear.
C) The kink in the bend success values that don't continue the skewness consistently.
D) The distribution is left skewed and nonlinear.
E) B and C are correct.
A) The distribution is fairly symmetric.
B) The distribution is right skewed and nonlinear.
C) The kink in the bend success values that don't continue the skewness consistently.
D) The distribution is left skewed and nonlinear.
E) B and C are correct.
Unlock Deck
Unlock for access to all 66 flashcards in this deck.
Unlock Deck
k this deck
6
Suppose the time it takes for a purchasing agent to complete an online ordering process is normally distributed with a mean of 8 minutes and a standard deviation of 2
Minutes. Suppose a random sample of 25 ordering processes is selected. The standard
Deviation of the sampling distribution of mean times is
A) 0.4 minutes
B) 2 minutes
C) 0.08 minutes
D) 1.6 minutes
E) 0.12 minutes
Minutes. Suppose a random sample of 25 ordering processes is selected. The standard
Deviation of the sampling distribution of mean times is
A) 0.4 minutes
B) 2 minutes
C) 0.08 minutes
D) 1.6 minutes
E) 0.12 minutes
Unlock Deck
Unlock for access to all 66 flashcards in this deck.
Unlock Deck
k this deck
7
Which is true about a 99% confidence interval based on a given sample? I. The interval contains 99% of the population.
II) Results from 99% of all samples will lie in this interval.
III) The interval is wider than a 95% confidence interval would be.
A) None
B) I only
C) II only
D) III only
E) I and III
II) Results from 99% of all samples will lie in this interval.
III) The interval is wider than a 95% confidence interval would be.
A) None
B) I only
C) II only
D) III only
E) I and III
Unlock Deck
Unlock for access to all 66 flashcards in this deck.
Unlock Deck
k this deck
8
A researcher is conducting a study on Internet use. He decides to first categorize the population by education level (high school, college graduate, advanced degree, etc.) and
Then survey a select number from each category. This sampling strategy is called
A) Systematic
B) Cluster
C) Random
D) Judgmental
E) Stratified
Then survey a select number from each category. This sampling strategy is called
A) Systematic
B) Cluster
C) Random
D) Judgmental
E) Stratified
Unlock Deck
Unlock for access to all 66 flashcards in this deck.
Unlock Deck
k this deck
9
A government agency has 6000 employees. As an alternative to the traditional five day work week, employees were asked whether they preferred a four day work week (10
Hours per day) or flexible hours. The table below shows the results by age category.
Which of the following statements is true about work week preferences and age
Category?
A) Work week preferences are independent of age category.
B) Work week preferences are mutually exclusive.
C) Work week preferences are not independent of age category.
D) Work week preferences are independent and mutually exclusive.
E) There is insufficient information to determine whether work week preferences and
Age category are independent or mutually exclusive.
Unlock Deck
Unlock for access to all 66 flashcards in this deck.
Unlock Deck
k this deck
10
A manufacturer of batteries routinely tests its products to determine lifetime (hours of continuous usage). Suppose they select a sample of 30 AAA batteries and find that the
Average lifetime is 1500 hours. This is a
A) parameter.
B) statistic.
C) sampling frame.
D) sample.
E) population.
Average lifetime is 1500 hours. This is a
A) parameter.
B) statistic.
C) sampling frame.
D) sample.
E) population.
Unlock Deck
Unlock for access to all 66 flashcards in this deck.
Unlock Deck
k this deck
11
Assume that a set of test scores in an Introduction to Finance class is normally distributed with a mean of 72 and a standard deviation of 8. Use the 68-95-99.7 rule to
Find the percentage of scores between 80 and 96.
A) 13.5%
B) 15.85%
C) 30.7%
D) 2.5%
E) 25.5%
Find the percentage of scores between 80 and 96.
A) 13.5%
B) 15.85%
C) 30.7%
D) 2.5%
E) 25.5%
Unlock Deck
Unlock for access to all 66 flashcards in this deck.
Unlock Deck
k this deck
12
After the financial crisis of 2007/2008, the Dow Jones Industrial Average (DJIA) improved from a low of 7278 on March 20, 2009, to new records just a few years later.
On August 8, 2011, the Dow dropped 634.8 points. A histogram of day-to-day changes in
The DJIA looked like the histogram below. An accurate description of the distribution of
Changes in the DJIA is
A) The distribution is fairly symmetric.
B) The distribution is somewhat left skewed with a number of low outliers.
C) A normal probability plot would add information about the normality of the data
Set)
D) Both A and C
E) Both B and C
On August 8, 2011, the Dow dropped 634.8 points. A histogram of day-to-day changes in
The DJIA looked like the histogram below. An accurate description of the distribution of
Changes in the DJIA is
A) The distribution is fairly symmetric.
B) The distribution is somewhat left skewed with a number of low outliers.
C) A normal probability plot would add information about the normality of the data
Set)
D) Both A and C
E) Both B and C
Unlock Deck
Unlock for access to all 66 flashcards in this deck.
Unlock Deck
k this deck
13
Nine out of 25 randomly selected Students of WMU live in Southwest Michigan. The result says that the true proportion could be as low as 0.17 or as high as 0.55. If we
Want to reduce the margin of error from 0.19 to 0.10. Using the estimate of 0.36 based on
The initial sample, what sample size would be needed to achieve the reduced margin of
Error?
A) 92
B) 85
C) 10
D) 50
E) Cannot be determined
Want to reduce the margin of error from 0.19 to 0.10. Using the estimate of 0.36 based on
The initial sample, what sample size would be needed to achieve the reduced margin of
Error?
A) 92
B) 85
C) 10
D) 50
E) Cannot be determined
Unlock Deck
Unlock for access to all 66 flashcards in this deck.
Unlock Deck
k this deck
14
IT staff for a large corporation has developed the following probability distribution for the number of calls requiring troubleshooting problems per day. Based on the
Distribution, the expected number of calls per day is
A) 2.77
B) 1.56
C) 1.21
D) 1.31
E) 1
Distribution, the expected number of calls per day is
A) 2.77
B) 1.56
C) 1.21
D) 1.31
E) 1
Unlock Deck
Unlock for access to all 66 flashcards in this deck.
Unlock Deck
k this deck
15
An advocacy group is investigating whether gender has an effect on job category in large investment firms. She surveyed a sample of firms with the following results: What is the probability that a randomly selected employee's job category is executive /
Managerial given that she is female?
A) 0.13
B) 0.20
C) 0.80
D) 0.05
E) 0.45
What is the probability that a randomly selected employee's job category is executive /Managerial given that she is female?
A) 0.13
B) 0.20
C) 0.80
D) 0.05
E) 0.45
Unlock Deck
Unlock for access to all 66 flashcards in this deck.
Unlock Deck
k this deck
16
Which is true about a 90% confidence interval based on a given sample? I. The interval contains 90% of the population.
II) Results from 90% of all samples will lie in this interval.
III) The interval is smaller than a 95% confidence interval would be.
A) None
B) I only
C) II only
D) III only
E) I and III
II) Results from 90% of all samples will lie in this interval.
III) The interval is smaller than a 95% confidence interval would be.
A) None
B) I only
C) II only
D) III only
E) I and III
Unlock Deck
Unlock for access to all 66 flashcards in this deck.
Unlock Deck
k this deck
17
A human resources manager at a large company wants to estimate the proportion of employees that would be interested in reimbursement for college courses. If she wishes
To be 95% confident that her estimate is within 5% of the true proportion, how many
Employees would need to be sampled?
A) 271
B) 385
C) 543
D) 646
E) 1234
To be 95% confident that her estimate is within 5% of the true proportion, how many
Employees would need to be sampled?
A) 271
B) 385
C) 543
D) 646
E) 1234
Unlock Deck
Unlock for access to all 66 flashcards in this deck.
Unlock Deck
k this deck
18
Suppose the time it takes for a purchasing agent to complete an online ordering process is normally distributed with a mean of 8 minutes and a standard deviation of 2
Minutes. What is the probability that it takes longer than 11 minutes for the purchasing
Agent to complete the process?
A) 0.9332
B) 0.4332
C) 0.0668
D) 0.5668
E) none of the above
Minutes. What is the probability that it takes longer than 11 minutes for the purchasing
Agent to complete the process?
A) 0.9332
B) 0.4332
C) 0.0668
D) 0.5668
E) none of the above
Unlock Deck
Unlock for access to all 66 flashcards in this deck.
Unlock Deck
k this deck
19
If a parameter is computed from a set of data, which of the following statements is true?
A) The data are obtained from a census.
B) The data are obtained from a random sample.
C) The data is from a sample that is representative of the population.
D) The data are obtained from a stratified sample.
E) The data must be quantitative.
A) The data are obtained from a census.
B) The data are obtained from a random sample.
C) The data is from a sample that is representative of the population.
D) The data are obtained from a stratified sample.
E) The data must be quantitative.
Unlock Deck
Unlock for access to all 66 flashcards in this deck.
Unlock Deck
k this deck
20
A government agency has 6000 employees. As an alternative to the traditional five day work week, employees were asked whether they preferred a four day work week (10
Hours per day) or flexible hours. The table below shows the results by age category.
What is the probability that an employee at this government agency prefers a four day
Work week?
A) 0.54
B) 0.15
C) 0.50
D) 0.35
E) 0.65
Hours per day) or flexible hours. The table below shows the results by age category.
What is the probability that an employee at this government agency prefers a four day
Work week?
A) 0.54
B) 0.15
C) 0.50
D) 0.35
E) 0.65
Unlock Deck
Unlock for access to all 66 flashcards in this deck.
Unlock Deck
k this deck
21
A manufacturer of cheese filled ravioli supplies a pizza restaurant chain. Based on
data collected from its automatic filling process, the amount of cheese inserted into the
ravioli is normally distributed. To make sure that the automatic filling process is on
target, quality control inspectors take a sample of 25 ravioli and measure the weight of
cheese filling. They find a sample mean weight of 15 grams with a standard deviation of
1.5 grams.
A. Describe the sampling distribution for the sample mean.
b. What is the standard error?
c. What is the margin of error for 99% confidence?
d. What is the margin of error for 90% confidence?
e. Based on the sample results, find the 99% confidence interval and interpret.
f. Based on the sample results, find the 90% confidence interval and interpret.
g. For a more accurate determination of the mean weight, the quality control inspectors
wish to estimate it within .25 grams with 99% confidence. How many ravioli should they
sample?
Unlock Deck
Unlock for access to all 66 flashcards in this deck.
Unlock Deck
k this deck
22
A Normal probability plot of the weights of individuals signed up for a popular diet program is shown below. The best description of the plot is
A) The distribution is fairly symmetric.
B) The distribution is right skewed and nonlinear.
C) The distribution is left skewed and nonlinear.
D) Using a Normal model for analysis is OK.
E) None of the above, cannot be determined from the plot.
A) The distribution is fairly symmetric.
B) The distribution is right skewed and nonlinear.
C) The distribution is left skewed and nonlinear.
D) Using a Normal model for analysis is OK.
E) None of the above, cannot be determined from the plot.
Unlock Deck
Unlock for access to all 66 flashcards in this deck.
Unlock Deck
k this deck
23
We have calculated a 95% confidence interval and would like our next confidence interval to have a smaller margin of error without losing any confidence. In order to do
This, we can
I. change the z∗ value to a smaller number.
II. take a larger sample.
III. take a smaller sample.
A) I only
B) II only
C) III only
D) I and II
E) I and III
This, we can
I. change the z∗ value to a smaller number.
II. take a larger sample.
III. take a smaller sample.
A) I only
B) II only
C) III only
D) I and II
E) I and III
Unlock Deck
Unlock for access to all 66 flashcards in this deck.
Unlock Deck
k this deck
24
A researcher is conducting a study to determine how knowledgeable teenagers are about making good food choices. She decides to interview teenagers eating at a fast food
Restaurant. The results may be biased because this is a
A) simple random sample.
B) voluntary response sample.
C) convenience sample.
D) stratified sample.
E) census.
Restaurant. The results may be biased because this is a
A) simple random sample.
B) voluntary response sample.
C) convenience sample.
D) stratified sample.
E) census.
Unlock Deck
Unlock for access to all 66 flashcards in this deck.
Unlock Deck
k this deck
25
The number of claims for lost luggage in a small city airport averages nine per day. Assuming the Poisson distribution, what is the probability that there will be fewer than 3
Claims on any given day?
A) 0.0150
B) 0.0212
C) 0.0062
D) 0.0337
E) 0.5000
Claims on any given day?
A) 0.0150
B) 0.0212
C) 0.0062
D) 0.0337
E) 0.5000
Unlock Deck
Unlock for access to all 66 flashcards in this deck.
Unlock Deck
k this deck
26
A Normal model states that if we draw repeated random samples of the same size, n, from some population and measure sample proportions, then the collection of these
Proportions will pile up around the underlying population proportion, p. The requirement
For this to work is
A) np and nq must be at least equal to 10.
B) As n increases, a distribution of sample proportions becomes more Normal.
C) np and nq must be less than 10.
D) Both B and C.
E) Both A and B.
Proportions will pile up around the underlying population proportion, p. The requirement
For this to work is
A) np and nq must be at least equal to 10.
B) As n increases, a distribution of sample proportions becomes more Normal.
C) np and nq must be less than 10.
D) Both B and C.
E) Both A and B.
Unlock Deck
Unlock for access to all 66 flashcards in this deck.
Unlock Deck
k this deck
27
Suppose the time it takes for a purchasing agent to complete an online ordering process is normally distributed with a mean of 8 minutes and a standard deviation of 2
Minutes. Suppose a random sample of 25 ordering processes is selected. What is the
Probability that the sample mean will be less than 7.5 minutes?
A) 0.3944
B) 0.1056
C) 0.2114
D) 0.4013
E) 0.8944
Minutes. Suppose a random sample of 25 ordering processes is selected. What is the
Probability that the sample mean will be less than 7.5 minutes?
A) 0.3944
B) 0.1056
C) 0.2114
D) 0.4013
E) 0.8944
Unlock Deck
Unlock for access to all 66 flashcards in this deck.
Unlock Deck
k this deck
28
A researcher is conducting a study on eating disorders. Using a list of recent participants in the online Weight Watchers program, she randomly selects a sample from
The alphabetized list. This list represents the
A) Sample
B) Parameter
C) Population
D) Sampling frame
E) Statistic
The alphabetized list. This list represents the
A) Sample
B) Parameter
C) Population
D) Sampling frame
E) Statistic
Unlock Deck
Unlock for access to all 66 flashcards in this deck.
Unlock Deck
k this deck
29
Assume that a set of test scores in an Introduction to Finance class is normally distributed with a mean of 72 and a standard deviation of 8. Use the 68-95-99.7 rule to
Find the percentage of scores between 64 and 88.
A) 95%
B) 68%
C) 99.7%
D) 81.5%
E) 49.85%
Find the percentage of scores between 64 and 88.
A) 95%
B) 68%
C) 99.7%
D) 81.5%
E) 49.85%
Unlock Deck
Unlock for access to all 66 flashcards in this deck.
Unlock Deck
k this deck
30
In economic downturns, companies attempt to downsize their workforces by offering early retirement incentives to older employees. A survey of 723 companies found that
195 engage in such downsizing practices. The 99% confidence interval for the
Proportion of companies that downsize their workforces by offering early retirement
Incentives is
A) 0.19 to 0.35
B) 0.65 to 0.81
C) 0.19 to 0.47
D) 0.69 to 0.77
E) 0.23 to 0.31
195 engage in such downsizing practices. The 99% confidence interval for the
Proportion of companies that downsize their workforces by offering early retirement
Incentives is
A) 0.19 to 0.35
B) 0.65 to 0.81
C) 0.19 to 0.47
D) 0.69 to 0.77
E) 0.23 to 0.31
Unlock Deck
Unlock for access to all 66 flashcards in this deck.
Unlock Deck
k this deck
31
A men's clothing store has determined the following probability distribution for the number of special size orders placed per month. Based on this distribution, the standard
Deviation in the number of special size orders placed per month is
A) 43.56
B) 6.6
C) 15.345
D) 4.9
E) 3.88
Deviation in the number of special size orders placed per month is
A) 43.56
B) 6.6
C) 15.345
D) 4.9
E) 3.88
Unlock Deck
Unlock for access to all 66 flashcards in this deck.
Unlock Deck
k this deck
32
In a metal fabrication process, metal rods are produced to a specified target length of
15 feet. Suppose that the lengths are normally distributed. A quality control specialist
collects a random sample of 16 rods and finds the sample mean length to be 14.8 feet and
a standard deviation of 0.65 feet.
A. Describe the sampling distribution for the sample mean.
b. What is the standard error?
c. For 95% confidence, what is the margin of error?
d. Based on the sample results, create the 95% confidence interval and interpret.
Unlock Deck
Unlock for access to all 66 flashcards in this deck.
Unlock Deck
k this deck
33
Assume that a set of test scores in an Introduction to Finance class is normally distributed with a mean of 72 and a standard deviation of 8. Use the 68-95-99.7 rule to
Find the percentage of scores less than 56.
A) 0.15%
B) 0.3%
C) 2.5%
D) 5%
E) 95%
Find the percentage of scores less than 56.
A) 0.15%
B) 0.3%
C) 2.5%
D) 5%
E) 95%
Unlock Deck
Unlock for access to all 66 flashcards in this deck.
Unlock Deck
k this deck
34
In a recent poll of 200 households, it was found that 152 had at least one computer and one television. A 95% confidence interval to estimate the population proportion was
Calculated to be 0.701 to 0.819. What sample size would be needed to change the margin
Of error to 0.030?
A) 1068
B) 779
C) 534
D) 390
E) Cannot be determined
Calculated to be 0.701 to 0.819. What sample size would be needed to change the margin
Of error to 0.030?
A) 1068
B) 779
C) 534
D) 390
E) Cannot be determined
Unlock Deck
Unlock for access to all 66 flashcards in this deck.
Unlock Deck
k this deck
35
In a particular production process, drying times for newly pained parts are uniformly distributed between 2 and 8 minutes. The probability that a part dries in less than 6
Minutes is
A) 2/6
B) 2/8
C) 3/6
D) 4/6
E) 4/8
Minutes is
A) 2/6
B) 2/8
C) 3/6
D) 4/6
E) 4/8
Unlock Deck
Unlock for access to all 66 flashcards in this deck.
Unlock Deck
k this deck
36
Speeds of cars were measured as they passed one point on a road to study whether traffic speed controls were needed. Here's a histogram and boxplot of the measured
Speeds. Accurate statements about this distribution include.
A) The distribution is fairly symmetric.
B) The distribution is right skewed with a large outlier.
C) A normal probability plot would add information about the normality of the data
Set)
D) Both A and C
E) Both B and C
Speeds. Accurate statements about this distribution include.
A) The distribution is fairly symmetric.
B) The distribution is right skewed with a large outlier.
C) A normal probability plot would add information about the normality of the data
Set)
D) Both A and C
E) Both B and C
Unlock Deck
Unlock for access to all 66 flashcards in this deck.
Unlock Deck
k this deck
37
An advocacy group is investigating whether gender has an effect on job category in large investment firms. Given the results shown in the table below, which of the
Following statements is true about gender and job category?
A) Gender and job category are independent.
B) Gender and job category are not independent.
C) Gender and job category are mutually exclusive.
D) Gender and job category are independent and mutually exclusive.
E) There is not sufficient information to determine whether gender and job category
Are independent or mutually exclusive.
IIA-1
Following statements is true about gender and job category?
A) Gender and job category are independent.
B) Gender and job category are not independent.
C) Gender and job category are mutually exclusive.
D) Gender and job category are independent and mutually exclusive.
E) There is not sufficient information to determine whether gender and job category
Are independent or mutually exclusive.
IIA-1
Unlock Deck
Unlock for access to all 66 flashcards in this deck.
Unlock Deck
k this deck
38
Suppose the time it takes for a purchasing agent to complete an online ordering process is normally distributed with a mean of 8 minutes and a standard deviation of 2
Minutes. Suppose a random sample of 25 ordering processes is selected. The standard
Deviation of the sampling distribution of mean times is
A) 0.4 minutes
B) 2 minutes
C) 0.08 minutes
D) 1.6 minutes
E) 0.12 minutes
Minutes. Suppose a random sample of 25 ordering processes is selected. The standard
Deviation of the sampling distribution of mean times is
A) 0.4 minutes
B) 2 minutes
C) 0.08 minutes
D) 1.6 minutes
E) 0.12 minutes
Unlock Deck
Unlock for access to all 66 flashcards in this deck.
Unlock Deck
k this deck
39
Insurance company records indicate that 10% of its policyholders file claims involving theft or robbery of personal property from their homes. Suppose a random sample of 400
Policyholders is selected. The standard deviation of the sampling distribution of the
Sample proportion of policyholders filing claims involving theft or robbery from their
Homes is
A) 0.000225
B) 0.25
C) 0.0455
D) 0.1667
E) 0.015
Policyholders is selected. The standard deviation of the sampling distribution of the
Sample proportion of policyholders filing claims involving theft or robbery from their
Homes is
A) 0.000225
B) 0.25
C) 0.0455
D) 0.1667
E) 0.015
Unlock Deck
Unlock for access to all 66 flashcards in this deck.
Unlock Deck
k this deck
40
A researcher is conducting a study on eating disorders. Using a list of recent participants in the online Weight Watchers program, she randomly selects a name from
The alphabetized list. She then chooses every tenth person from that point on to include
In her study. This sampling strategy is called
A) Systematic
B) Cluster
C) Random
D) Stratified
E) Judgmental
The alphabetized list. She then chooses every tenth person from that point on to include
In her study. This sampling strategy is called
A) Systematic
B) Cluster
C) Random
D) Stratified
E) Judgmental
Unlock Deck
Unlock for access to all 66 flashcards in this deck.
Unlock Deck
k this deck
41
EU (European Union) countries report that 46% of their labor force is female. The United Nations wants to determine if the percentage of females in the U.S. labor force is
The same. Based on a sample of 500 employment records, representatives from the
United States Department of Labor find that the 95% confidence interval for the
Proportion of females in the U.S. labor force is .357 to .443. If the Department of Labor
Wishes to tighten its interval, they should
A) increase the confidence level.
B) decrease the sample size.
C) increase the sample size.
D) Both A and B
E) Both A and C
Unlock Deck
Unlock for access to all 66 flashcards in this deck.
Unlock Deck
k this deck
42
EU (European Union) countries report that 46% of their labor force is female. The United Nations wants to determine if the percentage of females in the U.S. labor force is
The same. Based on a sample of 500 employment records, representatives from the
United States Department of Labor find that the 95% confidence interval for the
Proportion of females in the U.S. labor force is .357 to .443. Which of the following is the
Correct interpretation?
A) The percentage of females in the U.S. labor force is between 35.7% and 44.3%.
B) We are 95% confident that between 35.7% and 44.3% of the persons in the U.S. labor
Force is female.
C) The margin of error for the true percentage of females in the U.S. labor force is
Between 35.7% and 44.3%.
D) All samples of size 500 will yield a percentage of females in the U.S. labor force that
Falls within 35.7% and 44.3%.
E) None of the above.
Unlock Deck
Unlock for access to all 66 flashcards in this deck.
Unlock Deck
k this deck
43
A large software development firm recently relocated its facilities. Top management
is interested in fostering good relations with their new local community and has
encouraged their professional employees to engage in local service activities. They wish
to determine the average number of hours the firm's professionals volunteer per month.
A random sample of 24 professionals reported the following number of hours:
A. Based on the sample results, find the 95% confidence interval and interpret.
b. For a more accurate determination, top management wants to estimate the average
number of hours volunteered per month by their professional staff to within one hour with
99% confidence. How many randomly selected professional employees would they need
to sample?
c. Suppose 40 professional employees are randomly selected. This sample yields a mean
of 15.2 hours and a standard deviation of 1.8 hours. Find a 95% confidence interval and
interpret.
is interested in fostering good relations with their new local community and has
encouraged their professional employees to engage in local service activities. They wish
to determine the average number of hours the firm's professionals volunteer per month.
A random sample of 24 professionals reported the following number of hours:
A. Based on the sample results, find the 95% confidence interval and interpret.
b. For a more accurate determination, top management wants to estimate the average
number of hours volunteered per month by their professional staff to within one hour with
99% confidence. How many randomly selected professional employees would they need
to sample?
c. Suppose 40 professional employees are randomly selected. This sample yields a mean
of 15.2 hours and a standard deviation of 1.8 hours. Find a 95% confidence interval and
interpret.
Unlock Deck
Unlock for access to all 66 flashcards in this deck.
Unlock Deck
k this deck
44
The U.S. Department of Labor wants to estimate the percentage of females in the labor force to within ±5% with 90% confidence. As a planning value they use 46%, the
Reported percentage of females in the labor force of EU (European Union) countries.
How many employment records should be sampled?
A) 121
B) 269
C) 451
D) 382
E) 1000
Reported percentage of females in the labor force of EU (European Union) countries.
How many employment records should be sampled?
A) 121
B) 269
C) 451
D) 382
E) 1000
Unlock Deck
Unlock for access to all 66 flashcards in this deck.
Unlock Deck
k this deck
45
EU (European Union) countries report that 46% of their labor force is female. The United Nations wants to determine if the percentage of females in the U.S. labor force is
The same. Representatives from the United States Department of Labor select a random
Sample of 525 from over 10,000 employment records on file and find that 229 are female.
The 90% confidence interval for the proportion of females in the U.S. labor force is
A) 0.3998 to 0.4722
B) 0.2747 to 0.5973
C) 0.1776 to 0.6944
D) 0.4235 to 0.5679
E) 0.1243 to 0.7100
Unlock Deck
Unlock for access to all 66 flashcards in this deck.
Unlock Deck
k this deck
46
A small business ships specialty homemade candies to anywhere in the world. Past
records indicate that the weight of orders is normally distributed. Suppose a random
sample of 16 orders is selected and each is weighed. The sample mean was found to be
110 grams with a standard deviation of 14 grams.
A. Describe the sampling distribution for the sample mean.
b. What is the standard error?
c. For 90% confidence, what is the margin of error?
d. Based on the sample results, create the 90% confidence interval and interpret.
Unlock Deck
Unlock for access to all 66 flashcards in this deck.
Unlock Deck
k this deck
47
Automobile mechanics conduct diagnostic tests on 150 new cars of particular make and model to determine the extent to which they are affected by a recent recall due to
Faulty catalytic converters. They find that 42 of the new cars tested do have faulty
Catalytic converters. The 99% confidence interval for the true proportion of new cars
With faulty catalytic converters is
A) 0.1856 to 0.3744
B) 0.2434 to 0.3166
C) 0.2081 to 0.3519
D) 0.1660 to 0.3940
E) 0.1243 to 0.4123
Unlock Deck
Unlock for access to all 66 flashcards in this deck.
Unlock Deck
k this deck
48
A recent poll of 120 adults who frequent the local farmer's market found that 54 have purchased reusable cloth bags for their groceries. The 95% confidence interval for the
Proportion of adults who have purchased reusable cloth bags is
A) 0.361 to 0.539
B) 0.4046 to 0.4954
C) 0.4383 to 0.4617
D) 0.205 to 0.525
E) 0.3856 to 0.4896
Proportion of adults who have purchased reusable cloth bags is
A) 0.361 to 0.539
B) 0.4046 to 0.4954
C) 0.4383 to 0.4617
D) 0.205 to 0.525
E) 0.3856 to 0.4896
Unlock Deck
Unlock for access to all 66 flashcards in this deck.
Unlock Deck
k this deck
49
One division of a large defense contractor manufactures telecommunication equipment for the military. This division reports that 12% of non-electrical components
Are reworked. Management wants to determine if this percentage is the same as the
Percentage rework for the company's electrical components. Based on a random sample
Of 450 electrical components, they find that 46 had to be reworked. The 99% confidence
Interval is
A) 0.0652, 0.1388
B) 0.0432, 0.1608
C) 0.0763, 0.1277
D) 0.0541, 0.1499
E) None of the above.
Unlock Deck
Unlock for access to all 66 flashcards in this deck.
Unlock Deck
k this deck
50
Grandma Gertrude's Chocolates, a family owned business, has an opportunity to
supply its product for distribution through a large coffee house chain. However, the
coffee house chain has certain specifications regarding cacao content as it wishes to
advertise the health benefits (antioxidants) of the chocolate products it sells. In order to
determine the mean % cacao in its dark chocolate products, quality inspectors sample 36
pieces. They find a sample mean of 55% with a standard deviation of 4%.
A. Describe the sampling distribution for the sample mean.
b. What is the standard error?
c. What is the margin of error for 90% confidence?
d. What is the margin of error for 95% confidence?
e. Based on the sample results, find the 90% confidence interval and interpret.
f. Based on the sample results, find the 95% confidence interval and interpret.
g. For a more accurate determination of the mean weight, the quality control inspectors
wish to estimate it within 1% with 95% confidence. How many pieces of dark chocolate
should they sample?
Unlock Deck
Unlock for access to all 66 flashcards in this deck.
Unlock Deck
k this deck
51
One division of a large defense contractor manufactures telecommunication equipment for the military. This division reports that 12% of non-electrical components
Are reworked. Management wants to determine if this percentage is the same as the
Percentage rework for the company's electrical components. The Quality Control
Department plans to check a random sample of the over 10,000 electrical components
Manufactured across all divisions. The resulting 95% confidence interval based on these
Data is .0758 to .1339. Which of the following is the correct interpretation?
A) The percentage of electronic components that are reworked is between 7.6% and
13)4%.
B) We are 95% confident that between 7.6% and 13.4% of electrical components are
Reworked.
C) The margin of error for the true percentage of electrical components that are
Reworked is between 7.6% and 13.4%.
D) All samples of size 450 will yield a percentage of reworked electrical components
That falls within 7.6% and 13.4%.
E) None of the above.
Unlock Deck
Unlock for access to all 66 flashcards in this deck.
Unlock Deck
k this deck
52
EU (European Union) countries report that 46% of their labor force is female. The
United Nations wants to determine if the percentage of females in the U.S. labor force is
the same. Representatives from the United States Department of Labor plan to check a
random sample of over 10,000 employment records on file to estimate the percentage of
females in the U.S. labor force.
A. The Department of Labor wants to estimate the percentage of females in the U.S. labor
force to within ±5%, with 90% confidence. How many employment records should be
sampled?
b. They actually select a random sample of 525 employment records, and find that 229 of
the people are females. Construct the 90% confidence interval.
c. Interpret the confidence interval in this context.
d. Explain what 90% confidence means in this context.
e. Should representatives from the Department of Labor conclude that the percentage of
females in the U.S. labor force is lower than Europe's rate of 46%? Explain.
f. Are the assumptions and conditions for constructing a confidence interval met?
Explain.
Unlock Deck
Unlock for access to all 66 flashcards in this deck.
Unlock Deck
k this deck
53
A recent poll of 120 adults who frequent the local farmer's market found that 54 have purchased reusable cloth bags for their groceries. Based on these data, what is the margin
Of error for a 95% confidence interval of the proportion of adults who have purchased
Reusable cloth bags?
A) 0.0454
B) 0.0117
C) 0.089
D) 0.075
E) 0.0432
Of error for a 95% confidence interval of the proportion of adults who have purchased
Reusable cloth bags?
A) 0.0454
B) 0.0117
C) 0.089
D) 0.075
E) 0.0432
Unlock Deck
Unlock for access to all 66 flashcards in this deck.
Unlock Deck
k this deck
54
EU (European Union) countries report that 46% of their labor force is female. The United Nations wants to determine if the percentage of females in the U.S. labor force is
The same. Based on a sample of 500 employment records, representatives from the
United States Department of Labor find that 240 are female. What is the margin of error
For the 95% confidence interval of the proportion of females in the U.S. labor force?
A) 0.022
B) 0.044
C) 0.036
D) 0.056
E) 0.089
The same. Based on a sample of 500 employment records, representatives from the
United States Department of Labor find that 240 are female. What is the margin of error
For the 95% confidence interval of the proportion of females in the U.S. labor force?
A) 0.022
B) 0.044
C) 0.036
D) 0.056
E) 0.089
Unlock Deck
Unlock for access to all 66 flashcards in this deck.
Unlock Deck
k this deck
55
All else being equal, increasing the level of confidence desired will
A) tighten the confidence interval.
B) decrease the margin of error.
C) increase precision.
D) increase the margin of error.
E) Both A and D.
A) tighten the confidence interval.
B) decrease the margin of error.
C) increase precision.
D) increase the margin of error.
E) Both A and D.
Unlock Deck
Unlock for access to all 66 flashcards in this deck.
Unlock Deck
k this deck
56
The U.S. Department of Labor wants to estimate the percentage of females in the labor force to within ±2% with 90% confidence. As a planning value they use 46%, the
Reported percentage of females in the labor force of EU (European Union) countries.
How many employment records should be sampled?
A) 121
B) 269
C) 451
D) 382
E) 1681
Reported percentage of females in the labor force of EU (European Union) countries.
How many employment records should be sampled?
A) 121
B) 269
C) 451
D) 382
E) 1681
Unlock Deck
Unlock for access to all 66 flashcards in this deck.
Unlock Deck
k this deck
57
Which of the following is not an assumption and/or condition required for constructing a confidence interval for the proportion?
A) Randomization condition
B) Linearity condition
C) Success/Failure condition
D) 10% condition
E) None of the above
A) Randomization condition
B) Linearity condition
C) Success/Failure condition
D) 10% condition
E) None of the above
Unlock Deck
Unlock for access to all 66 flashcards in this deck.
Unlock Deck
k this deck
58
Suppose that the store chain of Electronics Plus sells extended warranties to 20% of
customers who purchase electronic devices. A local Seattle store samples 300 customers
from their data base.
A. What proportion of customers would they expect to have purchased extended
warranties?
b. What is the standard deviation of the sample proportion?
c. What shape would you expect the sampling distribution of the proportion to have?
d. Would you be surprised to find out that in a sample of 300, 40 of the customers
purchased extended warranties? Explain. What might account for this high percentage?
Unlock Deck
Unlock for access to all 66 flashcards in this deck.
Unlock Deck
k this deck
59
Insurance companies track life expectancy information to assist in determining the
cost of life insurance policies. Last year the average life expectancy of all policyholders
was 77 years. ABI Insurance wants to determine if their clients now have a longer life
expectancy, on average, so they randomly sample some of their recently paid policies.
The ages of the clients in the sample are shown below.
A. Based on the sample results, find the 90% confidence interval and interpret.
b. For more accurate cost determination, ABI Insurance wants to estimate the average life
expectancy to within one year with 95% confidence. How many randomly selected
recently paid policies would they need to sample?
c. Suppose ABI samples 100 recently paid policies. This sample yields a mean of 77.7
years and a standard deviation of 3.6 years. Find a 90% confidence interval and interpret.
cost of life insurance policies. Last year the average life expectancy of all policyholders
was 77 years. ABI Insurance wants to determine if their clients now have a longer life
expectancy, on average, so they randomly sample some of their recently paid policies.
The ages of the clients in the sample are shown below.
A. Based on the sample results, find the 90% confidence interval and interpret.
b. For more accurate cost determination, ABI Insurance wants to estimate the average life
expectancy to within one year with 95% confidence. How many randomly selected
recently paid policies would they need to sample?
c. Suppose ABI samples 100 recently paid policies. This sample yields a mean of 77.7
years and a standard deviation of 3.6 years. Find a 90% confidence interval and interpret.
Unlock Deck
Unlock for access to all 66 flashcards in this deck.
Unlock Deck
k this deck
60
Automobile mechanics conduct diagnostic tests on 150 new cars of particular make and model to determine the extent to which they are affected by a recent recall due to
Faulty catalytic converters. They find that 42 of the new cars tested do have faulty
Catalytic converters. What is the margin of error for a 99% confidence interval based on
These sample results?
A) 0.0366
B) 0.0719
C) 0.0944
D) 0.1140
E) 0.2876
Faulty catalytic converters. They find that 42 of the new cars tested do have faulty
Catalytic converters. What is the margin of error for a 99% confidence interval based on
These sample results?
A) 0.0366
B) 0.0719
C) 0.0944
D) 0.1140
E) 0.2876
Unlock Deck
Unlock for access to all 66 flashcards in this deck.
Unlock Deck
k this deck
61
The Quality Control Department wants to estimate the true percentage of rework for electrical components to within ±4%, with 99% confidence. Based on similar past
Studies, the percentage of rework was found to be 12%. How many components should
They sample?
A) 651
B) 1000
C) 344
D) 438
E) 579
Studies, the percentage of rework was found to be 12%. How many components should
They sample?
A) 651
B) 1000
C) 344
D) 438
E) 579
Unlock Deck
Unlock for access to all 66 flashcards in this deck.
Unlock Deck
k this deck
62
The unemployment rate of persons with a disability is typically higher than for those with no disability. Recent statistics report that the national rate of unemployment among
This group is 14.5%. The local government of a small city wants to determine the rate in
Its region to within ±5%, with 95% confidence. How many individuals with disabilities
Should they sample?
A) 135
B) 191
C) 354
D) 678
E) 981
This group is 14.5%. The local government of a small city wants to determine the rate in
Its region to within ±5%, with 95% confidence. How many individuals with disabilities
Should they sample?
A) 135
B) 191
C) 354
D) 678
E) 981
Unlock Deck
Unlock for access to all 66 flashcards in this deck.
Unlock Deck
k this deck
63
The unemployment rate of persons with a disability is typically higher than for those with no disability. Recent statistics report that the national rate of unemployment among
This group is 14.5%. The local government of a small city wants to determine the rate in
Its region to within ±5%, with 90% confidence. How many individuals with disabilities
Should they sample?
A) 135
B) 191
C) 354
D) 678
E) 981
This group is 14.5%. The local government of a small city wants to determine the rate in
Its region to within ±5%, with 90% confidence. How many individuals with disabilities
Should they sample?
A) 135
B) 191
C) 354
D) 678
E) 981
Unlock Deck
Unlock for access to all 66 flashcards in this deck.
Unlock Deck
k this deck
64
One division of a large defense contractor manufactures telecommunication equipment for the military. This division reports that 12% of non-electrical components
Are reworked. Management wants to determine if this percentage is the same as the
Percentage rework for the company's electrical components. The Quality Control
Department plans to check a random sample of the over 10,000 electrical components
Manufactured across all divisions. The 95% confidence interval based on this data is
)0758 to .1339. Should management conclude that the percentage of rework for
Electrical components is lower than the rate of 12% for non-electrical components?
A) Yes, because the lower limit of the confidence interval is 7.6%.
B) Yes, because 12% is contained with the 95% confidence interval.
C) No, because 12% is contained with the 95% confidence interval.
D) No, because the upper limit of the confidence interval is 13.4%.
E) None of the above.
Unlock Deck
Unlock for access to all 66 flashcards in this deck.
Unlock Deck
k this deck
65
Recent statistics report that the national rate of unemployment among persons with disabilities is 14.5%. The local government of a small city samples 200 individuals with
Disabilities and finds that 44 are unemployed. The 99% confidence interval for the
Unemployment rate among persons with disabilities in their city is
A) 0.1646 to 0.2754
B) 0.1735 to 0.2665
C) 0.1446 to 0.2954
D) 0.1332 to 0.3298
E) 0.1145 to 0.4374
Disabilities and finds that 44 are unemployed. The 99% confidence interval for the
Unemployment rate among persons with disabilities in their city is
A) 0.1646 to 0.2754
B) 0.1735 to 0.2665
C) 0.1446 to 0.2954
D) 0.1332 to 0.3298
E) 0.1145 to 0.4374
Unlock Deck
Unlock for access to all 66 flashcards in this deck.
Unlock Deck
k this deck
66
All else being equal, decreasing the level of confidence desired will
A) widen the confidence interval.
B) increase the margin of error.
C) increase certainty.
D) decrease the margin of error.
E) Both A and B.
A) widen the confidence interval.
B) increase the margin of error.
C) increase certainty.
D) decrease the margin of error.
E) Both A and B.
Unlock Deck
Unlock for access to all 66 flashcards in this deck.
Unlock Deck
k this deck
Unlock Deck
Unlock for access to all 66 flashcards in this deck.


