Deck 4: Correlation and Linear Regression
Full screen (f)
Question
Question
Question
Question
A recent report evaluated the price and performance of 25 models of smartphones. Computer output gives the summary statistics for the prices ($) shown in the table.
The IQR for these data is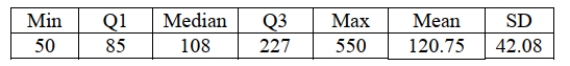
A) $ 142
B) $ 58
C) $ 323
D) $ 442
E) $ 500
The IQR for these data is
A) $ 142
B) $ 58
C) $ 323
D) $ 442
E) $ 500
Question
A recent survey of online shoppers asked them to indicate the primary reason they shop via the Internet. The table summarizes responses by reason and gender. What
Percent of males cite Convenience as the primary reason they shop online?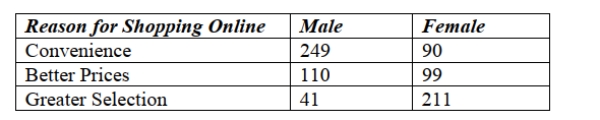
A) 42%
B) 73%
C) 62%
D) 31%
E) 50%
Percent of males cite Convenience as the primary reason they shop online?
A) 42%
B) 73%
C) 62%
D) 31%
E) 50%
Question
Question
Which is true for the data shown in the histogram? 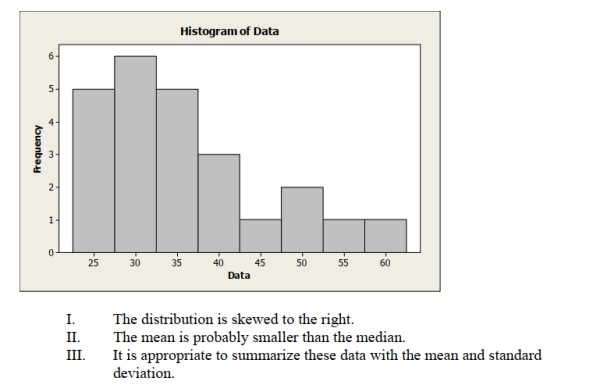
A) I only
B) II only
C) I and II
D) I and III
E) I, II and III
A) I only
B) II only
C) I and II
D) I and III
E) I, II and III
Question
Boxplots of earnings per share (EPS) data for a sample of retail company stocks and a sample of energy company stocks are shown below. Which of the following statements
Is correct?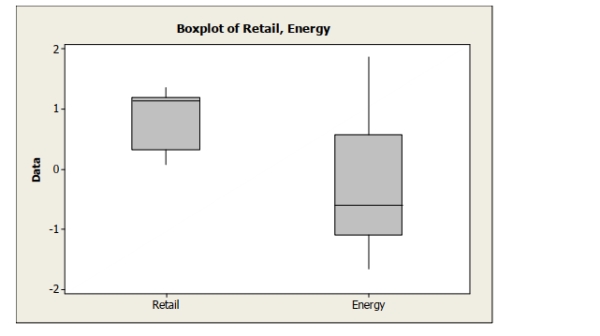
A) The median EPS is higher for energy stocks compared to retail stocks.
B) The median EPS is higher for retail stocks compared to energy stocks.
C) The IQR for the EPS data is larger for retail stocks than for energy stocks.
D) The EPS data are more variable for retail stocks than for energy stocks.
E) The mean is higher for energy stocks compared to retail stocks.
Question
Question
A government agency has 6000 employees. As an alternative to the traditional five day work week, employees were asked whether they preferred a four day work week (10
Hours per day) or flexible hours. The segmented bar chart below is based on the data
Collected. Which of the following statements is true about work week preferences and
Age category?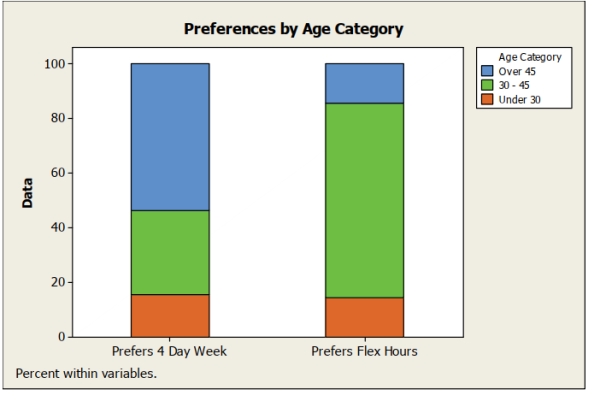
A) A greater percentage of employees who prefer a 4 day work week are in the over
45 age category compared to those who prefer flex hours.
B) A greater percentage of employees who prefer flex hours are in the over 45 age
Category compared to those who prefer a 4 day work week.
C) Preferences appear to be independent of age.
D) The distribution of preferences are the same across different age groups.
E) The segmented bar chart is not appropriate for these data.
Question
Boxplots of earnings per share (EPS) data for a sample of retail company stocks and a sample of energy company stocks are shown below. Which of the following statement
Is true about the distributions of EPS for retail and energy stocks?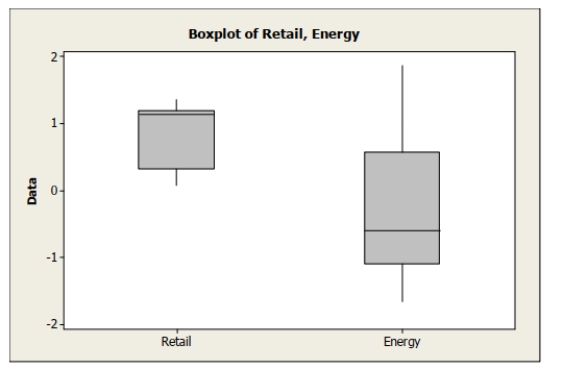
A) The distribution of EPS for retail stocks is skewed to the right.
B) The distribution of EPS for energy stocks is symmetric.
C) Both distributions of EPS are symmetric.
D) The distribution of EPS for retail stocks is skewed to the left.
E) The distribution of EPS for energy stocks is skewed to the left.
Question
A government agency has 6000 employees. As an alternative to the traditional five day work week, employees were asked whether they preferred a four day work week (10
Hours per day) or flexible hours. The table below shows the results by age category.
The most appropriate display for these data is a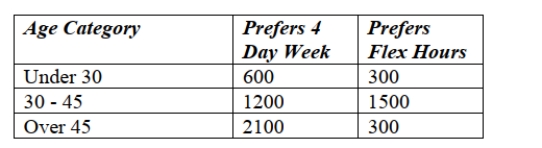
A) histogram.
B) stem and leaf display.
C) boxplot.
D) segmented bar chart.
E) frequency table.
Hours per day) or flexible hours. The table below shows the results by age category.
The most appropriate display for these data is a
A) histogram.
B) stem and leaf display.
C) boxplot.
D) segmented bar chart.
E) frequency table.
Question
The following scatterplot shows output/unit capital and years. The data show 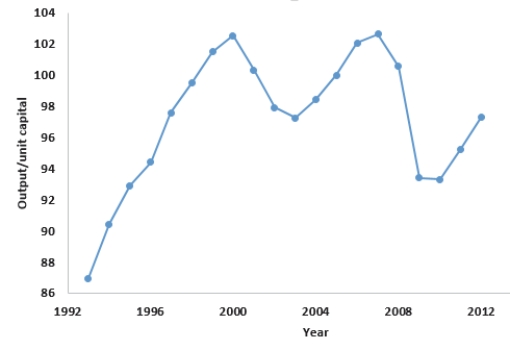
A) There is no consistent increasing or decreasing over time.
B) There is no evidence of a seasonal component.
C) There is some evidence of a cyclical component.
D) There is no linear trend over the time period.
E) All of the above.
A) There is no consistent increasing or decreasing over time.
B) There is no evidence of a seasonal component.
C) There is some evidence of a cyclical component.
D) There is no linear trend over the time period.
E) All of the above.
Question
Question
A recent survey of online shoppers asked them to indicate the primary reason they shop via the Internet. The table summarizes responses by reason and gender. What
Percent of respondents cite Convenience as the primary reason they shop online?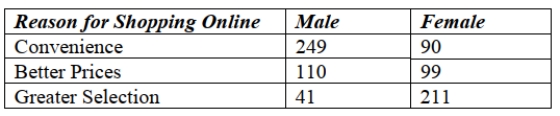
A) 42%
B) 23%
C) 62%
D) 85%
E) 33%
Percent of respondents cite Convenience as the primary reason they shop online?
A) 42%
B) 23%
C) 62%
D) 85%
E) 33%
Question
A recent survey of online shoppers asked them to indicate the primary reason they shop via the Internet. The table summarizes responses by reason and gender. What
Percent of respondents who cited Greater Selection as the primary reason they shop
Online were females?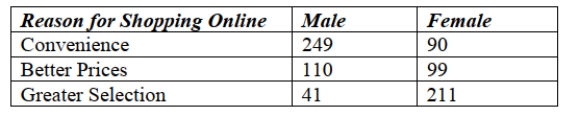
A) 53%
B) 27%
C) 50%
D) 84%
E) 42%
Percent of respondents who cited Greater Selection as the primary reason they shop
Online were females?
A) 53%
B) 27%
C) 50%
D) 84%
E) 42%
Question
The following scatterplot shows output/hour labor and years. The graphical display is an example of what type of data? 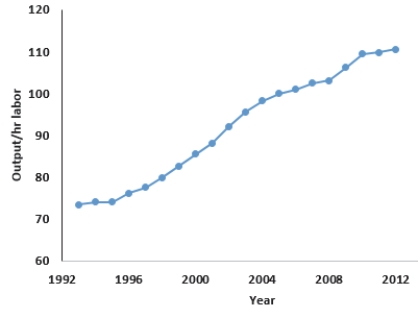
A) Cross-sectional
B) Nominal
C) Categorical
D) Time Series
E) Ordinal
A) Cross-sectional
B) Nominal
C) Categorical
D) Time Series
E) Ordinal
Question
Question
A recent report evaluated the price and performance of 25 models of smartphones. Computer output gives the summary statistics for the prices ($) shown in the table. Based
On these results, which of the following is true?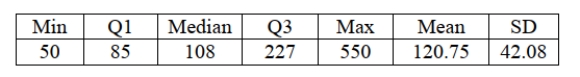
A) The distribution is symmetric.
B) The distribution is skewed to the right.
C) The distribution is skewed to the left.
D) The mean is a better measure of center for these data than the median.
E) The standard deviation is larger than the range.
On these results, which of the following is true?
A) The distribution is symmetric.
B) The distribution is skewed to the right.
C) The distribution is skewed to the left.
D) The mean is a better measure of center for these data than the median.
E) The standard deviation is larger than the range.
Question
A consumer research group investigating the relationship between the price of meat (per pound) and the fat content (grams) gathered data that produced the following
Scatterplot. The residual of the point ($2.00 per pound, 6 grams of fat) is
A) A large positive value
B) A large negative value
C) Affecting the correlation of the variables
D) Both B and C
E) Both A and C
Scatterplot. The residual of the point ($2.00 per pound, 6 grams of fat) is
A) A large positive value
B) A large negative value
C) Affecting the correlation of the variables
D) Both B and C
E) Both A and C
Question
Prices per share of the 20 most actively traded stocks on the New York Stock Exchange in October, 2012. A histogram for these data are shown below.
The data can be described as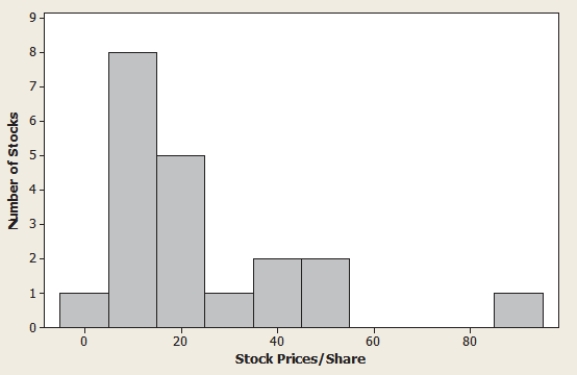
A) The data are skewed to the left with a large positive outlier.
B) 5.9 %
C) 17.9 %
D) The data are skewed to the right with a large positive outlier.
E) 13.4 %
The data can be described as
A) The data are skewed to the left with a large positive outlier.
B) 5.9 %
C) 17.9 %
D) The data are skewed to the right with a large positive outlier.
E) 13.4 %
Question
Question
Prices per share of the 20 most actively traded stocks on the New York Stock Exchange in October, 2012. Summary statistics for these data are shown below. The
IQR for this set of dataset is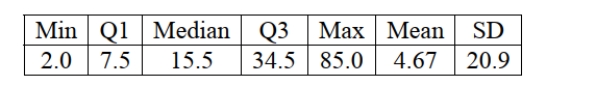
A) 83
B) 27
C) 13.5
D) 69.5
E) None of the above
IQR for this set of dataset is
A) 83
B) 27
C) 13.5
D) 69.5
E) None of the above
Question
A magazine that publishes product reviews conducted a survey of teenagers' preferences for cell phones. Three brands of cell phone designed specifically with teens
In mind were the focus of the study. The table summarizes responses by brand and
Gender. What percent of teenagers who preferred the BlackJack II were males?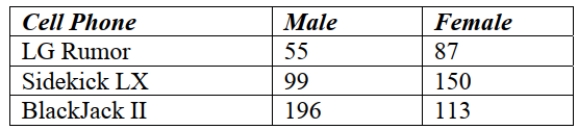
A) 63%
B) 32%
C) 16%
D) 50%
E) 41%
In mind were the focus of the study. The table summarizes responses by brand and
Gender. What percent of teenagers who preferred the BlackJack II were males?
A) 63%
B) 32%
C) 16%
D) 50%
E) 41%
Question
US public debt per capita historical data for the years 2009-2013 yields the following scatterplot: 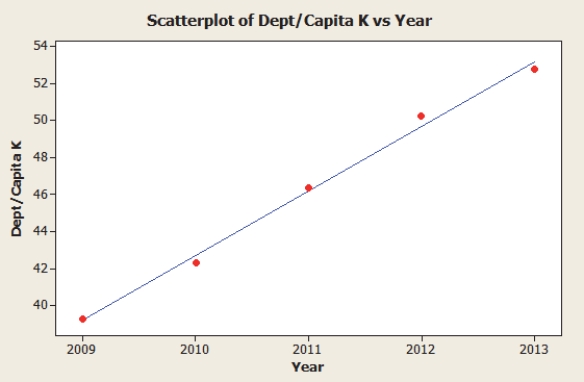
A) About 99.5% of the variability in debt per capita is explained by the model.
B) On average, debt per capita increases $3.49K per year.
C) The response variable is "year."
D) Both A and B.
E) All of the above.
A) About 99.5% of the variability in debt per capita is explained by the model.
B) On average, debt per capita increases $3.49K per year.
C) The response variable is "year."
D) Both A and B.
E) All of the above.
Question
Question
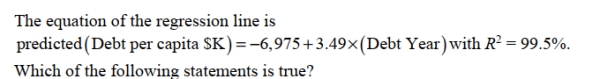
An advocacy group is investigating whether gender has an effect on job category in large investment firms. She surveyed a sample of firms with the results shown below.
Which of the following statements is true about gender and job category?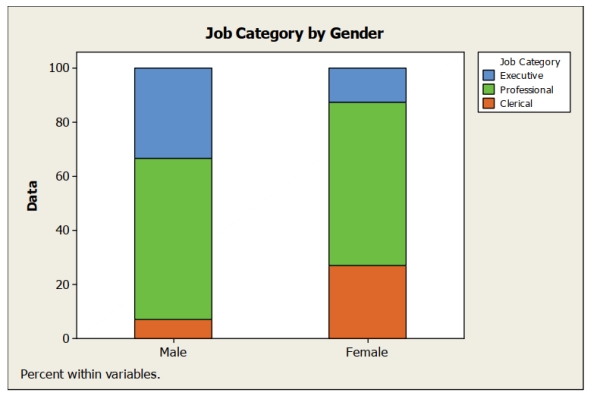
A) A greater percentage of males are executives compared to females.
B) A greater percentage of females are executives compared to males.
C) Job category appears to be independent of gender.
D) A smaller percentage of females are clerical compared to males.
E) The segmented bar chart is not appropriate for these data.
Question
Question
A magazine that publishes product reviews conducted a survey of teenagers' preferences for cell phones. Three brands of cell phone designed specifically with teens
In mind were the focus of the study. The table summarizes responses by brand and
Gender. What percent of teenagers preferred LG Rumor?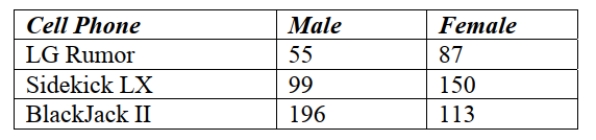
A) 50%
B) 41%
C) 25%
D) 16%
E) 20%
In mind were the focus of the study. The table summarizes responses by brand and
Gender. What percent of teenagers preferred LG Rumor?
A) 50%
B) 41%
C) 25%
D) 16%
E) 20%
Question
The following scatterplot shows monthly sales figures (in units) and number of months of experience on the job for a sample of 19 salespeople. Estimate the correlation. 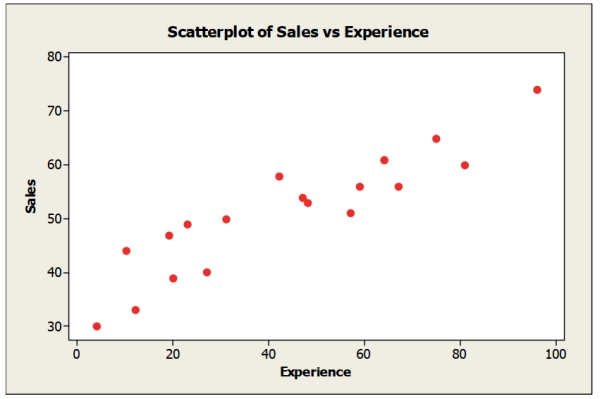
A) -0.3
B) +0.7
C) -0.7
D) +0.3
E) 0.0
A) -0.3
B) +0.7
C) -0.7
D) +0.3
E) 0.0
Question
Question
Question
An advocacy group is investigating whether gender has an effect on job category in large investment firms. She surveyed a sample of firms with the results shown below.
The most appropriate display for these data is a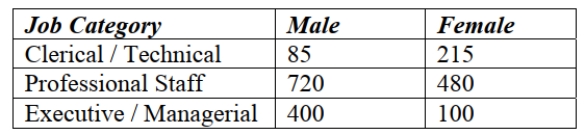
A) histogram.
B) stem and leaf display.
C) boxplot.
D) segmented bar chart.
E) frequency table.
The most appropriate display for these data is a
A) histogram.
B) stem and leaf display.
C) boxplot.
D) segmented bar chart.
E) frequency table.
Question
An office supply chain has stores in two locations, Dayton and Scranton. One of these stores is to be closed within the coming year, and to help make the decision,
Management reviews sales data. Below are boxplots for monthly unit sales for both
Locations.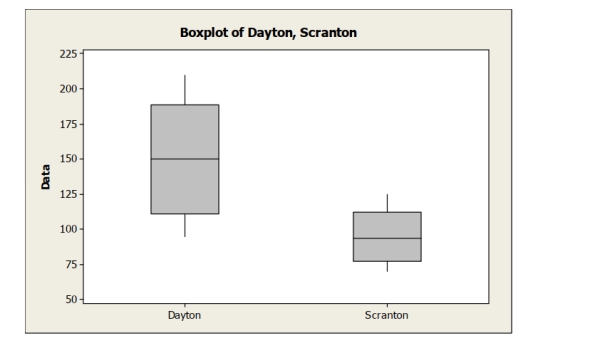 Which of the following statement is not correct?
A) Monthly sales are higher in Dayton compared to Scranton.
B) The IQR for sales in Dayton is larger than that for Scranton.
C) Monthly sales are less variable in Scranton compared to Dayton.
D) Both distributions are fairly symmetric.
E) Monthly sales are more variable in Scranton compared to Dayton.
Management reviews sales data. Below are boxplots for monthly unit sales for both
Locations.
Which of the following statement is not correct?A) Monthly sales are higher in Dayton compared to Scranton.
B) The IQR for sales in Dayton is larger than that for Scranton.
C) Monthly sales are less variable in Scranton compared to Dayton.
D) Both distributions are fairly symmetric.
E) Monthly sales are more variable in Scranton compared to Dayton.
Question
Question
A consumer research group investigating the relationship between the price of meat (per pound) and the fat content (grams) gathered data that produced the following
Scatterplot. Which description of the association between fat content and price is more
Accurate?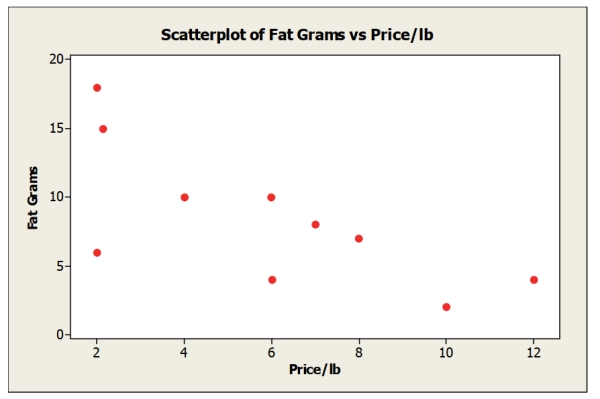
A) If the point ($2.00 per pound, 6 grams of fat) is removed, the correlation will be
Higher.
B) If the point ($2.00 per pound, 6 grams of fat) is removed, the correlation will be
Lower.
C) Increased fat content generally results in decreased price/lb.
D) Both B and C
E) Both A and C
Question
A magazine that publishes product reviews conducted a survey of teenagers' preferences for cell phones. Three brands of cell phone designed specifically with teens
In mind were the focus of the study. The table summarizes responses by brand and
Gender. What percent of female teenagers preferred the Sidekick LX?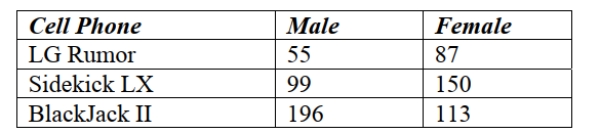
A) 43%
B) 60%
C) 21%
D) 50%
E) 16%
In mind were the focus of the study. The table summarizes responses by brand and
Gender. What percent of female teenagers preferred the Sidekick LX?
A) 43%
B) 60%
C) 21%
D) 50%
E) 16%
Question
A business researcher conducted a survey of 500 women to determine preferences for types of automobiles. The types are shown below along with the number of women who
Prefer that type. Which of the following charts would be appropriate for displaying these
Data?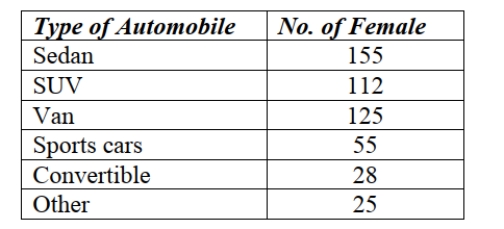
A) Histogram
B) Boxplot
C) Pie Chart
D) Line Graph
E) Stem and Leaf Display
Prefer that type. Which of the following charts would be appropriate for displaying these
Data?
A) Histogram
B) Boxplot
C) Pie Chart
D) Line Graph
E) Stem and Leaf Display
Question
Which is true of the data shown in the histogram? 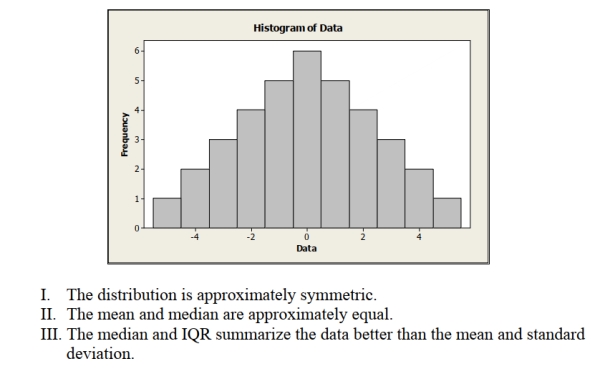
A) I only
B) III only
C) I and II
D) I and III
E) I, II and III
A) I only
B) III only
C) I and II
D) I and III
E) I, II and III
Question
The following scatterplot shows monthly sales figures (in units) and number of months of experience on the job for a sample of 19 salespeople. Describe the association
Between monthly sales and level of experience.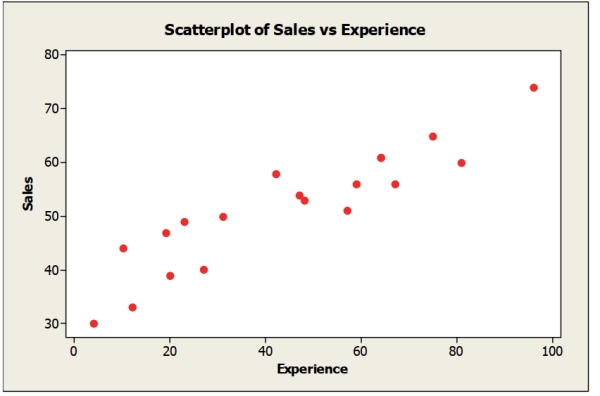
A) Wear negative linear association
B) Moderate positive linear association
C) Moderate negative linear association
D) Weak positive linear association
E) Non-linear
Between monthly sales and level of experience.
A) Wear negative linear association
B) Moderate positive linear association
C) Moderate negative linear association
D) Weak positive linear association
E) Non-linear
Question
Question
Below is a stem and leaf display of prices for a sample homes recently sold in a metropolitan area in the southeastern region of the U.S. 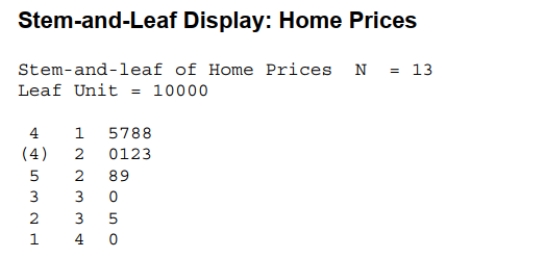 Which of the following statements is true?
A) The mean would be more appropriate than the median to describe the center of
This distribution.
B) This distribution is fairly symmetric.
C) This distribution is right skewed.
D) This distribution is left skewed.
E) Both A and C
Which of the following statements is true?A) The mean would be more appropriate than the median to describe the center of
This distribution.
B) This distribution is fairly symmetric.
C) This distribution is right skewed.
D) This distribution is left skewed.
E) Both A and C
Question
Question
A consumer research group investigating the relationship between the price of meat
(per pound) and the fat content (grams) gathered data that produced the following
scatterplot.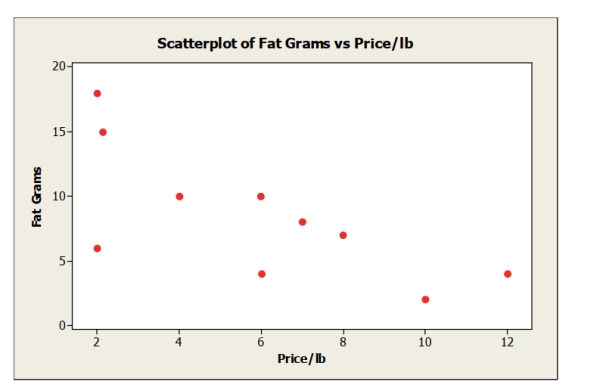
A. Describe the association between the price of meat and fat content.
b. Estimate the correlation.
c. If the point in the lower left hand corner ($2.00 per pound, 6 grams of fat) is removed,
would the correlation become stronger or weaker or remain the same? Explain.
Question
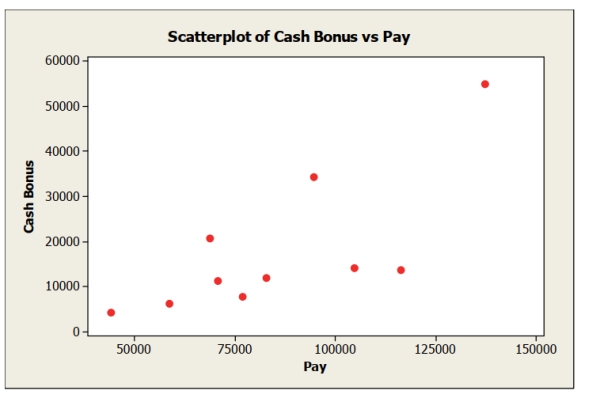
To determine whether the cash bonus paid by a company is related to annual pay, data were gathered for 10 loan officers at AMC Bank who received cash bonuses in 2012. The data, scatterplot, and summary statistics are shown below. 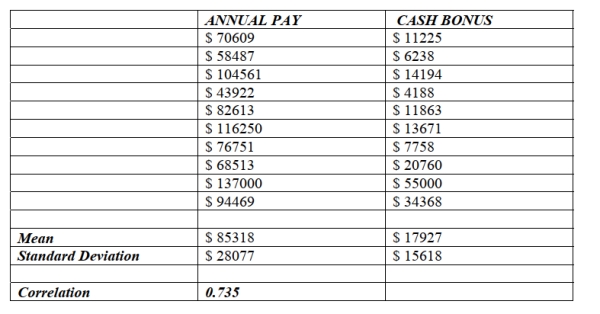
 Model a linear relationship with a least squares regression model.
Find the value of R2. Interpret its meaning in this context.
Model a linear relationship with a least squares regression model.Find the value of R2. Interpret its meaning in this context.
Question
To determine whether the cash bonus paid by a company is related to annual pay, data were gathered for 10 loan officers at AMC Bank who received cash bonuses in 2012. The data, scatterplot, and summary statistics are shown below. Model a linear relationship with a least squares regression model.
Estimate the linear regression model that relates the response variable (cash bonus) to the predictor variable (annual pay).
A. Find the slope of the regression line.
b. Find the intercept of the regression line.
c. Write the equation of the linear model.
Model a linear relationship with a least squares regression model.Estimate the linear regression model that relates the response variable (cash bonus) to the predictor variable (annual pay).
A. Find the slope of the regression line.
b. Find the intercept of the regression line.
c. Write the equation of the linear model.
Question
A small independent organic food store offers a variety of specialty coffees. To determine whether price has an impact on sales, the managers kept track of how many pounds of each variety of coffee were sold last month. The data, scatterplot, and summary statistics are shown below.
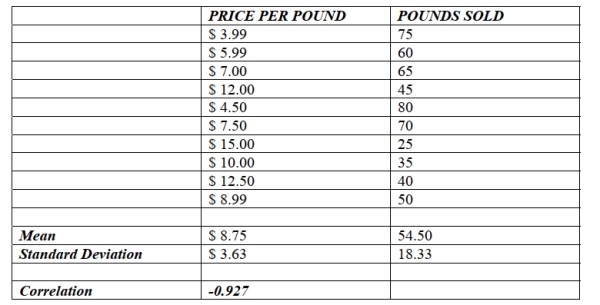
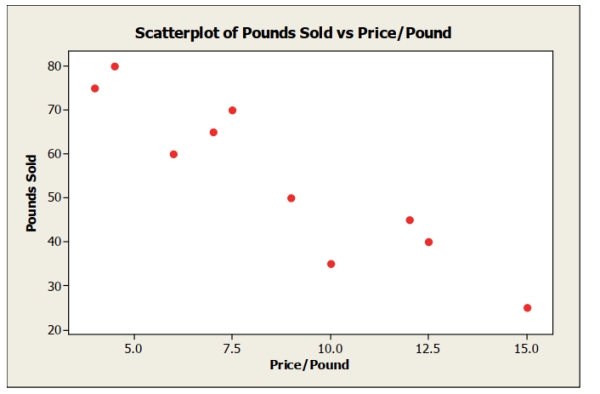
Comment on whether each of the following conditions for correlation / linear
regression is met.
A. Quantitative variable condition.
b. Linearity condition.
c. Outlier condition.
Question
The following scatterplot shows monthly sales figures (in units) and number of
months of experience on the job for a sample of 19 salespeople.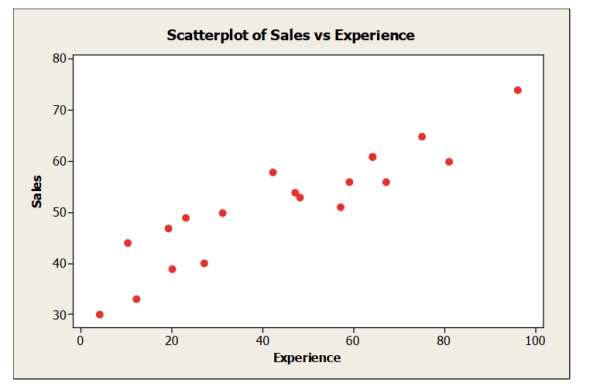
A. Describe the association between monthly sales and level of experience.
b. Do these data satisfy the conditions for computing a correlation coefficient? Explain.
c. Estimate the correlation.
months of experience on the job for a sample of 19 salespeople.
A. Describe the association between monthly sales and level of experience.
b. Do these data satisfy the conditions for computing a correlation coefficient? Explain.
c. Estimate the correlation.
Question
Question
Shown below is a correlation table showing correlation coefficients between stock
price, earnings per share (EPS), and price/earnings (P/E) ratio for a sample of 19 publicly
traded companies.
A. What is the correlation between stock price and EPS? Interpret.
b. What is the correlation between stock price and PE? Interpret.
c. What is the correlation between EPS and PE? Interpret.
Question
Question
Question
A small independent organic food store offers a variety of specialty coffees. To determine whether price has an impact on sales, the managers kept track of how many pounds of each variety of coffee were sold last month. The data, scatterplot, and summary statistics are shown below.
Find the value of R2. Interpret its meaning in this context.
Find the value of R2. Interpret its meaning in this context.
Question
To determine whether the cash bonus paid by a company is related to annual pay, data were gathered for 10 loan officers at AMC Bank who received cash bonuses in 2012. The data, scatterplot, and summary statistics are shown below. Model a linear relationship with a least squares regression model.
Using the estimated regression equation,
a. Estimate the cash bonus for an executive at Johnson Financial earning $82, 613 a year.
b. What is the residual for this estimate? What does it mean?
Model a linear relationship with a least squares regression model.Using the estimated regression equation,
a. Estimate the cash bonus for an executive at Johnson Financial earning $82, 613 a year.
b. What is the residual for this estimate? What does it mean?
Question
Question
A small independent organic food store offers a variety of specialty coffees. To determine whether price has an impact on sales, the managers kept track of how many pounds of each variety of coffee were sold last month. The data, scatterplot, and summary statistics are shown below.
Estimate the linear regression model that relates the response variable (monthly sales) to the predictor variable (price per pound).
a. Find the slope of the regression line.
b. Find the intercept of the regression line.
c. Write the equation of the linear model.
Estimate the linear regression model that relates the response variable (monthly sales) to the predictor variable (price per pound).
a. Find the slope of the regression line.
b. Find the intercept of the regression line.
c. Write the equation of the linear model.
Question
To determine whether the cash bonus paid by a company is related to annual pay, data were gathered for 10 loan officers at AMC Bank who received cash bonuses in 2012. The data, scatterplot, and summary statistics are shown below. Model a linear relationship with a least squares regression model.
Comment on whether each of the following conditions for correlation / linear
regression is met.
A. Quantitative variable condition.
b. Linearity condition.
c. Outlier condition.
Model a linear relationship with a least squares regression model.Comment on whether each of the following conditions for correlation / linear
regression is met.
A. Quantitative variable condition.
b. Linearity condition.
c. Outlier condition.
Question
Question
Question
Shown below is a correlation table showing correlation coefficients between
population (millions), migration rate of mobile subscriptions to smart phones (in %) and
smart phone penetration per capita (in %) for a sample of 15 countries.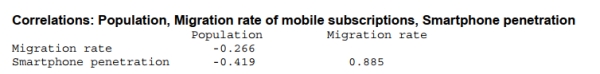
A. What is the correlation between migration rate of mobile subscriptions and population?
Interpret.
b. What is the correlation between smart phone penetration and population? Interpret.
c. What is the correlation between migration rate of mobile subscriptions and smart
phone penetration? Interpret.
Question
Question
The scatterplot shows monthly sales figures (in units) and number of months of experience for a sample of salespeople. 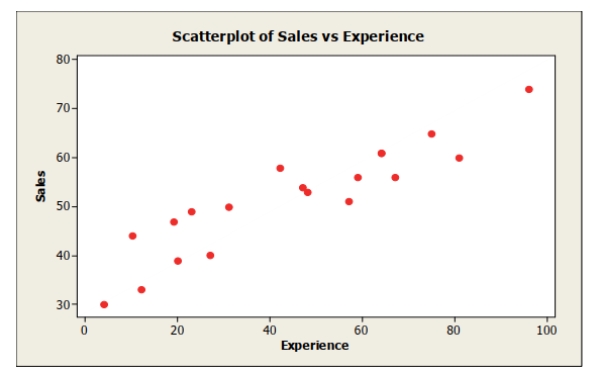 The correlation between monthly sales and level of experience is most likely
A) -.235.
B) 0.
C) .180.
D) -.914.
E) .914.
The correlation between monthly sales and level of experience is most likelyA) -.235.
B) 0.
C) .180.
D) -.914.
E) .914.
Question
Question
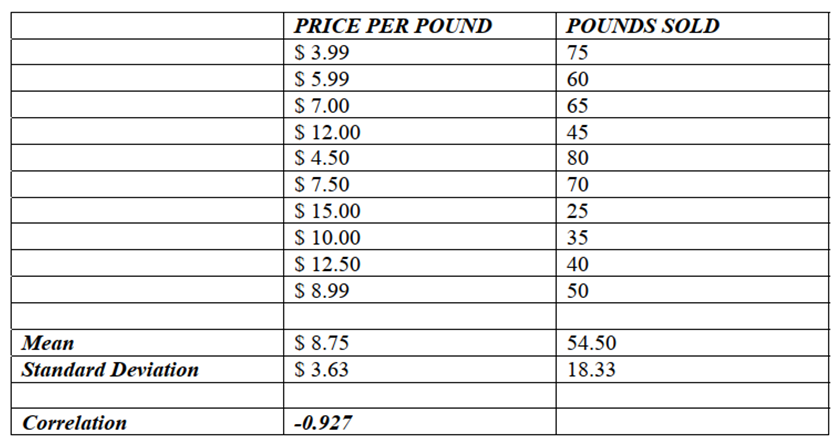
Question
A small independent organic food store offers a variety of specialty coffees. To determine whether price has an impact on sales, the managers kept track of how many
Pounds of each variety of coffee were sold last month.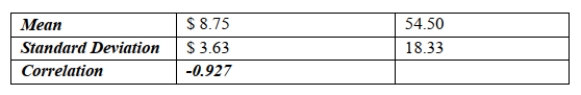 Based on the summary statistics shown below, what percent of the variability in the
Number of pounds of coffee sold per week can be explained by price?
A) 95.47%
B) 100%
C) 85.9%
D) 55.6%
E) 4.68%
Pounds of each variety of coffee were sold last month.
Based on the summary statistics shown below, what percent of the variability in theNumber of pounds of coffee sold per week can be explained by price?
A) 95.47%
B) 100%
C) 85.9%
D) 55.6%
E) 4.68%
Question
Question
Question
A consumer research group examining the relationship between the price of meat (per pound) and fat content (in grams) gathered data that produced the following scatterplot. 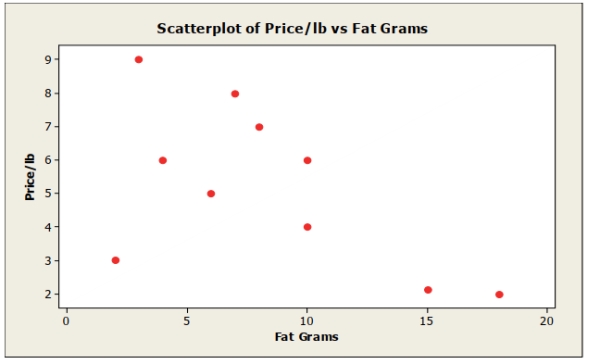 If the point in the lower left hand corner (2 grams of fat; $3.00 per pound) is removed, the
Correlation would most likely
A) remain the same.
B) become positive.
C) become weaker negative.
D) become stronger negative.
E) become zero.
If the point in the lower left hand corner (2 grams of fat; $3.00 per pound) is removed, theCorrelation would most likely
A) remain the same.
B) become positive.
C) become weaker negative.
D) become stronger negative.
E) become zero.
Question
A small independent organic food store offers a variety of specialty coffees. To determine whether price has an impact on sales, the managers kept track of how many
Pounds of each variety of coffee were sold last month.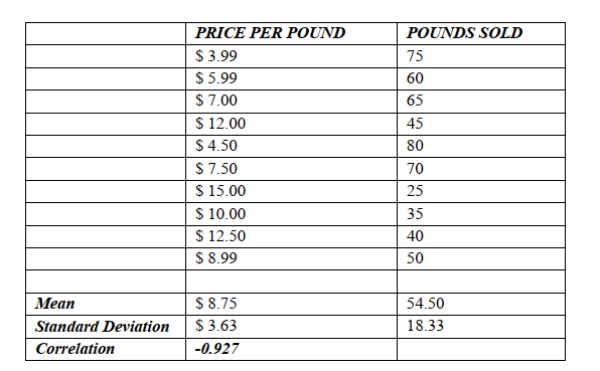 Based on the data and summary statistics, the intercept of the estimated regression line
That relates the response variable (monthly sales) to the predictor variable (price per
Pound) is
A) 95.459.
B) .858.
C) -4.684.
D) -.858.
E) -8.999.
Pounds of each variety of coffee were sold last month.
Based on the data and summary statistics, the intercept of the estimated regression lineThat relates the response variable (monthly sales) to the predictor variable (price per
Pound) is
A) 95.459.
B) .858.
C) -4.684.
D) -.858.
E) -8.999.
Question
Shown below is a correlation table showing correlation coefficients between stock price, earnings per share (EPS) and price/earnings (P/E) ratio for a sample of 19
Publicly traded companies. Which of the following statements is false?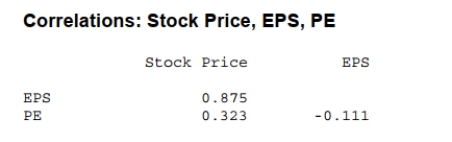
A) EPS is the best predictor of stock price.
B) The strongest correlation is between EPS and stock price.
C) There is a weak negative association between PE and EPS.
D) PE is the best predictor of stock price.
E) The weakest correlation is between PE and EPS.
Question
The scatterplot shows monthly sales figures (in units) and number of months of experience for a sample of salespeople. 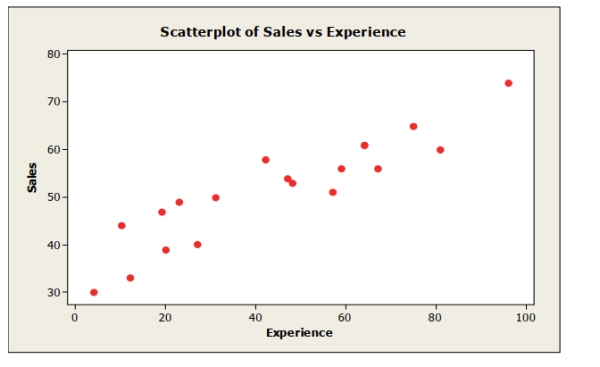
The association between monthly sales and level of experience can be described as
A) positive and weak.
B) negative and weak.
C) negative and strong.
D) positive and strong.
E) nonlinear
The association between monthly sales and level of experience can be described as
A) positive and weak.
B) negative and weak.
C) negative and strong.
D) positive and strong.
E) nonlinear
Question
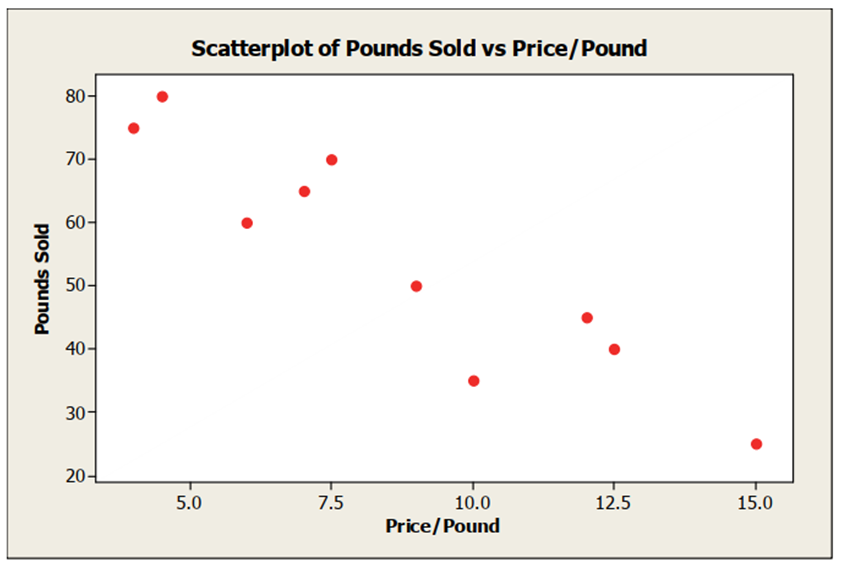
A small independent organic food store offers a variety of specialty coffees. To determine whether price has an impact on sales, the managers kept track of how many
Pounds of each variety of coffee were sold last month. Based on the scatterplot shown
Below, which of the following statements is true?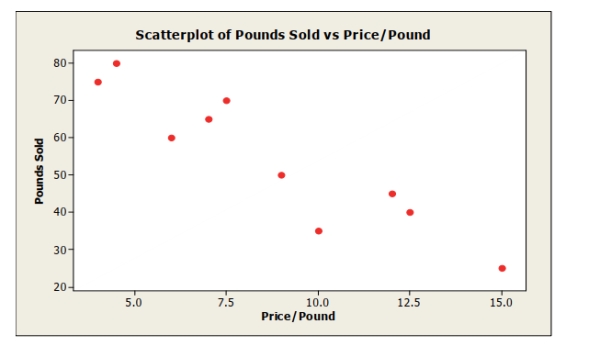 Price/Pound
A) The quantitative variable condition is satisfied.
B) The linearity condition is satisfied.
C) There are no obvious outliers.
D) All of the above.
E) None of the above.
Pounds of each variety of coffee were sold last month. Based on the scatterplot shown
Below, which of the following statements is true?
Price/PoundA) The quantitative variable condition is satisfied.
B) The linearity condition is satisfied.
C) There are no obvious outliers.
D) All of the above.
E) None of the above.
Question
Question
A small independent organic food store offers a variety of specialty coffees. To determine whether price has an impact on sales, the managers kept track of how many
Pounds of each variety of coffee were sold last month.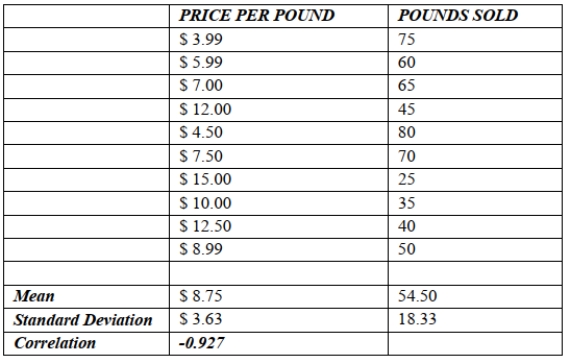 Based on the data and summary statistics shown below, the slope of the estimated
Regression line that relates the response variable (monthly sales) to the predictor variable
(price per pound) is
A) 95. 459.
B) .858.
C) -4.681.
D) -.858.
E) -8.999.
Pounds of each variety of coffee were sold last month.
Based on the data and summary statistics shown below, the slope of the estimatedRegression line that relates the response variable (monthly sales) to the predictor variable
(price per pound) is
A) 95. 459.
B) .858.
C) -4.681.
D) -.858.
E) -8.999.
Question
Question
A company studying the productivity of their employees on a new information system was interested in determining if the age (X) of data entry operators influenced the number
Of completed entries made per hour (Y). The regression equation is yˆ = 14.374 − 0.145x .
A) .779
B) -.236
C) .575
D) -.929
E) -.779
Of completed entries made per hour (Y). The regression equation is yˆ = 14.374 − 0.145x .
A) .779
B) -.236
C) .575
D) -.929
E) -.779
Question
A small independent organic food store offers a variety of specialty coffees. To determine whether price has an impact on sales, the managers kept track of how many pounds of each variety of coffee were sold last month. The data, scatterplot, and summary statistics are shown below.
Using the estimated regression equation,
a. Estimate the monthly sales for a variety of coffee that costs $12 per pound.
b. What is the residual for this estimate? What does it mean?
Using the estimated regression equation,
a. Estimate the monthly sales for a variety of coffee that costs $12 per pound.
b. What is the residual for this estimate? What does it mean?
Question
Question
A small independent organic food store offers a variety of specialty coffees. To determine whether price has an impact on sales, the managers kept track of how many
Pounds of each variety of coffee were sold last month.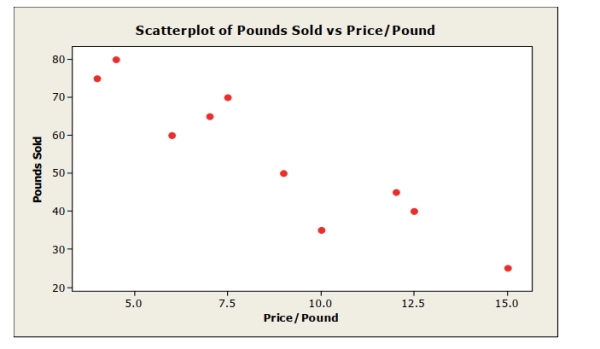 Based on the scatterplot, the linear relationship between number of pounds of coffee sold
Per week and price is
A) strong and positive.
B) strong and negative.
C) weak and negative.
D) weak and positive.
E) nonexistent.
Pounds of each variety of coffee were sold last month.
Based on the scatterplot, the linear relationship between number of pounds of coffee soldPer week and price is
A) strong and positive.
B) strong and negative.
C) weak and negative.
D) weak and positive.
E) nonexistent.
Question

Unlock Deck
Sign up to unlock the cards in this deck!
Unlock Deck
Unlock Deck
1/84
Play
Full screen (f)
Deck 4: Correlation and Linear Regression
1
Suppose a sample of 60 cans of soda has a mean of 12.1 ounces and a standard deviation of 0.05 ounces. If a can of soda has 12 ounces, what is its corresponding z
Score?
A) 2.0
B) -2.0
C) 1.8
D) -3.0
E) -1.8
Score?
A) 2.0
B) -2.0
C) 1.8
D) -3.0
E) -1.8
-2.0
2
A customer service center keeps track of the number of complaints received each day about one of their new products. The numbers of complaints received over the last 11
Day period are 19, 18, 22, 21, 17, 18, 22, 19, 16, 23, and 25. The median for this sample
Of data is
A) 22.
B) 20.
C) 19.
D) 17.
E) 16.
Day period are 19, 18, 22, 21, 17, 18, 22, 19, 16, 23, and 25. The median for this sample
Of data is
A) 22.
B) 20.
C) 19.
D) 17.
E) 16.
19.
3
The U.S. Bureau of Labor Statistics (BLS) compiles data on a number of variables. Which of the following BLS variables is categorical?
A) Consumer expenditures
B) Type of workplace injuries
C) Wages by occupation
D) Employment costs
E) Productivity by industry
A) Consumer expenditures
B) Type of workplace injuries
C) Wages by occupation
D) Employment costs
E) Productivity by industry
Type of workplace injuries
4
A recent report evaluated the price and performance of 25 models of smartphones. Computer output gives the summary statistics for the prices ($) shown in the table.
The IQR for these data is
A) $ 142
B) $ 58
C) $ 323
D) $ 442
E) $ 500
The IQR for these data is
A) $ 142
B) $ 58
C) $ 323
D) $ 442
E) $ 500
Unlock Deck
Unlock for access to all 84 flashcards in this deck.
Unlock Deck
k this deck
5
A recent survey of online shoppers asked them to indicate the primary reason they shop via the Internet. The table summarizes responses by reason and gender. What
Percent of males cite Convenience as the primary reason they shop online?
A) 42%
B) 73%
C) 62%
D) 31%
E) 50%
Percent of males cite Convenience as the primary reason they shop online?
A) 42%
B) 73%
C) 62%
D) 31%
E) 50%
Unlock Deck
Unlock for access to all 84 flashcards in this deck.
Unlock Deck
k this deck
6
A customer service center keeps track of the number of complaints received each day about one of their new products. The numbers of complaints received over the last 11
Day period are 19, 18, 22, 21, 17, 18, 22, 19, 16, 23, and 25. The IQR for this sample of
Data is
A) 25.
B) 22.
C) 18.
D) 9.
E) 4.
Day period are 19, 18, 22, 21, 17, 18, 22, 19, 16, 23, and 25. The IQR for this sample of
Data is
A) 25.
B) 22.
C) 18.
D) 9.
E) 4.
Unlock Deck
Unlock for access to all 84 flashcards in this deck.
Unlock Deck
k this deck
7
Which is true for the data shown in the histogram?
A) I only
B) II only
C) I and II
D) I and III
E) I, II and III
A) I only
B) II only
C) I and II
D) I and III
E) I, II and III
Unlock Deck
Unlock for access to all 84 flashcards in this deck.
Unlock Deck
k this deck
8
Boxplots of earnings per share (EPS) data for a sample of retail company stocks and a sample of energy company stocks are shown below. Which of the following statements
Is correct?
A) The median EPS is higher for energy stocks compared to retail stocks.
B) The median EPS is higher for retail stocks compared to energy stocks.
C) The IQR for the EPS data is larger for retail stocks than for energy stocks.
D) The EPS data are more variable for retail stocks than for energy stocks.
E) The mean is higher for energy stocks compared to retail stocks.
Is correct?
A) The median EPS is higher for energy stocks compared to retail stocks.
B) The median EPS is higher for retail stocks compared to energy stocks.
C) The IQR for the EPS data is larger for retail stocks than for energy stocks.
D) The EPS data are more variable for retail stocks than for energy stocks.
E) The mean is higher for energy stocks compared to retail stocks.
Unlock Deck
Unlock for access to all 84 flashcards in this deck.
Unlock Deck
k this deck
9
A customer service center keeps track of the number of complaints received each day about one of their new products. The numbers of complaints received over the last 11 Day period are 19, 18, 22, 21, 17, 18, 22, 19, 16, 23, and 25. The standard deviation for This sample of data is
A) 0.842.
B) 2.794.
C) 1.845.
D) 0.569.
E) None of the above.
A) 0.842.
B) 2.794.
C) 1.845.
D) 0.569.
E) None of the above.
Unlock Deck
Unlock for access to all 84 flashcards in this deck.
Unlock Deck
k this deck
10
A government agency has 6000 employees. As an alternative to the traditional five day work week, employees were asked whether they preferred a four day work week (10
Hours per day) or flexible hours. The segmented bar chart below is based on the data
Collected. Which of the following statements is true about work week preferences and
Age category?
A) A greater percentage of employees who prefer a 4 day work week are in the over
45 age category compared to those who prefer flex hours.
B) A greater percentage of employees who prefer flex hours are in the over 45 age
Category compared to those who prefer a 4 day work week.
C) Preferences appear to be independent of age.
D) The distribution of preferences are the same across different age groups.
E) The segmented bar chart is not appropriate for these data.
Unlock Deck
Unlock for access to all 84 flashcards in this deck.
Unlock Deck
k this deck
11
Boxplots of earnings per share (EPS) data for a sample of retail company stocks and a sample of energy company stocks are shown below. Which of the following statement
Is true about the distributions of EPS for retail and energy stocks?
A) The distribution of EPS for retail stocks is skewed to the right.
B) The distribution of EPS for energy stocks is symmetric.
C) Both distributions of EPS are symmetric.
D) The distribution of EPS for retail stocks is skewed to the left.
E) The distribution of EPS for energy stocks is skewed to the left.
Is true about the distributions of EPS for retail and energy stocks?
A) The distribution of EPS for retail stocks is skewed to the right.
B) The distribution of EPS for energy stocks is symmetric.
C) Both distributions of EPS are symmetric.
D) The distribution of EPS for retail stocks is skewed to the left.
E) The distribution of EPS for energy stocks is skewed to the left.
Unlock Deck
Unlock for access to all 84 flashcards in this deck.
Unlock Deck
k this deck
12
A government agency has 6000 employees. As an alternative to the traditional five day work week, employees were asked whether they preferred a four day work week (10
Hours per day) or flexible hours. The table below shows the results by age category.
The most appropriate display for these data is a
A) histogram.
B) stem and leaf display.
C) boxplot.
D) segmented bar chart.
E) frequency table.
Hours per day) or flexible hours. The table below shows the results by age category.
The most appropriate display for these data is a
A) histogram.
B) stem and leaf display.
C) boxplot.
D) segmented bar chart.
E) frequency table.
Unlock Deck
Unlock for access to all 84 flashcards in this deck.
Unlock Deck
k this deck
13
The following scatterplot shows output/unit capital and years. The data show
A) There is no consistent increasing or decreasing over time.
B) There is no evidence of a seasonal component.
C) There is some evidence of a cyclical component.
D) There is no linear trend over the time period.
E) All of the above.
A) There is no consistent increasing or decreasing over time.
B) There is no evidence of a seasonal component.
C) There is some evidence of a cyclical component.
D) There is no linear trend over the time period.
E) All of the above.
Unlock Deck
Unlock for access to all 84 flashcards in this deck.
Unlock Deck
k this deck
14
What scale of measurement is type of workplace injuries (slip and fall, stress related, etc.)?
A) Quantitative
B) Interval
C) Nominal
D) Ordinal
E) Numerical
A) Quantitative
B) Interval
C) Nominal
D) Ordinal
E) Numerical
Unlock Deck
Unlock for access to all 84 flashcards in this deck.
Unlock Deck
k this deck
15
A recent survey of online shoppers asked them to indicate the primary reason they shop via the Internet. The table summarizes responses by reason and gender. What
Percent of respondents cite Convenience as the primary reason they shop online?
A) 42%
B) 23%
C) 62%
D) 85%
E) 33%
Percent of respondents cite Convenience as the primary reason they shop online?
A) 42%
B) 23%
C) 62%
D) 85%
E) 33%
Unlock Deck
Unlock for access to all 84 flashcards in this deck.
Unlock Deck
k this deck
16
A recent survey of online shoppers asked them to indicate the primary reason they shop via the Internet. The table summarizes responses by reason and gender. What
Percent of respondents who cited Greater Selection as the primary reason they shop
Online were females?
A) 53%
B) 27%
C) 50%
D) 84%
E) 42%
Percent of respondents who cited Greater Selection as the primary reason they shop
Online were females?
A) 53%
B) 27%
C) 50%
D) 84%
E) 42%
Unlock Deck
Unlock for access to all 84 flashcards in this deck.
Unlock Deck
k this deck
17
The following scatterplot shows output/hour labor and years. The graphical display is an example of what type of data?
A) Cross-sectional
B) Nominal
C) Categorical
D) Time Series
E) Ordinal
A) Cross-sectional
B) Nominal
C) Categorical
D) Time Series
E) Ordinal
Unlock Deck
Unlock for access to all 84 flashcards in this deck.
Unlock Deck
k this deck
18
The U.S. Bureau of Labor Statistics publishes the monthly CPI (consumer price index). This index shows the change in prices paid by urban consumers for a market
Basket of goods and services. These data are
A) Cross-sectional
B) Nominal
C) Categorical
D) Time Series
E) Ordinal
Basket of goods and services. These data are
A) Cross-sectional
B) Nominal
C) Categorical
D) Time Series
E) Ordinal
Unlock Deck
Unlock for access to all 84 flashcards in this deck.
Unlock Deck
k this deck
19
A recent report evaluated the price and performance of 25 models of smartphones. Computer output gives the summary statistics for the prices ($) shown in the table. Based
On these results, which of the following is true?
A) The distribution is symmetric.
B) The distribution is skewed to the right.
C) The distribution is skewed to the left.
D) The mean is a better measure of center for these data than the median.
E) The standard deviation is larger than the range.
On these results, which of the following is true?
A) The distribution is symmetric.
B) The distribution is skewed to the right.
C) The distribution is skewed to the left.
D) The mean is a better measure of center for these data than the median.
E) The standard deviation is larger than the range.
Unlock Deck
Unlock for access to all 84 flashcards in this deck.
Unlock Deck
k this deck
20
A consumer research group investigating the relationship between the price of meat (per pound) and the fat content (grams) gathered data that produced the following
Scatterplot. The residual of the point ($2.00 per pound, 6 grams of fat) is
A) A large positive value
B) A large negative value
C) Affecting the correlation of the variables
D) Both B and C
E) Both A and C
Scatterplot. The residual of the point ($2.00 per pound, 6 grams of fat) is
A) A large positive value
B) A large negative value
C) Affecting the correlation of the variables
D) Both B and C
E) Both A and C
Unlock Deck
Unlock for access to all 84 flashcards in this deck.
Unlock Deck
k this deck
21
Prices per share of the 20 most actively traded stocks on the New York Stock Exchange in October, 2012. A histogram for these data are shown below.
The data can be described as
A) The data are skewed to the left with a large positive outlier.
B) 5.9 %
C) 17.9 %
D) The data are skewed to the right with a large positive outlier.
E) 13.4 %
The data can be described as
A) The data are skewed to the left with a large positive outlier.
B) 5.9 %
C) 17.9 %
D) The data are skewed to the right with a large positive outlier.
E) 13.4 %
Unlock Deck
Unlock for access to all 84 flashcards in this deck.
Unlock Deck
k this deck
22
A manufacturer of cable wire periodically selects samples to monitor the process. A sample of ten wires is selected and the diameters (in cm.) are 0.493, 0.534, 0.527, 0.511,
0)565, 0.559, 0.519, 0.562, 0.551, and 0.530. The mean diameter is
A) 0.455 cm.
B) 0.535 cm.
C) 0.511 cm.
D) 0.565 cm.
E) 0.499 cm.
0)565, 0.559, 0.519, 0.562, 0.551, and 0.530. The mean diameter is
A) 0.455 cm.
B) 0.535 cm.
C) 0.511 cm.
D) 0.565 cm.
E) 0.499 cm.
Unlock Deck
Unlock for access to all 84 flashcards in this deck.
Unlock Deck
k this deck
23
Prices per share of the 20 most actively traded stocks on the New York Stock Exchange in October, 2012. Summary statistics for these data are shown below. The
IQR for this set of dataset is
A) 83
B) 27
C) 13.5
D) 69.5
E) None of the above
IQR for this set of dataset is
A) 83
B) 27
C) 13.5
D) 69.5
E) None of the above
Unlock Deck
Unlock for access to all 84 flashcards in this deck.
Unlock Deck
k this deck
24
A magazine that publishes product reviews conducted a survey of teenagers' preferences for cell phones. Three brands of cell phone designed specifically with teens
In mind were the focus of the study. The table summarizes responses by brand and
Gender. What percent of teenagers who preferred the BlackJack II were males?
A) 63%
B) 32%
C) 16%
D) 50%
E) 41%
In mind were the focus of the study. The table summarizes responses by brand and
Gender. What percent of teenagers who preferred the BlackJack II were males?
A) 63%
B) 32%
C) 16%
D) 50%
E) 41%
Unlock Deck
Unlock for access to all 84 flashcards in this deck.
Unlock Deck
k this deck
25
US public debt per capita historical data for the years 2009-2013 yields the following scatterplot:
A) About 99.5% of the variability in debt per capita is explained by the model.
B) On average, debt per capita increases $3.49K per year.
C) The response variable is "year."
D) Both A and B.
E) All of the above.
A) About 99.5% of the variability in debt per capita is explained by the model.
B) On average, debt per capita increases $3.49K per year.
C) The response variable is "year."
D) Both A and B.
E) All of the above.
Unlock Deck
Unlock for access to all 84 flashcards in this deck.
Unlock Deck
k this deck
26
Real estate agencies keep track of housing prices in a given area. Suppose they also provide their clients with quarterly median selling prices for homes in a given area for the
Past three year period. These data are
A) Cross-sectional
B) Time Series
C) Categorical
D) Nominal
E) Ordinal
IA-1
Past three year period. These data are
A) Cross-sectional
B) Time Series
C) Categorical
D) Nominal
E) Ordinal
IA-1
Unlock Deck
Unlock for access to all 84 flashcards in this deck.
Unlock Deck
k this deck
27
An advocacy group is investigating whether gender has an effect on job category in large investment firms. She surveyed a sample of firms with the results shown below.
Which of the following statements is true about gender and job category?
A) A greater percentage of males are executives compared to females.
B) A greater percentage of females are executives compared to males.
C) Job category appears to be independent of gender.
D) A smaller percentage of females are clerical compared to males.
E) The segmented bar chart is not appropriate for these data.
Unlock Deck
Unlock for access to all 84 flashcards in this deck.
Unlock Deck
k this deck
28
A manufacturer of cable wire periodically selects samples to monitor the process. A sample of ten wires is selected and the diameters (in cm.) are 0.493, 0.534, 0.527, 0.511,
0)565, 0.559, 0.519, 0.562, 0.551, and 0.530. The standard deviation is
A) 0.455 cm.
B) 0.005 cm.
C) 0.045 cm.
D) 0.024 cm.
E) 0.099 cm.
0)565, 0.559, 0.519, 0.562, 0.551, and 0.530. The standard deviation is
A) 0.455 cm.
B) 0.005 cm.
C) 0.045 cm.
D) 0.024 cm.
E) 0.099 cm.
Unlock Deck
Unlock for access to all 84 flashcards in this deck.
Unlock Deck
k this deck
29
A magazine that publishes product reviews conducted a survey of teenagers' preferences for cell phones. Three brands of cell phone designed specifically with teens
In mind were the focus of the study. The table summarizes responses by brand and
Gender. What percent of teenagers preferred LG Rumor?
A) 50%
B) 41%
C) 25%
D) 16%
E) 20%
In mind were the focus of the study. The table summarizes responses by brand and
Gender. What percent of teenagers preferred LG Rumor?
A) 50%
B) 41%
C) 25%
D) 16%
E) 20%
Unlock Deck
Unlock for access to all 84 flashcards in this deck.
Unlock Deck
k this deck
30
The following scatterplot shows monthly sales figures (in units) and number of months of experience on the job for a sample of 19 salespeople. Estimate the correlation.
A) -0.3
B) +0.7
C) -0.7
D) +0.3
E) 0.0
A) -0.3
B) +0.7
C) -0.7
D) +0.3
E) 0.0
Unlock Deck
Unlock for access to all 84 flashcards in this deck.
Unlock Deck
k this deck
31
In listing a property, real estate agencies provides information on a number of variables. Which of the following variables related to property listings is categorical?
A) Real Estate Tax
B) Number of Bedrooms
C) Style of Home
D) Asking Price
E) Number of Bathrooms
A) Real Estate Tax
B) Number of Bedrooms
C) Style of Home
D) Asking Price
E) Number of Bathrooms
Unlock Deck
Unlock for access to all 84 flashcards in this deck.
Unlock Deck
k this deck
32
What scale of measurement is the type of a car (sedan, SUV, convertible, etc)?
A) Nominal
B) Interval
C) Quantitative
D) Ordinal
E) Numerical
A) Nominal
B) Interval
C) Quantitative
D) Ordinal
E) Numerical
Unlock Deck
Unlock for access to all 84 flashcards in this deck.
Unlock Deck
k this deck
33
An advocacy group is investigating whether gender has an effect on job category in large investment firms. She surveyed a sample of firms with the results shown below.
The most appropriate display for these data is a
A) histogram.
B) stem and leaf display.
C) boxplot.
D) segmented bar chart.
E) frequency table.
The most appropriate display for these data is a
A) histogram.
B) stem and leaf display.
C) boxplot.
D) segmented bar chart.
E) frequency table.
Unlock Deck
Unlock for access to all 84 flashcards in this deck.
Unlock Deck
k this deck
34
An office supply chain has stores in two locations, Dayton and Scranton. One of these stores is to be closed within the coming year, and to help make the decision,
Management reviews sales data. Below are boxplots for monthly unit sales for both
Locations. Which of the following statement is not correct?
A) Monthly sales are higher in Dayton compared to Scranton.
B) The IQR for sales in Dayton is larger than that for Scranton.
C) Monthly sales are less variable in Scranton compared to Dayton.
D) Both distributions are fairly symmetric.
E) Monthly sales are more variable in Scranton compared to Dayton.
Management reviews sales data. Below are boxplots for monthly unit sales for both
Locations.
Which of the following statement is not correct?A) Monthly sales are higher in Dayton compared to Scranton.
B) The IQR for sales in Dayton is larger than that for Scranton.
C) Monthly sales are less variable in Scranton compared to Dayton.
D) Both distributions are fairly symmetric.
E) Monthly sales are more variable in Scranton compared to Dayton.
Unlock Deck
Unlock for access to all 84 flashcards in this deck.
Unlock Deck
k this deck
35
For families who live in apartments the correlation between the family's income and the amount of rent they pay is r = 0.60. Which is true?
I. In general, families with higher incomes pay more in rent.
II. On average, families spend 60% of their income on rent.
III. The regression line passes through 60% of the (income$, rent$) data
Points.
A) I only
B) II only
C) I and II
D) I and III
E) I, II and III
I. In general, families with higher incomes pay more in rent.
II. On average, families spend 60% of their income on rent.
III. The regression line passes through 60% of the (income$, rent$) data
Points.
A) I only
B) II only
C) I and II
D) I and III
E) I, II and III
Unlock Deck
Unlock for access to all 84 flashcards in this deck.
Unlock Deck
k this deck
36
A consumer research group investigating the relationship between the price of meat (per pound) and the fat content (grams) gathered data that produced the following
Scatterplot. Which description of the association between fat content and price is more
Accurate?
A) If the point ($2.00 per pound, 6 grams of fat) is removed, the correlation will be
Higher.
B) If the point ($2.00 per pound, 6 grams of fat) is removed, the correlation will be
Lower.
C) Increased fat content generally results in decreased price/lb.
D) Both B and C
E) Both A and C
Unlock Deck
Unlock for access to all 84 flashcards in this deck.
Unlock Deck
k this deck
37
A magazine that publishes product reviews conducted a survey of teenagers' preferences for cell phones. Three brands of cell phone designed specifically with teens
In mind were the focus of the study. The table summarizes responses by brand and
Gender. What percent of female teenagers preferred the Sidekick LX?
A) 43%
B) 60%
C) 21%
D) 50%
E) 16%
In mind were the focus of the study. The table summarizes responses by brand and
Gender. What percent of female teenagers preferred the Sidekick LX?
A) 43%
B) 60%
C) 21%
D) 50%
E) 16%
Unlock Deck
Unlock for access to all 84 flashcards in this deck.
Unlock Deck
k this deck
38
A business researcher conducted a survey of 500 women to determine preferences for types of automobiles. The types are shown below along with the number of women who
Prefer that type. Which of the following charts would be appropriate for displaying these
Data?
A) Histogram
B) Boxplot
C) Pie Chart
D) Line Graph
E) Stem and Leaf Display
Prefer that type. Which of the following charts would be appropriate for displaying these
Data?
A) Histogram
B) Boxplot
C) Pie Chart
D) Line Graph
E) Stem and Leaf Display
Unlock Deck
Unlock for access to all 84 flashcards in this deck.
Unlock Deck
k this deck
39
Which is true of the data shown in the histogram?
A) I only
B) III only
C) I and II
D) I and III
E) I, II and III
A) I only
B) III only
C) I and II
D) I and III
E) I, II and III
Unlock Deck
Unlock for access to all 84 flashcards in this deck.
Unlock Deck
k this deck
40
The following scatterplot shows monthly sales figures (in units) and number of months of experience on the job for a sample of 19 salespeople. Describe the association
Between monthly sales and level of experience.
A) Wear negative linear association
B) Moderate positive linear association
C) Moderate negative linear association
D) Weak positive linear association
E) Non-linear
Between monthly sales and level of experience.
A) Wear negative linear association
B) Moderate positive linear association
C) Moderate negative linear association
D) Weak positive linear association
E) Non-linear
Unlock Deck
Unlock for access to all 84 flashcards in this deck.
Unlock Deck
k this deck
41
Suppose a sample of 60 business majors revealed that the average time spent studying per week is 22 hours with a standard deviation of 4 hours. For one student
Reporting that he studies 16 hours per week, the corresponding z score is
A) -1.5
B) 1.5
C) 2.2
D) -2.2
E) -3.0
Reporting that he studies 16 hours per week, the corresponding z score is
A) -1.5
B) 1.5
C) 2.2
D) -2.2
E) -3.0
Unlock Deck
Unlock for access to all 84 flashcards in this deck.
Unlock Deck
k this deck
42
Below is a stem and leaf display of prices for a sample homes recently sold in a metropolitan area in the southeastern region of the U.S. Which of the following statements is true?
A) The mean would be more appropriate than the median to describe the center of
This distribution.
B) This distribution is fairly symmetric.
C) This distribution is right skewed.
D) This distribution is left skewed.
E) Both A and C
Which of the following statements is true?A) The mean would be more appropriate than the median to describe the center of
This distribution.
B) This distribution is fairly symmetric.
C) This distribution is right skewed.
D) This distribution is left skewed.
E) Both A and C
Unlock Deck
Unlock for access to all 84 flashcards in this deck.
Unlock Deck
k this deck
43
A regression analysis of company profits and the amount of money the company spent on advertising produced a R2 = 0.72. Which of these is true?
I. This model can correctly predict the profit for 72% of companies.
II. 72% of the variance in company profit can be accounted for by the model.
III. On average, companies spend about 72% of their profits on advertising.
A) None
B) I only
C) II only
D) III only
E) I and III
I. This model can correctly predict the profit for 72% of companies.
II. 72% of the variance in company profit can be accounted for by the model.
III. On average, companies spend about 72% of their profits on advertising.
A) None
B) I only
C) II only
D) III only
E) I and III
Unlock Deck
Unlock for access to all 84 flashcards in this deck.
Unlock Deck
k this deck
44
A consumer research group investigating the relationship between the price of meat
(per pound) and the fat content (grams) gathered data that produced the following
scatterplot.
A. Describe the association between the price of meat and fat content.
b. Estimate the correlation.
c. If the point in the lower left hand corner ($2.00 per pound, 6 grams of fat) is removed,
would the correlation become stronger or weaker or remain the same? Explain.
(per pound) and the fat content (grams) gathered data that produced the following
scatterplot.
A. Describe the association between the price of meat and fat content.
b. Estimate the correlation.
c. If the point in the lower left hand corner ($2.00 per pound, 6 grams of fat) is removed,
would the correlation become stronger or weaker or remain the same? Explain.
Unlock Deck
Unlock for access to all 84 flashcards in this deck.
Unlock Deck
k this deck
45
To determine whether the cash bonus paid by a company is related to annual pay, data were gathered for 10 loan officers at AMC Bank who received cash bonuses in 2012. The data, scatterplot, and summary statistics are shown below. Model a linear relationship with a least squares regression model.
Find the value of R2. Interpret its meaning in this context.
Model a linear relationship with a least squares regression model.Find the value of R2. Interpret its meaning in this context.
Unlock Deck
Unlock for access to all 84 flashcards in this deck.
Unlock Deck
k this deck
46
To determine whether the cash bonus paid by a company is related to annual pay, data were gathered for 10 loan officers at AMC Bank who received cash bonuses in 2012. The data, scatterplot, and summary statistics are shown below. Model a linear relationship with a least squares regression model.
Estimate the linear regression model that relates the response variable (cash bonus) to the predictor variable (annual pay).
A. Find the slope of the regression line.
b. Find the intercept of the regression line.
c. Write the equation of the linear model.
Model a linear relationship with a least squares regression model.Estimate the linear regression model that relates the response variable (cash bonus) to the predictor variable (annual pay).
A. Find the slope of the regression line.
b. Find the intercept of the regression line.
c. Write the equation of the linear model.
Unlock Deck
Unlock for access to all 84 flashcards in this deck.
Unlock Deck
k this deck
47
A small independent organic food store offers a variety of specialty coffees. To determine whether price has an impact on sales, the managers kept track of how many pounds of each variety of coffee were sold last month. The data, scatterplot, and summary statistics are shown below.
Comment on whether each of the following conditions for correlation / linear
regression is met.
A. Quantitative variable condition.
b. Linearity condition.
c. Outlier condition.
Unlock Deck
Unlock for access to all 84 flashcards in this deck.
Unlock Deck
k this deck
48
The following scatterplot shows monthly sales figures (in units) and number of
months of experience on the job for a sample of 19 salespeople.
A. Describe the association between monthly sales and level of experience.
b. Do these data satisfy the conditions for computing a correlation coefficient? Explain.
c. Estimate the correlation.
months of experience on the job for a sample of 19 salespeople.
A. Describe the association between monthly sales and level of experience.
b. Do these data satisfy the conditions for computing a correlation coefficient? Explain.
c. Estimate the correlation.
Unlock Deck
Unlock for access to all 84 flashcards in this deck.
Unlock Deck
k this deck
49
In commenting on the increase in home foreclosures, a news reporter stated "there
appears to be a strong correlation between home foreclosures and job loss of the head of
household." Comment on this statement.
appears to be a strong correlation between home foreclosures and job loss of the head of
household." Comment on this statement.
Unlock Deck
Unlock for access to all 84 flashcards in this deck.
Unlock Deck
k this deck
50
Shown below is a correlation table showing correlation coefficients between stock
price, earnings per share (EPS), and price/earnings (P/E) ratio for a sample of 19 publicly
traded companies.
A. What is the correlation between stock price and EPS? Interpret.
b. What is the correlation between stock price and PE? Interpret.
c. What is the correlation between EPS and PE? Interpret.
price, earnings per share (EPS), and price/earnings (P/E) ratio for a sample of 19 publicly
traded companies.
A. What is the correlation between stock price and EPS? Interpret.
b. What is the correlation between stock price and PE? Interpret.
c. What is the correlation between EPS and PE? Interpret.
Unlock Deck
Unlock for access to all 84 flashcards in this deck.
Unlock Deck
k this deck
51
For each of the following scenarios indicate which is the predictor variable and which
is the response variable.
A. A study examined consumption levels of oil and carbon dioxide emissions for a sample
of counties.
b. Data were collected on job performance rating and hours of training for a sample of
employees at a telecommunications repair facility.
c. Salary data as well as years of managerial experience were collected for a sample of
executives in the high tech industry.
Unlock Deck
Unlock for access to all 84 flashcards in this deck.
Unlock Deck
k this deck
52
In discussing how its customers use online services, a bank manager noted "there
seems to be a strong correlation between the use of the online bill paying feature and
gender." Comment on this statement.
seems to be a strong correlation between the use of the online bill paying feature and
gender." Comment on this statement.
Unlock Deck
Unlock for access to all 84 flashcards in this deck.
Unlock Deck
k this deck
53
A small independent organic food store offers a variety of specialty coffees. To determine whether price has an impact on sales, the managers kept track of how many pounds of each variety of coffee were sold last month. The data, scatterplot, and summary statistics are shown below.
Find the value of R2. Interpret its meaning in this context.
Find the value of R2. Interpret its meaning in this context.
Unlock Deck
Unlock for access to all 84 flashcards in this deck.
Unlock Deck
k this deck
54
To determine whether the cash bonus paid by a company is related to annual pay, data were gathered for 10 loan officers at AMC Bank who received cash bonuses in 2012. The data, scatterplot, and summary statistics are shown below. Model a linear relationship with a least squares regression model.
Using the estimated regression equation,
a. Estimate the cash bonus for an executive at Johnson Financial earning $82, 613 a year.
b. What is the residual for this estimate? What does it mean?
Model a linear relationship with a least squares regression model.Using the estimated regression equation,
a. Estimate the cash bonus for an executive at Johnson Financial earning $82, 613 a year.
b. What is the residual for this estimate? What does it mean?
Unlock Deck
Unlock for access to all 84 flashcards in this deck.
Unlock Deck
k this deck
55
A correlation of zero between two quantitative variables means that
A) We have done something wrong in our calculation of r.
B) There is no association between the two variables.
C) There is no linear association between the two variables.
D) Re-expressing the data will guarantee a linear association between the two
Variables.
E) None of the above
A) We have done something wrong in our calculation of r.
B) There is no association between the two variables.
C) There is no linear association between the two variables.
D) Re-expressing the data will guarantee a linear association between the two
Variables.
E) None of the above
Unlock Deck
Unlock for access to all 84 flashcards in this deck.
Unlock Deck
k this deck
56
A small independent organic food store offers a variety of specialty coffees. To determine whether price has an impact on sales, the managers kept track of how many pounds of each variety of coffee were sold last month. The data, scatterplot, and summary statistics are shown below.
Estimate the linear regression model that relates the response variable (monthly sales) to the predictor variable (price per pound).
a. Find the slope of the regression line.
b. Find the intercept of the regression line.
c. Write the equation of the linear model.
Estimate the linear regression model that relates the response variable (monthly sales) to the predictor variable (price per pound).
a. Find the slope of the regression line.
b. Find the intercept of the regression line.
c. Write the equation of the linear model.
Unlock Deck
Unlock for access to all 84 flashcards in this deck.
Unlock Deck
k this deck
57
To determine whether the cash bonus paid by a company is related to annual pay, data were gathered for 10 loan officers at AMC Bank who received cash bonuses in 2012. The data, scatterplot, and summary statistics are shown below. Model a linear relationship with a least squares regression model.
Comment on whether each of the following conditions for correlation / linear
regression is met.
A. Quantitative variable condition.
b. Linearity condition.
c. Outlier condition.
Model a linear relationship with a least squares regression model.Comment on whether each of the following conditions for correlation / linear
regression is met.
A. Quantitative variable condition.
b. Linearity condition.
c. Outlier condition.
Unlock Deck
Unlock for access to all 84 flashcards in this deck.
Unlock Deck
k this deck
58
A business executive taught his managers that praise is more effective than
punishment. He was challenged by one of the managers who said that in his experience
praising an employee for executing a task is typically followed by a lesser performance,
whereas yelling at an employee for bad execution is typically followed by improved
performance.
A. Explain this case in terms of a failure to appreciate regression toward the mean.
b. How might luck factor into the improvement or deterioration of performance?
Unlock Deck
Unlock for access to all 84 flashcards in this deck.
Unlock Deck
k this deck
59
For each of the following scenarios indicate which is the predictor variable and which
is the response variable.
A. A supermarket chain gathers data on the amount they spend on promotional material
(specials, coupons, etc.) and sales revenue generated each quarter.
b. Government-sponsored research investigated the relationship between number of hours
individuals spend on the Internet and age.
c. A real estate association conducted a study on home prices and economic strength for
different regions of the United States.
Unlock Deck
Unlock for access to all 84 flashcards in this deck.
Unlock Deck
k this deck
60
Shown below is a correlation table showing correlation coefficients between
population (millions), migration rate of mobile subscriptions to smart phones (in %) and
smart phone penetration per capita (in %) for a sample of 15 countries.
A. What is the correlation between migration rate of mobile subscriptions and population?
Interpret.
b. What is the correlation between smart phone penetration and population? Interpret.
c. What is the correlation between migration rate of mobile subscriptions and smart
phone penetration? Interpret.
population (millions), migration rate of mobile subscriptions to smart phones (in %) and
smart phone penetration per capita (in %) for a sample of 15 countries.
A. What is the correlation between migration rate of mobile subscriptions and population?
Interpret.
b. What is the correlation between smart phone penetration and population? Interpret.
c. What is the correlation between migration rate of mobile subscriptions and smart
phone penetration? Interpret.
Unlock Deck
Unlock for access to all 84 flashcards in this deck.
Unlock Deck
k this deck
61
Data were collected on monthly sales revenues (in $1,000s) and monthly advertising expenditures ($100s) for a sample of drug stores. The regression line relating revenues
(Y) to advertising expenditure (X) is estimated to be yˆ = −48.3 + 9.00x . The correct
Interpretation of the slope is that for each additional
A) $1 spent on advertising, predicted sales revenue increases by $9,000.
B) $100 spent on advertising, predicted sales revenue increases by $9,000.
C) $100 spent on advertising, predicted sales revenue decreases by $9,000.
D) $1,000 in sales revenue, advertising expenditures decrease by $48.30.
E) $100 in sales revenue, advertising expenditures decrease by $48.30.
Unlock Deck
Unlock for access to all 84 flashcards in this deck.
Unlock Deck
k this deck
62
The scatterplot shows monthly sales figures (in units) and number of months of experience for a sample of salespeople. The correlation between monthly sales and level of experience is most likely
A) -.235.
B) 0.
C) .180.
D) -.914.
E) .914.
The correlation between monthly sales and level of experience is most likelyA) -.235.
B) 0.
C) .180.
D) -.914.
E) .914.
Unlock Deck
Unlock for access to all 84 flashcards in this deck.
Unlock Deck
k this deck
63
Suppose the correlation, r, between two variables x and y is -0.44. What percentage of the variability in y cannot be explained by x?
A) 19%
B) 44%
C) 81%
D) 88%
E) 12%
A) 19%
B) 44%
C) 81%
D) 88%
E) 12%
Unlock Deck
Unlock for access to all 84 flashcards in this deck.
Unlock Deck
k this deck
64
A scatterplot shows a curved relationship between 2 variables. What methods can be used to analyze the relationship between these variables?
A) Fit an exponential or quadratic function
B) Summarize the strength of the association by using correlation and R2.
C) Transform one or both of the variables by using square root, logarithm, or reciprocal
Functions
D) A and C
E) All of the above
A) Fit an exponential or quadratic function
B) Summarize the strength of the association by using correlation and R2.
C) Transform one or both of the variables by using square root, logarithm, or reciprocal
Functions
D) A and C
E) All of the above
Unlock Deck
Unlock for access to all 84 flashcards in this deck.
Unlock Deck
k this deck
65
A small independent organic food store offers a variety of specialty coffees. To determine whether price has an impact on sales, the managers kept track of how many
Pounds of each variety of coffee were sold last month. Based on the summary statistics shown below, what percent of the variability in the
Number of pounds of coffee sold per week can be explained by price?
A) 95.47%
B) 100%
C) 85.9%
D) 55.6%
E) 4.68%
Pounds of each variety of coffee were sold last month.
Based on the summary statistics shown below, what percent of the variability in theNumber of pounds of coffee sold per week can be explained by price?
A) 95.47%
B) 100%
C) 85.9%
D) 55.6%
E) 4.68%
Unlock Deck
Unlock for access to all 84 flashcards in this deck.
Unlock Deck
k this deck
66
A study examined consumption levels of oil and carbon dioxide emissions for sample of counties. The response variable in this study is
A) oil.
B) oil consumption.
C) carbon dioxide emissions.
D) countries.
E) none of the above.
A) oil.
B) oil consumption.
C) carbon dioxide emissions.
D) countries.
E) none of the above.
Unlock Deck
Unlock for access to all 84 flashcards in this deck.
Unlock Deck
k this deck
67
Some people believe that there is a Sports Illustrated cover jinx; that is, individuals or
teams who appear on the cover of Sports Illustrated will subsequently experience bad
luck.
A. Explain this case in terms of a failure to appreciate regression toward the mean.
b. Give an explanation for the deterioration in performance after the featured cover?
teams who appear on the cover of Sports Illustrated will subsequently experience bad
luck.
A. Explain this case in terms of a failure to appreciate regression toward the mean.
b. Give an explanation for the deterioration in performance after the featured cover?
Unlock Deck
Unlock for access to all 84 flashcards in this deck.
Unlock Deck
k this deck
68
A consumer research group examining the relationship between the price of meat (per pound) and fat content (in grams) gathered data that produced the following scatterplot. If the point in the lower left hand corner (2 grams of fat; $3.00 per pound) is removed, the
Correlation would most likely
A) remain the same.
B) become positive.
C) become weaker negative.
D) become stronger negative.
E) become zero.
If the point in the lower left hand corner (2 grams of fat; $3.00 per pound) is removed, theCorrelation would most likely
A) remain the same.
B) become positive.
C) become weaker negative.
D) become stronger negative.
E) become zero.
Unlock Deck
Unlock for access to all 84 flashcards in this deck.
Unlock Deck
k this deck
69
A small independent organic food store offers a variety of specialty coffees. To determine whether price has an impact on sales, the managers kept track of how many
Pounds of each variety of coffee were sold last month. Based on the data and summary statistics, the intercept of the estimated regression line
That relates the response variable (monthly sales) to the predictor variable (price per
Pound) is
A) 95.459.
B) .858.
C) -4.684.
D) -.858.
E) -8.999.
Pounds of each variety of coffee were sold last month.
Based on the data and summary statistics, the intercept of the estimated regression lineThat relates the response variable (monthly sales) to the predictor variable (price per
Pound) is
A) 95.459.
B) .858.
C) -4.684.
D) -.858.
E) -8.999.
Unlock Deck
Unlock for access to all 84 flashcards in this deck.
Unlock Deck
k this deck
70
Shown below is a correlation table showing correlation coefficients between stock price, earnings per share (EPS) and price/earnings (P/E) ratio for a sample of 19
Publicly traded companies. Which of the following statements is false?
A) EPS is the best predictor of stock price.
B) The strongest correlation is between EPS and stock price.
C) There is a weak negative association between PE and EPS.
D) PE is the best predictor of stock price.
E) The weakest correlation is between PE and EPS.
Publicly traded companies. Which of the following statements is false?
A) EPS is the best predictor of stock price.
B) The strongest correlation is between EPS and stock price.
C) There is a weak negative association between PE and EPS.
D) PE is the best predictor of stock price.
E) The weakest correlation is between PE and EPS.
Unlock Deck
Unlock for access to all 84 flashcards in this deck.
Unlock Deck
k this deck
71
The scatterplot shows monthly sales figures (in units) and number of months of experience for a sample of salespeople.
The association between monthly sales and level of experience can be described as
A) positive and weak.
B) negative and weak.
C) negative and strong.
D) positive and strong.
E) nonlinear
The association between monthly sales and level of experience can be described as
A) positive and weak.
B) negative and weak.
C) negative and strong.
D) positive and strong.
E) nonlinear
Unlock Deck
Unlock for access to all 84 flashcards in this deck.
Unlock Deck
k this deck
72
A small independent organic food store offers a variety of specialty coffees. To determine whether price has an impact on sales, the managers kept track of how many
Pounds of each variety of coffee were sold last month. Based on the scatterplot shown
Below, which of the following statements is true? Price/Pound
A) The quantitative variable condition is satisfied.
B) The linearity condition is satisfied.
C) There are no obvious outliers.
D) All of the above.
E) None of the above.
Pounds of each variety of coffee were sold last month. Based on the scatterplot shown
Below, which of the following statements is true?
Price/PoundA) The quantitative variable condition is satisfied.
B) The linearity condition is satisfied.
C) There are no obvious outliers.
D) All of the above.
E) None of the above.
Unlock Deck
Unlock for access to all 84 flashcards in this deck.
Unlock Deck
k this deck
73
A company studying the productivity of its employees on a new information system was interested in determining if the age (X) of data entry operators influenced the number
Of completed entries made per hour (Y). The regression equation is yˆ = 14.374 − 0.145x .
Suppose the actual completed entries per hour for an operator who is 35 years old was 8.
The residual is
A) -1.3
B) 2.6
C) -3.5
D) 1.3
E) -2.2
Of completed entries made per hour (Y). The regression equation is yˆ = 14.374 − 0.145x .
Suppose the actual completed entries per hour for an operator who is 35 years old was 8.
The residual is
A) -1.3
B) 2.6
C) -3.5
D) 1.3
E) -2.2
Unlock Deck
Unlock for access to all 84 flashcards in this deck.
Unlock Deck
k this deck
74
A small independent organic food store offers a variety of specialty coffees. To determine whether price has an impact on sales, the managers kept track of how many
Pounds of each variety of coffee were sold last month. Based on the data and summary statistics shown below, the slope of the estimated
Regression line that relates the response variable (monthly sales) to the predictor variable
(price per pound) is
A) 95. 459.
B) .858.
C) -4.681.
D) -.858.
E) -8.999.
Pounds of each variety of coffee were sold last month.
Based on the data and summary statistics shown below, the slope of the estimatedRegression line that relates the response variable (monthly sales) to the predictor variable
(price per pound) is
A) 95. 459.
B) .858.
C) -4.681.
D) -.858.
E) -8.999.
Unlock Deck
Unlock for access to all 84 flashcards in this deck.
Unlock Deck
k this deck
75
Suppose the correlation, r, between two variables x and y is -0.44. What would you predict about a y value if the x value is 2 standard deviations above its mean?
A) It will be .88 standard deviations below its mean.
B) It will be .88 standard deviations above its mean.
C) It will be 2 standard deviations below its mean.
D) It will be .44 standard deviations below its mean.
E) It will be .44 standard deviations above its mean.
A) It will be .88 standard deviations below its mean.
B) It will be .88 standard deviations above its mean.
C) It will be 2 standard deviations below its mean.
D) It will be .44 standard deviations below its mean.
E) It will be .44 standard deviations above its mean.
Unlock Deck
Unlock for access to all 84 flashcards in this deck.
Unlock Deck
k this deck
76
A company studying the productivity of their employees on a new information system was interested in determining if the age (X) of data entry operators influenced the number
Of completed entries made per hour (Y). The regression equation is yˆ = 14.374 − 0.145x .
A) .779
B) -.236
C) .575
D) -.929
E) -.779
Of completed entries made per hour (Y). The regression equation is yˆ = 14.374 − 0.145x .
A) .779
B) -.236
C) .575
D) -.929
E) -.779
Unlock Deck
Unlock for access to all 84 flashcards in this deck.
Unlock Deck
k this deck
77
A small independent organic food store offers a variety of specialty coffees. To determine whether price has an impact on sales, the managers kept track of how many pounds of each variety of coffee were sold last month. The data, scatterplot, and summary statistics are shown below.
Using the estimated regression equation,
a. Estimate the monthly sales for a variety of coffee that costs $12 per pound.
b. What is the residual for this estimate? What does it mean?
Using the estimated regression equation,
a. Estimate the monthly sales for a variety of coffee that costs $12 per pound.
b. What is the residual for this estimate? What does it mean?
Unlock Deck
Unlock for access to all 84 flashcards in this deck.
Unlock Deck
k this deck
78
A supermarket chain gathers data on the amount they spend on promotional material (e.g., coupons, etc.) and sales revenue generated each quarter. The predictor variable is
A) sales revenue.
B) amount spent on promotional material.
C) number of coupons offered.
D) supermarket chains.
E) none of the above.
A) sales revenue.
B) amount spent on promotional material.
C) number of coupons offered.
D) supermarket chains.
E) none of the above.
Unlock Deck
Unlock for access to all 84 flashcards in this deck.
Unlock Deck
k this deck
79
A small independent organic food store offers a variety of specialty coffees. To determine whether price has an impact on sales, the managers kept track of how many
Pounds of each variety of coffee were sold last month. Based on the scatterplot, the linear relationship between number of pounds of coffee sold
Per week and price is
A) strong and positive.
B) strong and negative.
C) weak and negative.
D) weak and positive.
E) nonexistent.
Pounds of each variety of coffee were sold last month.
Based on the scatterplot, the linear relationship between number of pounds of coffee soldPer week and price is
A) strong and positive.
B) strong and negative.
C) weak and negative.
D) weak and positive.
E) nonexistent.
Unlock Deck
Unlock for access to all 84 flashcards in this deck.
Unlock Deck
k this deck
80
Data were collected on monthly sales revenues (in $1,000s) and monthly advertising expenditures ($100s) for a sample of drug stores. The regression line relating revenues
(Y) to advertising expenditure (X) is estimated to be yˆ = −48.3 + 9.00x . The predicted
Sales revenue for a month in which $1,000 was spent on advertising is
A) $50,000.
B) $851.70.
C) $8,951.70.
D) $41,700.
E) $90,000.
(Y) to advertising expenditure (X) is estimated to be yˆ = −48.3 + 9.00x . The predicted
Sales revenue for a month in which $1,000 was spent on advertising is
A) $50,000.
B) $851.70.
C) $8,951.70.
D) $41,700.
E) $90,000.
Unlock Deck
Unlock for access to all 84 flashcards in this deck.
Unlock Deck
k this deck
Unlock Deck
Unlock for access to all 84 flashcards in this deck.


