Deck 8: Sampling Methods and the Central Umit Theorem
Full screen (f)
Question
Question
Question
Question
Question
Question
Question
Question
Dottie Kleman is the "Cookie Lady." She bakes and sells cookies at 50 different locations. Ms.
Kleman is concerned about absenteeism among her workers. The information below reports the
Number of days absent for a sample of 10 workers during the last two-week pay period.![<strong>Dottie Kleman is the Cookie Lady. She bakes and sells cookies at 50 different locations. Ms. Kleman is concerned about absenteeism among her workers. The information below reports the Number of days absent for a sample of 10 workers during the last two-week pay period. The sample mean is calculated to be 1.8 and sample standard deviation is 1.1353. Develop a 95% Confidence interval for the population mean. Assume that the population distribution is normal. Is it Reasonable to conclude that the typical worker misses 1 day during a pay period?</strong> A) [0.99, 2.61] It is unreasonable to conclude that the mean number of days of work missed is 1 per employee. B) [0.99, 2.61] It is reasonable to conclude that the mean number of days of work missed is 1 per employee. C) [-0.99, -2.61] It is unreasonable to conclude that the mean number of days of work missed is 1 per employee. D) [-0.99, -2.61] It is reasonable to conclude that the mean number of days of work missed is 1 per employee. <div style=padding-top: 35px>](https://storage.examlex.com/TB1024/11eb5577_424c_f166_a086_e19ac65c3ee3_TB1024_00.jpg)
The sample mean is calculated to be 1.8 and sample standard deviation is 1.1353. Develop a 95%
Confidence interval for the population mean. Assume that the population distribution is normal. Is it
Reasonable to conclude that the typical worker misses 1 day during a pay period?
A) [0.99, 2.61] It is unreasonable to conclude that the mean number of days of work missed is 1 per employee.
B) [0.99, 2.61] It is reasonable to conclude that the mean number of days of work missed is 1 per employee.
C) [-0.99, -2.61] It is unreasonable to conclude that the mean number of days of work missed is 1 per employee.
D) [-0.99, -2.61] It is reasonable to conclude that the mean number of days of work missed is 1 per employee.
Kleman is concerned about absenteeism among her workers. The information below reports the
Number of days absent for a sample of 10 workers during the last two-week pay period.
The sample mean is calculated to be 1.8 and sample standard deviation is 1.1353. Develop a 95%
Confidence interval for the population mean. Assume that the population distribution is normal. Is it
Reasonable to conclude that the typical worker misses 1 day during a pay period?
A) [0.99, 2.61] It is unreasonable to conclude that the mean number of days of work missed is 1 per employee.
B) [0.99, 2.61] It is reasonable to conclude that the mean number of days of work missed is 1 per employee.
C) [-0.99, -2.61] It is unreasonable to conclude that the mean number of days of work missed is 1 per employee.
D) [-0.99, -2.61] It is reasonable to conclude that the mean number of days of work missed is 1 per employee.
Question
Question
Question
Question
Question
Question
Question
Dottie Kleman is the "Cookie Lady." She bakes and sells cookies at 50 different locations. Ms.
Kleman is concerned about absenteeism among her workers. The information below reports the
Number of days absent for a sample of 10 workers during the last two-week pay period.![<strong>Dottie Kleman is the Cookie Lady. She bakes and sells cookies at 50 different locations. Ms. Kleman is concerned about absenteeism among her workers. The information below reports the Number of days absent for a sample of 10 workers during the last two-week pay period. The sample mean is calculated to be 1.8 and sample standard deviation is 1.1353. Develop a 95% Confidence interval for the population mean. Assume that the population distribution is normal. Is it Reasonable to conclude that the typical worker does not miss any days during a pay period?</strong> A) [0.99, 2.61] It is unreasonable to conclude that the mean number of days of work missed is 0 per employee. B) [0.99, 2.61] It is reasonable to conclude that the mean number of days of work missed is 0 per employee. C) [-0.99, -2.61] It is unreasonable to conclude that the mean number of days of work missed is 0 per employee. D) [-0.99, -2.61] It is reasonable to conclude that the mean number of days of work missed is 0 per employee. <div style=padding-top: 35px>](https://storage.examlex.com/TB1024/11eb5577_424c_a345_a086_a540db774935_TB1024_00.jpg)
The sample mean is calculated to be 1.8 and sample standard deviation is 1.1353. Develop a 95%
Confidence interval for the population mean. Assume that the population distribution is normal. Is it
Reasonable to conclude that the typical worker does not miss any days during a pay period?
A) [0.99, 2.61] It is unreasonable to conclude that the mean number of days of work missed is 0 per employee.
B) [0.99, 2.61] It is reasonable to conclude that the mean number of days of work missed is 0 per employee.
C) [-0.99, -2.61] It is unreasonable to conclude that the mean number of days of work missed is 0 per employee.
D) [-0.99, -2.61] It is reasonable to conclude that the mean number of days of work missed is 0 per employee.
Kleman is concerned about absenteeism among her workers. The information below reports the
Number of days absent for a sample of 10 workers during the last two-week pay period.
The sample mean is calculated to be 1.8 and sample standard deviation is 1.1353. Develop a 95%
Confidence interval for the population mean. Assume that the population distribution is normal. Is it
Reasonable to conclude that the typical worker does not miss any days during a pay period?
A) [0.99, 2.61] It is unreasonable to conclude that the mean number of days of work missed is 0 per employee.
B) [0.99, 2.61] It is reasonable to conclude that the mean number of days of work missed is 0 per employee.
C) [-0.99, -2.61] It is unreasonable to conclude that the mean number of days of work missed is 0 per employee.
D) [-0.99, -2.61] It is reasonable to conclude that the mean number of days of work missed is 0 per employee.
Question
Which of the following would be used as a point estimate for the population mean (µ)?
A) σ
B) x/n
C)
D) s
E) p
A) σ
B) x/n
C)
D) s
E) p
Question
Question
Question
Question
Question
Question
Question
Question
Question
Question
Question
Question
Question
Question
Question
Question
Question
Question
Question
Question
Question
Question
Question
Question
Question
A manager of a local store wants to estimate the mean amount spent per shopping visit by
Customers. Summary statistics from a sample taken reveal the following:![<strong>A manager of a local store wants to estimate the mean amount spent per shopping visit by Customers. Summary statistics from a sample taken reveal the following: Determine a 95% confidence interval for the mean amount spent.</strong> A) [45.21, 53.56] B) [40.36, 58.35] C) [30.54, 68.14] D) [45.13, 53.56] E) [29.34, 69.34] <div style=padding-top: 35px>](https://storage.examlex.com/TB1024/11eb5577_4252_e4d7_a086_81958753d3f1_TB1024_00.jpg)
Determine a 95% confidence interval for the mean amount spent.
A) [45.21, 53.56]
B) [40.36, 58.35]
C) [30.54, 68.14]
D) [45.13, 53.56]
E) [29.34, 69.34]
Customers. Summary statistics from a sample taken reveal the following:
Determine a 95% confidence interval for the mean amount spent.
A) [45.21, 53.56]
B) [40.36, 58.35]
C) [30.54, 68.14]
D) [45.13, 53.56]
E) [29.34, 69.34]
Question
Question
A manager of a local store wants to estimate the mean amount spent per shopping visit by
Customers. Summary statistics from a sample taken reveal the following:
The store manager wonders whether the population mean could have been $50 or $60.
A) Since $60 is within the 95% confidence interval, the population mean is likely to be $60.
B) Since $60 is not within the 95% confidence interval, the population mean is not likely to be $60.
C) Since $50 is within the 95% confidence interval, the population mean is likely to be $50.
D) Since $50 is not within the 95% confidence interval, the population mean is not likely to be $50.
E) Since $60 is not within the 95% confidence interval, the population mean is not likely to be $60; however, it is likely to be $50.
Question
Question
Question
Question
Question
Question
Question
A manager of a local store wants to estimate the mean amount spent per shopping visit by
Customers. Summary statistics from a sample taken reveal the following: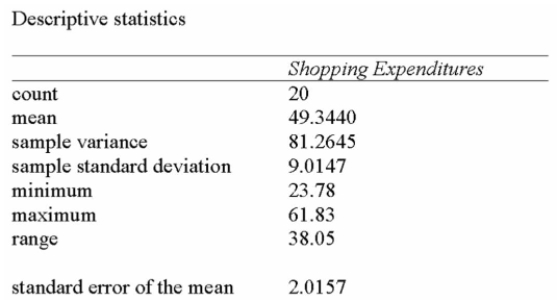
If 90% and 95% confidence intervals were developed to estimate the true shopping expenditure,
What similarities would exist?
A) Point estimates
B) t-values would be the same
C) Standard errors
D) Both point estimates and standard errors
E) Both point estimates and t-values
Question
Question
Question
A manager of a local store wants to estimate the mean amount spent per shopping visit by
Customers. Summary statistics from a sample taken reveal the following:
If 95% and 98% confidence intervals were developed to estimate the true shopping expenditure,
What differences would exist?
A) Standard errors
B) Interval widths
C) t-values
D) Both interval widths and t-values
E) Both standard errors and interval widths
Question
Question
Question
A statistics professor wishes to estimate the average mark on a term test for a course that has
Multiple sections and many students. A survey of some of the students registered for the course
Reveals the following results:![<strong>A statistics professor wishes to estimate the average mark on a term test for a course that has Multiple sections and many students. A survey of some of the students registered for the course Reveals the following results: Determine a 95% confidence interval for the term test results.</strong> A) [48.0, 93.6] B) [66.8, 74.8] C) [62.9, 78.71] D) [64.2, 77.3] E) [62.6, 79.0] <div style=padding-top: 35px>](https://storage.examlex.com/TB1024/11eb5577_4253_cf3b_a086_97b60b1b5353_TB1024_00.jpg)
Determine a 95% confidence interval for the term test results.
A) [48.0, 93.6]
B) [66.8, 74.8]
C) [62.9, 78.71]
D) [64.2, 77.3]
E) [62.6, 79.0]
Multiple sections and many students. A survey of some of the students registered for the course
Reveals the following results:
Determine a 95% confidence interval for the term test results.
A) [48.0, 93.6]
B) [66.8, 74.8]
C) [62.9, 78.71]
D) [64.2, 77.3]
E) [62.6, 79.0]
Question
Question
Question
Question
Question
The following summarizes the amount of snowfall in Ontario over the past number of years. 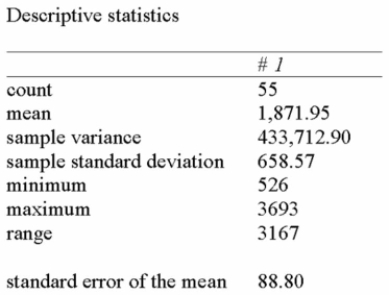 If 90% and 95% confidence intervals were developed to estimate the true average annual snowfall,
What similarities would they have?
A) Point estimates
B) Z-values
C) Standard errors
D) Both point estimates and standard errors
E) Both point estimates and Z-Values
If 90% and 95% confidence intervals were developed to estimate the true average annual snowfall,What similarities would they have?
A) Point estimates
B) Z-values
C) Standard errors
D) Both point estimates and standard errors
E) Both point estimates and Z-Values
Question
The following summarizes the amount of snowfall in Ontario over the past number of years.  If 95% and 98% confidence intervals were developed to estimate the true average annual snowfall,
What differences would exist?
A) Standard errors
B) Interval widths
C) Z-values
D) Both interval widths and Z-values
If 95% and 98% confidence intervals were developed to estimate the true average annual snowfall,What differences would exist?
A) Standard errors
B) Interval widths
C) Z-values
D) Both interval widths and Z-values
Question
Question
A statistics professor wishes to estimate the average mark on a term test for a course that has
Multiple sections and many students. A survey of some of the students registered for the course
Reveals the following results:
The student from the course wonders whether the population mean could have been 60 or 80.
A) Since 80 is within the 95% confidence interval, the population mean is likely to be 80.
B) Since 80 is not within the 95% confidence interval, the population mean is not likely to be 80.
C) Since 60 is within the 95% confidence interval, the population mean is likely to be 60.
D) Since neither 60 nor 80 is within the 95% confidence interval, the population mean is not likely to be 60 or 80.
Question
The following summarizes the amount of snowfall in Ontario over the past number of years.  You wonder whether the population mean could have been 1,600 or 2,100.
A) Since 1600 is within the 95% confidence interval, the population mean is likely to be 1,600.
B) Since 1600 is not within the 95% confidence interval, the population mean is not likely to be 1,600.
C) Since 2100 is within the 95% confidence interval, the population mean is likely to be 2,100.
D) Since neither 1,600 nor 2,100 is within the 95% confidence interval, the population mean is not likely to be 1,600 or 2000.
E) Since 1900 and 2000 are both within the 95% confidence interval, the population mean is likely to be either value.
You wonder whether the population mean could have been 1,600 or 2,100.A) Since 1600 is within the 95% confidence interval, the population mean is likely to be 1,600.
B) Since 1600 is not within the 95% confidence interval, the population mean is not likely to be 1,600.
C) Since 2100 is within the 95% confidence interval, the population mean is likely to be 2,100.
D) Since neither 1,600 nor 2,100 is within the 95% confidence interval, the population mean is not likely to be 1,600 or 2000.
E) Since 1900 and 2000 are both within the 95% confidence interval, the population mean is likely to be either value.
Question
Dottie Kleman is the "Cookie Lady." She bakes and sells cookies at 50 different locations. Ms.
Kleman is concerned about absenteeism among her workers. The information below reports the
Number of days absent for a sample of 10 workers during the last two-week pay period.![<strong>Dottie Kleman is the Cookie Lady. She bakes and sells cookies at 50 different locations. Ms. Kleman is concerned about absenteeism among her workers. The information below reports the Number of days absent for a sample of 10 workers during the last two-week pay period. The sample mean is calculated to be 1.8 and sample standard deviation is 1.1353. Develop a 95% Confidence interval for the population mean. Assume that the population distribution is normal. Is it Reasonable to conclude that the typical worker misses 2 days during a pay period?</strong> A) [0.99, 2.61] It is unreasonable to conclude that the mean number of days of work missed is 2 per employee. B) [0.99, 2.61] It is reasonable to conclude that the mean number of days of work missed is 2 per employee. C) [1.99, 2.61] It is unreasonable to conclude that the mean number of days of work missed is 2 per employee. D) [0.99, 1.61] It is reasonable to conclude that the mean number of days of work missed is 2 per employee. <div style=padding-top: 35px>](https://storage.examlex.com/TB1024/11eb5577_4256_6759_a086_514a0d1dba80_TB1024_00.jpg)
The sample mean is calculated to be 1.8 and sample standard deviation is 1.1353. Develop a 95%
Confidence interval for the population mean. Assume that the population distribution is normal. Is it
Reasonable to conclude that the typical worker misses 2 days during a pay period?
A) [0.99, 2.61] It is unreasonable to conclude that the mean number of days of work missed is 2 per employee.
B) [0.99, 2.61] It is reasonable to conclude that the mean number of days of work missed is 2 per employee.
C) [1.99, 2.61] It is unreasonable to conclude that the mean number of days of work missed is 2 per employee.
D) [0.99, 1.61] It is reasonable to conclude that the mean number of days of work missed is 2 per employee.
Kleman is concerned about absenteeism among her workers. The information below reports the
Number of days absent for a sample of 10 workers during the last two-week pay period.
The sample mean is calculated to be 1.8 and sample standard deviation is 1.1353. Develop a 95%
Confidence interval for the population mean. Assume that the population distribution is normal. Is it
Reasonable to conclude that the typical worker misses 2 days during a pay period?
A) [0.99, 2.61] It is unreasonable to conclude that the mean number of days of work missed is 2 per employee.
B) [0.99, 2.61] It is reasonable to conclude that the mean number of days of work missed is 2 per employee.
C) [1.99, 2.61] It is unreasonable to conclude that the mean number of days of work missed is 2 per employee.
D) [0.99, 1.61] It is reasonable to conclude that the mean number of days of work missed is 2 per employee.
Question
A statistics professor wishes to estimate the average mark on a term test for a course that has
Multiple sections and many students. A survey of some of the students registered for the course
Reveals the following results:![<strong>A statistics professor wishes to estimate the average mark on a term test for a course that has Multiple sections and many students. A survey of some of the students registered for the course Reveals the following results: Determine a 98% confidence interval for the term test results.</strong> A) [48.0, 93.6] B) [66.8, 74.8] C) [62.9, 78.71] D) [64.2, 77.3] E) [60.9, 80.7] <div style=padding-top: 35px>](https://storage.examlex.com/TB1024/11eb5577_4253_f64c_a086_211f04935b8c_TB1024_00.jpg)
Determine a 98% confidence interval for the term test results.
A) [48.0, 93.6]
B) [66.8, 74.8]
C) [62.9, 78.71]
D) [64.2, 77.3]
E) [60.9, 80.7]
Multiple sections and many students. A survey of some of the students registered for the course
Reveals the following results:
Determine a 98% confidence interval for the term test results.
A) [48.0, 93.6]
B) [66.8, 74.8]
C) [62.9, 78.71]
D) [64.2, 77.3]
E) [60.9, 80.7]
Question
Question
A statistics professor wishes to estimate the average mark on a term test for a course that has
Multiple sections and many students. A survey of some of the students registered for the course
Reveals the following results: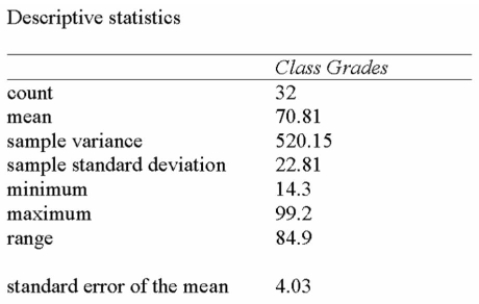
The student from the course wonders whether the population mean could have been 75 or 80.
A) Since 80 is within the 95% confidence interval, the population mean is likely to be 80.
B) Since 80 is not within the 95% confidence interval, the population mean is not likely to be 80.
C) Since 75 is within the 95% confidence interval, the population mean is likely to be 75.
D) Since neither 75 nor 80 is within the 95% confidence interval, the population mean is not likely to be 75 or 80.
E) Since 80 is not within the 95% confidence interval, the population mean is not likely to be 80, but it is likely to be 75.
Question
The following summarizes the amount of snowfall in Ontario over the past number of years. ![<strong>The following summarizes the amount of snowfall in Ontario over the past number of years. Determine a 98% confidence interval for the average annual snowfall.</strong> A) [1698, 2046] B) [1665, 2079] C) [1213, 2531] D) [1783, 1961] E) [1659, 2085] <div style=padding-top: 35px>](https://storage.examlex.com/TB1024/11eb5577_4255_2ed2_a086_0b23838f973e_TB1024_00.jpg) Determine a 98% confidence interval for the average annual snowfall.
Determine a 98% confidence interval for the average annual snowfall.
A) [1698, 2046]
B) [1665, 2079]
C) [1213, 2531]
D) [1783, 1961]
E) [1659, 2085]
Determine a 98% confidence interval for the average annual snowfall.A) [1698, 2046]
B) [1665, 2079]
C) [1213, 2531]
D) [1783, 1961]
E) [1659, 2085]
Question
The following summarizes the average price of Air Canada stock at the end of 20 randomly
Selected weeks in 2000.![<strong>The following summarizes the average price of Air Canada stock at the end of 20 randomly Selected weeks in 2000. Determine a 95% confidence interval for the average Air Canada stock price in 2000.</strong> A) [16.83, 17.42] B) [14.90, 19.87] C) [17.48, 19.40] D) [16.24, 18.56] E) [16.23, 18.55] <div style=padding-top: 35px>](https://storage.examlex.com/TB1024/11eb5577_4256_4048_a086_13b2a295c8b5_TB1024_00.jpg)
Determine a 95% confidence interval for the average Air Canada stock price in 2000.
A) [16.83, 17.42]
B) [14.90, 19.87]
C) [17.48, 19.40]
D) [16.24, 18.56]
E) [16.23, 18.55]
Selected weeks in 2000.
Determine a 95% confidence interval for the average Air Canada stock price in 2000.
A) [16.83, 17.42]
B) [14.90, 19.87]
C) [17.48, 19.40]
D) [16.24, 18.56]
E) [16.23, 18.55]
Question
The following summarizes the amount of snowfall in Ontario over the past number of years. ![<strong>The following summarizes the amount of snowfall in Ontario over the past number of years. Determine a 95% confidence interval for the average annual snowfall.</strong> A) [1,698, 2,046] B) [1,665, 2,079] C) [1,213, 2,531] D) [1,783, 1,961] E) [1694, 2050] <div style=padding-top: 35px>](https://storage.examlex.com/TB1024/11eb5577_4255_07c1_a086_7bc785f17e3e_TB1024_00.jpg) Determine a 95% confidence interval for the average annual snowfall.
Determine a 95% confidence interval for the average annual snowfall.
A) [1,698, 2,046]
B) [1,665, 2,079]
C) [1,213, 2,531]
D) [1,783, 1,961]
E) [1694, 2050]
Determine a 95% confidence interval for the average annual snowfall.A) [1,698, 2,046]
B) [1,665, 2,079]
C) [1,213, 2,531]
D) [1,783, 1,961]
E) [1694, 2050]
Question
Question
Question
Question
The following summarizes the average price of Air Canada stock at the end of 20 randomly
Selected weeks in 2000.![<strong>The following summarizes the average price of Air Canada stock at the end of 20 randomly Selected weeks in 2000. Determine a 90% confidence interval for the average Air Canada stock price in 2000.</strong> A) [16.44, 18.36] B) [14.90, 19.87] C) [17.48, 19.40] D) [16.43, 18.35] E) Unable to determine from the information given <div style=padding-top: 35px>](https://storage.examlex.com/TB1024/11eb5577_4256_1937_a086_83ece835f0b1_TB1024_00.jpg)
Determine a 90% confidence interval for the average Air Canada stock price in 2000.
A) [16.44, 18.36]
B) [14.90, 19.87]
C) [17.48, 19.40]
D) [16.43, 18.35]
E) Unable to determine from the information given
Selected weeks in 2000.
Determine a 90% confidence interval for the average Air Canada stock price in 2000.
A) [16.44, 18.36]
B) [14.90, 19.87]
C) [17.48, 19.40]
D) [16.43, 18.35]
E) Unable to determine from the information given
Question
A statistics professor wishes to estimate the average mark on a term test for a course that has
Multiple sections and many students. A survey of some of the students registered for the course
Reveals the following results: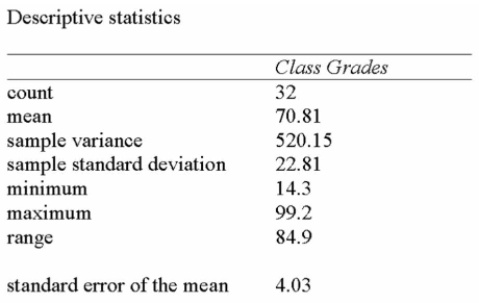
If 95% and 98% confidence intervals were developed to estimate the true term test mean, what
Differences would exist?
A) Standard errors
B) Interval widths
C) t-values
D) Both interval widths and t-values
Question
A statistics professor wishes to estimate the average mark on a term test for a course that has
Multiple sections and many students. A survey of some of the students registered for the course
Reveals the following results:
If 90% and 95% confidence intervals were developed to estimate the true term test mean, what
Similarities would exist?
A) Point estimates
B) t-values
C) Standard errors
D) Both point estimates and standard errors
E) No similarities with point estimates, t-values or standard errors
Question
The following summarizes the average price of Air Canada stock at the end of 20 randomly
Selected weeks in 2000.![<strong>The following summarizes the average price of Air Canada stock at the end of 20 randomly Selected weeks in 2000. Determine a 98% confidence interval for the average TSE 300 stock index in 2000.</strong> A) [9467.57, 10 084.68] B) [9401.80, 10 150.40] C) [9628.70, 9923.55] D) [9468.61, 10 083.65] <div style=padding-top: 35px>](https://storage.examlex.com/TB1024/11eb5577_4256_b57a_a086_178bbb296357_TB1024_00.jpg)
Determine a 98% confidence interval for the average TSE 300 stock index in 2000.
A) [9467.57, 10 084.68]
B) [9401.80, 10 150.40]
C) [9628.70, 9923.55]
D) [9468.61, 10 083.65]
Selected weeks in 2000.
Determine a 98% confidence interval for the average TSE 300 stock index in 2000.
A) [9467.57, 10 084.68]
B) [9401.80, 10 150.40]
C) [9628.70, 9923.55]
D) [9468.61, 10 083.65]
Question
The following summarizes the amount of snowfall in Ontario over the past number of years. 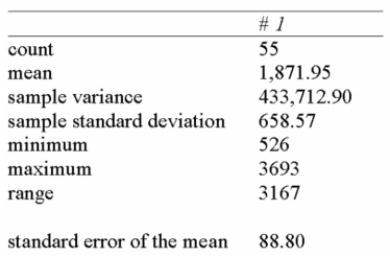 You wonder whether the population mean could have been 2000 or 1900.
A) Since 1900 is within the 95% confidence interval, the population mean is likely to be 1900.
B) Since 1900 is within the 95% confidence interval, the population mean is not likely to be 1900.
C) Since 2000 is within the 95% confidence interval, the population mean is likely to be 2000.
D) Since neither 1900 nor 200 is within the 95% confidence interval, the population mean is not likely to be 1900 or 2000.
E) Since 1900 and 2000 are both within the 95% confidence interval, the population mean is likely to be either value.
You wonder whether the population mean could have been 2000 or 1900.A) Since 1900 is within the 95% confidence interval, the population mean is likely to be 1900.
B) Since 1900 is within the 95% confidence interval, the population mean is not likely to be 1900.
C) Since 2000 is within the 95% confidence interval, the population mean is likely to be 2000.
D) Since neither 1900 nor 200 is within the 95% confidence interval, the population mean is not likely to be 1900 or 2000.
E) Since 1900 and 2000 are both within the 95% confidence interval, the population mean is likely to be either value.

Unlock Deck
Sign up to unlock the cards in this deck!
Unlock Deck
Unlock Deck
1/134
Play
Full screen (f)
Deck 8: Sampling Methods and the Central Umit Theorem
1
i. The 95 percent confidence interval states that 95 percent of the sample means of a specified
Sample size selected from a population will lie within plus and minus 1.96 standard deviations of the
Hypothesized population mean.
ii. A distribution of sample means is normally distributed with a mean equal to the population mean
And a standard deviation equal to the standard error of the mean.
iii. A sample mean is the best point estimate of a population mean.
A) (i), (ii), and (iii) are all correct statements.
B) (i) and (ii) are correct statements but not (iii).
C) (i) and (iii) are correct statements but not (ii).
D) (ii) and (iii) are correct statements but not (i).
E) (i), (ii), and (iii) are all false statements.
(i), (ii), and (iii) are all correct statements.
2
The z-value associated with a 90% level of confidence is:
A) 1.96
B) 1.645
C) 2.33
D) 2.575
E) 1.28
A) 1.96
B) 1.645
C) 2.33
D) 2.575
E) 1.28
1.645
3
The z-value associated with an 80% level of confidence is:
A) 1.96
B) 1.645
C) 2.33
D) 2.575
E) 1.28
A) 1.96
B) 1.645
C) 2.33
D) 2.575
E) 1.28
1.28
4
A random sample of 85 group leaders, supervisors, and similar personnel revealed that on the
Average a person spent 6.5 years on the job before being promoted. The standard deviation of the
Population was 1.7 years. Find the 95% confidence interval for the population mean.
A) 6.99 and 7.99
B) 4.15 and 7.15
C) 6.14 and 6.86
D) 6.49 and 7.49
Average a person spent 6.5 years on the job before being promoted. The standard deviation of the
Population was 1.7 years. Find the 95% confidence interval for the population mean.
A) 6.99 and 7.99
B) 4.15 and 7.15
C) 6.14 and 6.86
D) 6.49 and 7.49
Unlock Deck
Unlock for access to all 134 flashcards in this deck.
Unlock Deck
k this deck
5
Recently, a university surveyed recent graduates of the English Department for their starting
Salaries. Four hundred graduates returned the survey. The average salary was $25,000. The
Population standard deviation is known to be $2,500.
Interpret the results of the 95% confidence interval.
A) The population mean is in the interval.
B) The population mean is not in the interval.
C) The likelihood that any confidence interval based on a sample of 400 graduates will contain the population mean is 0.95.
D) There is a 95% chance that the computed interval does not contain the population mean.
Unlock Deck
Unlock for access to all 134 flashcards in this deck.
Unlock Deck
k this deck
6
Recently, a university surveyed recent graduates of the English Department for their starting
Salaries. Four hundred graduates returned the survey. The average salary was $55,000 with a
Standard deviation of $2,500.
What is the best point estimate of the population mean?
A) $55,000
B) $52,500
C) 400
D) $62.5
Salaries. Four hundred graduates returned the survey. The average salary was $55,000 with a
Standard deviation of $2,500.
What is the best point estimate of the population mean?
A) $55,000
B) $52,500
C) 400
D) $62.5
Unlock Deck
Unlock for access to all 134 flashcards in this deck.
Unlock Deck
k this deck
7
A sample mean is the best point estimate of the
A) population standard deviation.
B) population median.
C) population mean.
D) the sample standard deviation.
E) the population variance.
A) population standard deviation.
B) population median.
C) population mean.
D) the sample standard deviation.
E) the population variance.
Unlock Deck
Unlock for access to all 134 flashcards in this deck.
Unlock Deck
k this deck
8
Dottie Kleman is the "Cookie Lady." She bakes and sells cookies at 50 different locations. Ms.
Kleman is concerned about absenteeism among her workers. The information below reports the
Number of days absent for a sample of 10 workers during the last two-week pay period.
The sample mean is calculated to be 1.8 and sample standard deviation is 1.1353. Develop a 95%
Confidence interval for the population mean. Assume that the population distribution is normal. Is it
Reasonable to conclude that the typical worker misses 1 day during a pay period?
A) [0.99, 2.61] It is unreasonable to conclude that the mean number of days of work missed is 1 per employee.
B) [0.99, 2.61] It is reasonable to conclude that the mean number of days of work missed is 1 per employee.
C) [-0.99, -2.61] It is unreasonable to conclude that the mean number of days of work missed is 1 per employee.
D) [-0.99, -2.61] It is reasonable to conclude that the mean number of days of work missed is 1 per employee.
Unlock Deck
Unlock for access to all 134 flashcards in this deck.
Unlock Deck
k this deck
9
Mileage tests were conducted on a randomly selected sample of 100 newly developed automobile
Tires. The average tread life was found to be 80,000 kilometres with a standard deviation of 5,600
Kilometres. What is the best estimate of the average tread life in miles for the entire population of
These tires?
A) 80,000
B) 5,600
C) (80,000/100)
D) (5,600/100)
Tires. The average tread life was found to be 80,000 kilometres with a standard deviation of 5,600
Kilometres. What is the best estimate of the average tread life in miles for the entire population of
These tires?
A) 80,000
B) 5,600
C) (80,000/100)
D) (5,600/100)
Unlock Deck
Unlock for access to all 134 flashcards in this deck.
Unlock Deck
k this deck
10
A 95% confidence interval infers that the population mean is
A) between 0 and 100%.
B) within ± 1.96 standard deviations of the sample mean.
C) within ± 1.96 standard errors of the sample mean.
D) within ± 1.645 standard deviations of the sample mean.
E) too large.
A) between 0 and 100%.
B) within ± 1.96 standard deviations of the sample mean.
C) within ± 1.96 standard errors of the sample mean.
D) within ± 1.645 standard deviations of the sample mean.
E) too large.
Unlock Deck
Unlock for access to all 134 flashcards in this deck.
Unlock Deck
k this deck
11
A sample of 25 is selected from a known population of 100 elements. What is the finite population
Correction factor?
A) 8.66
B) 75
C) 0.87
D) Cannot be determined from the information given.
Correction factor?
A) 8.66
B) 75
C) 0.87
D) Cannot be determined from the information given.
Unlock Deck
Unlock for access to all 134 flashcards in this deck.
Unlock Deck
k this deck
12
The z-value associated with a 96% level of confidence is:
A) 1.96
B) 1.645
C) 2.33
D) 2.05
E) 1.28
A) 1.96
B) 1.645
C) 2.33
D) 2.05
E) 1.28
Unlock Deck
Unlock for access to all 134 flashcards in this deck.
Unlock Deck
k this deck
13
Recently, a university surveyed recent graduates of the English Department for their starting
Salaries. One hundred graduates returned the survey. The average salary was $35,000 with a
Standard deviation of $2,000.
What is the best point estimate of the population mean?
A) $25,000
B) $2,000
C) $500
D) $400
E) $35,000
Salaries. One hundred graduates returned the survey. The average salary was $35,000 with a
Standard deviation of $2,000.
What is the best point estimate of the population mean?
A) $25,000
B) $2,000
C) $500
D) $400
E) $35,000
Unlock Deck
Unlock for access to all 134 flashcards in this deck.
Unlock Deck
k this deck
14
A sample of 50 is selected from a known population of 250 elements. The population standard
Deviation is 15. What is the standard error of the sample means using the finite population
Correction factor?
A) 2.89
B) 1.90
C) 2.12
D) 13.44
E) Cannot be determined from information given.
Deviation is 15. What is the standard error of the sample means using the finite population
Correction factor?
A) 2.89
B) 1.90
C) 2.12
D) 13.44
E) Cannot be determined from information given.
Unlock Deck
Unlock for access to all 134 flashcards in this deck.
Unlock Deck
k this deck
15
Dottie Kleman is the "Cookie Lady." She bakes and sells cookies at 50 different locations. Ms.
Kleman is concerned about absenteeism among her workers. The information below reports the
Number of days absent for a sample of 10 workers during the last two-week pay period.
The sample mean is calculated to be 1.8 and sample standard deviation is 1.1353. Develop a 95%
Confidence interval for the population mean. Assume that the population distribution is normal. Is it
Reasonable to conclude that the typical worker does not miss any days during a pay period?
A) [0.99, 2.61] It is unreasonable to conclude that the mean number of days of work missed is 0 per employee.
B) [0.99, 2.61] It is reasonable to conclude that the mean number of days of work missed is 0 per employee.
C) [-0.99, -2.61] It is unreasonable to conclude that the mean number of days of work missed is 0 per employee.
D) [-0.99, -2.61] It is reasonable to conclude that the mean number of days of work missed is 0 per employee.
Unlock Deck
Unlock for access to all 134 flashcards in this deck.
Unlock Deck
k this deck
16
Which of the following would be used as a point estimate for the population mean (µ)?
A) σ
B) x/n
C)
D) s
E) p
A) σ
B) x/n
C)
D) s
E) p
Unlock Deck
Unlock for access to all 134 flashcards in this deck.
Unlock Deck
k this deck
17
A sample standard deviation is the best point estimate of the
A) population range.
B) population skewness.
C) population mode.
D) population standard deviation.
E) population variance.
A) population range.
B) population skewness.
C) population mode.
D) population standard deviation.
E) population variance.
Unlock Deck
Unlock for access to all 134 flashcards in this deck.
Unlock Deck
k this deck
18
When a confidence interval for a population mean is constructed from sample data,
A) we can conclude that the population mean is in the interval.
B) we can conclude that the population mean is not in the interval.
C) we can conclude, with a stated level of confidence, that the population mean is in the interval.
D) we cannot make any inferences.
A) we can conclude that the population mean is in the interval.
B) we can conclude that the population mean is not in the interval.
C) we can conclude, with a stated level of confidence, that the population mean is in the interval.
D) we cannot make any inferences.
Unlock Deck
Unlock for access to all 134 flashcards in this deck.
Unlock Deck
k this deck
19
The z-value associated with a 94% level of confidence is:
A) 1.96
B) 1.645
C) 2.33
D) 2.575
E) 1.88
A) 1.96
B) 1.645
C) 2.33
D) 2.575
E) 1.88
Unlock Deck
Unlock for access to all 134 flashcards in this deck.
Unlock Deck
k this deck
20
A confidence interval for a population mean
A) estimates the population range.
B) estimates a likely interval for a population mean.
C) estimates a likelihood or probability.
D) estimates the population standard deviation.
A) estimates the population range.
B) estimates a likely interval for a population mean.
C) estimates a likelihood or probability.
D) estimates the population standard deviation.
Unlock Deck
Unlock for access to all 134 flashcards in this deck.
Unlock Deck
k this deck
21
A survey of 144 retail stores revealed that the average price of a DVD was $375 with a standard
Error of $20. What is the 95% confidence interval to estimate the true cost of the DVD?
A) $323.40 to $426.60
B) $328.40 to $421.60
C) $335.00 to $415.00
D) $335.80 to $414.20
Error of $20. What is the 95% confidence interval to estimate the true cost of the DVD?
A) $323.40 to $426.60
B) $328.40 to $421.60
C) $335.00 to $415.00
D) $335.80 to $414.20
Unlock Deck
Unlock for access to all 134 flashcards in this deck.
Unlock Deck
k this deck
22
i. The t distribution is based on the assumption that the population of interest is normal or nearly
Normal.
ii. The t distribution is a continuous distribution.
iii. There is not one t distribution, but rather a "family" of t distributions.
A) (i), (ii), and (iii) are all correct statements.
B) (i) is a correct statement but not (ii) or (iii).
C) (i) and (iii) are correct statements but not (ii).
D) (ii) and (iii) are correct statements but not (i).
E) (i), (ii), and (iii) are all false statements.
Unlock Deck
Unlock for access to all 134 flashcards in this deck.
Unlock Deck
k this deck
23
A survey of 25 grocery stores revealed that the average price of a 4-litre bag of milk was $2.98 with
A standard error of $0.10. What is the 98% confidence interval to estimate the true cost of a 4-litre
Bag of milk?
A) $2.75 to $3.21
B) $2.85 to $3.11
C) $2.94 to $3.02
D) $2.95 to $3.01
E) $2.77 to $3.19
A standard error of $0.10. What is the 98% confidence interval to estimate the true cost of a 4-litre
Bag of milk?
A) $2.75 to $3.21
B) $2.85 to $3.11
C) $2.94 to $3.02
D) $2.95 to $3.01
E) $2.77 to $3.19
Unlock Deck
Unlock for access to all 134 flashcards in this deck.
Unlock Deck
k this deck
24
i. The t distribution is based on the assumption that the population of interest is normal or nearly
Normal.
ii. The t distribution is a discrete distribution.
iii. There is not one t distribution, but rather a "family" of t distributions.
A) (i), (ii), and (iii) are all correct statements.
B) (i) is a correct statement but not (ii) or (iii).
C) (i) and (iii) are correct statements but not (ii).
D) (ii) and (iii) are correct statements but not (i).
E) (i), (ii), and (iii) are all false statements.
Unlock Deck
Unlock for access to all 134 flashcards in this deck.
Unlock Deck
k this deck
25
i. The test statistic for a problem involving an unknown population standard deviation is the
Student's t distribution.
ii. The t distribution approaches the Z distribution as the sample size increases.
iii. As the sample size increases, the computed value of t decreases.
A) (i), (ii), and (iii) are all correct statements.
B) (iii) is a correct statement but not (i) or (ii).
C) (i) and (iii) are correct statements but not (ii).
D) (ii) and (iii) are correct statements but not (i).
E) (i), (ii), and (iii) are all false statements.
Unlock Deck
Unlock for access to all 134 flashcards in this deck.
Unlock Deck
k this deck
26
A survey of 144 retail stores revealed that the average price of a DVD was $375 with a standard
Error of $20. If 95% and 98% confidence intervals were developed to estimate the true cost of the
DVD, what differences would they have?
A) Standard errors
B) Interval widths
C) Z-values
D) Both standard errors and interval widths
E) Both interval widths and Z-values
Error of $20. If 95% and 98% confidence intervals were developed to estimate the true cost of the
DVD, what differences would they have?
A) Standard errors
B) Interval widths
C) Z-values
D) Both standard errors and interval widths
E) Both interval widths and Z-values
Unlock Deck
Unlock for access to all 134 flashcards in this deck.
Unlock Deck
k this deck
27
i. The Student t distribution has a greater spread than does the z distribution. As a result, the critical
Values of t for a given level of significance are larger in magnitude than the corresponding z critical
Values.
ii. The test statistic t has n-1 degrees of freedom.
iii. William S. Gosset, a brewmaster, developed the t test for the Guinness Brewery in Ireland, who
Published it in 1908 using the pen name "Student."
A) (i), (ii), and (iii) are all correct statements.
B) (iii) is a correct statement but not (i) or (ii).
C) (i) and,(iii) are correct statements but not (ii).
D) (ii) and (iii) are correct statements but not (i).
E) (i), (ii), and (iii) are all false statements.
Unlock Deck
Unlock for access to all 134 flashcards in this deck.
Unlock Deck
k this deck
28
i. The test statistic t has n-1 degrees of freedom.
ii. All t distributions have the same mean of zero and a standard deviation of 1.
iii. The t distribution is more spread out and flatter at the center than is the standard normal
Distribution. However, as the sample size increases, the t distribution curve approaches the
Standard normal distribution.
A) (i), (ii), and (iii) are all correct statements.
B) (iii) is a correct statement but not (i) or (ii).
C) (i) and (iii) are correct statements but not (ii).
D) (ii) and (iii) are correct statements but not (i).
E) (i), (ii), and (iii) are all false statements.
Unlock Deck
Unlock for access to all 134 flashcards in this deck.
Unlock Deck
k this deck
29
i. The t distribution is positively skewed.
ii. All t distributions have the same mean of zero and a standard deviation of 1.
iii. The t distribution is more spread out and flatter at the center than is the standard normal
Distribution. However, as the sample size increases, the t distribution curve approaches the
Standard normal distribution.
A) (i), (ii), and (iii) are all correct statements.
B) (iii) is a correct statement but not (i) or (ii).
C) (i) and (iii) are correct statements but not (ii).
D) (ii) and (iii) are correct statements but not (i).
E) (i), (ii), and (iii) are all false statements.
Unlock Deck
Unlock for access to all 134 flashcards in this deck.
Unlock Deck
k this deck
30
Recently, a university surveyed recent graduates of the English Department for their starting
Salaries. Four hundred graduates returned the survey. The average salary was $55,000. The
Population standard deviation is known to be $2,500.
What is the 90% confidence interval for the mean salary of all graduates from the English
Department?
A) 5,497, $55,039
B) 54,794, $55,206
C) 54,671, $55,329
D) 54,961, $5,539
E) 54,800, $55,200
Unlock Deck
Unlock for access to all 134 flashcards in this deck.
Unlock Deck
k this deck
31
Dr. Patton is a professor of English. Recently she counted the number of misspelled works in a
Group of student essays. She noted the distribution of misspelled words per essay followed the
Normal distribution with a standard deviation of 2.44 words per essay. For her Tuesday class of 44
Students, the mean number of misspelled words per essay was 6.05. Construct a 90% confidence
Interval for the mean number of misspelled words in the population of student essays.
A) 5.374 to 6.726
B) 5.161 to 6.939
C) 5.102 to 6.998
D) 5.482 to 6.618
E) 5.445 to 6.6551
Unlock Deck
Unlock for access to all 134 flashcards in this deck.
Unlock Deck
k this deck
32
Recently, a university surveyed recent graduates of the English Department for their starting
Salaries. Four hundred graduates returned the survey. The average salary was $55,000. The
Population standard deviation is known to be $2,500.
What is the 95% confidence interval for the mean salary of all graduates from the English
Department?
A) 52,500, $57,500
B) 54,755, $55,245
C) 54,988, $55,012
D) 54,600, $55,600
Unlock Deck
Unlock for access to all 134 flashcards in this deck.
Unlock Deck
k this deck
33
Which statement(s) is/are correct about the t distribution?
A) Mean = 0
B) Symmetric
C) Based on degrees of freedom
D) Mean = 0, symmetric and based on degrees of freedom
E) Mean = 0 and symmetric
A) Mean = 0
B) Symmetric
C) Based on degrees of freedom
D) Mean = 0, symmetric and based on degrees of freedom
E) Mean = 0 and symmetric
Unlock Deck
Unlock for access to all 134 flashcards in this deck.
Unlock Deck
k this deck
34
Dr. Patton is a professor of English. Recently she counted the number of misspelled works in a
Group of student essays. She noted the distribution of misspelled words per essay followed the
Normal distribution with a standard deviation of 2.44 words per essay. For her Tuesday class of 50
Students, the mean number of misspelled words per essay was 6.05. Construct a 95% confidence
Interval for the mean number of misspelled words in the population of student essays.
A) 5.374 to 6.726
B) 5.161 to 6.939
C) 5.102 to 6.998
D) 5.482 to 6.618
E) 5.445 to 6.3655
Unlock Deck
Unlock for access to all 134 flashcards in this deck.
Unlock Deck
k this deck
35
A survey of 144 retail stores revealed that the average price of a DVD was $375 with a standard
Error of $20. If 90% and 95% confidence intervals were developed to estimate the true cost of the
DVD, what similarities would they have?
A) Point estimates
B) Z-values would be the same
C) Standard errors
D) Both point estimates and standard errors would be the same
E) Both standard errors Z-values would be the same
Unlock Deck
Unlock for access to all 134 flashcards in this deck.
Unlock Deck
k this deck
36
Dr. Patton is a professor of English. Recently she counted the number of misspelled works in a
Group of student essays. She noted the distribution of misspelled words per essay followed the
Normal distribution with a standard deviation of 2.44 words per essay. For her Tuesday class of 50
Students, the mean number of misspelled words per essay was 6.05. Construct a 90% confidence
Interval for the mean number of misspelled words in the population of student essays.
A) 5.374 to 6.726
B) 5.161 to 6.939
C) 5.102 to 6.998
D) 5.482 to 6.618
E) 5.445 to 6.3655
Unlock Deck
Unlock for access to all 134 flashcards in this deck.
Unlock Deck
k this deck
37
A survey of 144 retail stores revealed that the average price of a DVD was $375 with a standard
Error of $20. What is the 99% confidence interval to estimate the true cost of the DVD?
A) $323.40 to $426.60
B) $328.40 to $421.60
C) $335.00 to $415.00
D) $335.80 to $414.20
Error of $20. What is the 99% confidence interval to estimate the true cost of the DVD?
A) $323.40 to $426.60
B) $328.40 to $421.60
C) $335.00 to $415.00
D) $335.80 to $414.20
Unlock Deck
Unlock for access to all 134 flashcards in this deck.
Unlock Deck
k this deck
38
Dr. Patton is a professor of English. Recently she counted the number of misspelled works in a
Group of student essays. She noted the distribution of misspelled words per essay followed the
Normal distribution with a standard deviation of 2.44 words per essay. For her Tuesday class of 50
Students, the mean number of misspelled words per essay was 6.05. Construct a 99% confidence
Interval for the mean number of misspelled words in the population of student essays.
A) 5.374 to 6.726
B) 5.160 to 6.940
C) 5.102 to 6.998
D) 5.482 to 6.618
E) 5.445 to 6.3655
Unlock Deck
Unlock for access to all 134 flashcards in this deck.
Unlock Deck
k this deck
39
A survey of 25 grocery stores revealed that the average price of a 4-litre bag of milk was $2.98 with
A standard error of $0.10. If 90% and 95% confidence intervals were developed to estimate the true
Cost of a 4-litre bag of milk, what similarities would they have?
A) Point estimates
B) t-statistics
C) Standard errors
D) Both the same point estimate and the same standard error
E) Both the same t-statistic and point estimate
Unlock Deck
Unlock for access to all 134 flashcards in this deck.
Unlock Deck
k this deck
40
A survey of 25 grocery stores revealed that the average price of a 4-litre bag of milk was $2.98 with
A standard error of $0.10. What is the 95% confidence interval to estimate the true cost of a 4-litre
Bag of milk?
A) $2.81 to $3.15
B) $2.94 to $3.02
C) $2.78 to $3.18
D) $2.95 to $3.01
E) $2.73 to $3.23
A standard error of $0.10. What is the 95% confidence interval to estimate the true cost of a 4-litre
Bag of milk?
A) $2.81 to $3.15
B) $2.94 to $3.02
C) $2.78 to $3.18
D) $2.95 to $3.01
E) $2.73 to $3.23
Unlock Deck
Unlock for access to all 134 flashcards in this deck.
Unlock Deck
k this deck
41
A manager of a local store wants to estimate the mean amount spent per shopping visit by
Customers. Summary statistics from a sample taken reveal the following:
Determine a 95% confidence interval for the mean amount spent.
A) [45.21, 53.56]
B) [40.36, 58.35]
C) [30.54, 68.14]
D) [45.13, 53.56]
E) [29.34, 69.34]
Customers. Summary statistics from a sample taken reveal the following:
Determine a 95% confidence interval for the mean amount spent.
A) [45.21, 53.56]
B) [40.36, 58.35]
C) [30.54, 68.14]
D) [45.13, 53.56]
E) [29.34, 69.34]
Unlock Deck
Unlock for access to all 134 flashcards in this deck.
Unlock Deck
k this deck
42
A sample of 20 is selected from the population. What is the number of degrees of freedom used to
Determine the appropriate critical t-value?
A) 20
B) 19
C) 21
D) 25
Determine the appropriate critical t-value?
A) 20
B) 19
C) 21
D) 25
Unlock Deck
Unlock for access to all 134 flashcards in this deck.
Unlock Deck
k this deck
43
A manager of a local store wants to estimate the mean amount spent per shopping visit by
Customers. Summary statistics from a sample taken reveal the following:
The store manager wonders whether the population mean could have been $50 or $60.
A) Since $60 is within the 95% confidence interval, the population mean is likely to be $60.
B) Since $60 is not within the 95% confidence interval, the population mean is not likely to be $60.
C) Since $50 is within the 95% confidence interval, the population mean is likely to be $50.
D) Since $50 is not within the 95% confidence interval, the population mean is not likely to be $50.
E) Since $60 is not within the 95% confidence interval, the population mean is not likely to be $60; however, it is likely to be $50.
Unlock Deck
Unlock for access to all 134 flashcards in this deck.
Unlock Deck
k this deck
44
A student wanted to quickly construct a 95% confidence interval for the average age of students in
Her statistics class. She randomly selected 9 students. Their average age was 19.1 years with a
Standard deviation of 1.5 years. What is the 95% confidence interval for the population mean?
A) [0.97, 3.27]
B) [15.64, 22.56]
C) [17.97, 20.23]
D) [17.95, 20.25]
E) [17.42, 20.78]
Her statistics class. She randomly selected 9 students. Their average age was 19.1 years with a
Standard deviation of 1.5 years. What is the 95% confidence interval for the population mean?
A) [0.97, 3.27]
B) [15.64, 22.56]
C) [17.97, 20.23]
D) [17.95, 20.25]
E) [17.42, 20.78]
Unlock Deck
Unlock for access to all 134 flashcards in this deck.
Unlock Deck
k this deck
45
The t distribution is similar to the z distribution in all BUT ONE of the following characteristics. Which
One is it?
A) Continuous
B) Symmetrical
C) Bell-shaped
D) t distribution's mean = 0 and standard deviation = 1
One is it?
A) Continuous
B) Symmetrical
C) Bell-shaped
D) t distribution's mean = 0 and standard deviation = 1
Unlock Deck
Unlock for access to all 134 flashcards in this deck.
Unlock Deck
k this deck
46
A student wanted to quickly construct a 95% confidence interval for the average age of students in
Her statistics class. She randomly selected 9 students. Their average age was 19.1 years with a
Standard deviation of 1.5 years. What is the best point estimate for the population mean?
A) 2.1 years
B) 1.5 years
C) 19.1 years
D) 9 years
E) 17.6 years
Her statistics class. She randomly selected 9 students. Their average age was 19.1 years with a
Standard deviation of 1.5 years. What is the best point estimate for the population mean?
A) 2.1 years
B) 1.5 years
C) 19.1 years
D) 9 years
E) 17.6 years
Unlock Deck
Unlock for access to all 134 flashcards in this deck.
Unlock Deck
k this deck
47
A student wanted to quickly construct a 99% confidence interval for the average age of students in
Her statistics class. She randomly selected 9 students. Their average age was 19.1 years with a
Standard deviation of 1.5 years. What is the 99% confidence interval for the population mean?
A) [17.42, 20.78]
B) [17.48, 20.72]
C) [14.23, 23.98]
D) [0.44, 3.80]
E) [17.95, 20.25]
Her statistics class. She randomly selected 9 students. Their average age was 19.1 years with a
Standard deviation of 1.5 years. What is the 99% confidence interval for the population mean?
A) [17.42, 20.78]
B) [17.48, 20.72]
C) [14.23, 23.98]
D) [0.44, 3.80]
E) [17.95, 20.25]
Unlock Deck
Unlock for access to all 134 flashcards in this deck.
Unlock Deck
k this deck
48
A sample of 100 students is selected from a known population of 1,000 students to construct a 95%
Confidence interval for the average SAT score. What correction factor should be used to compute
The standard error?
A) 0.949
B) 0.901
C) 1.96
D) 9.01
E) Cannot be determined
Confidence interval for the average SAT score. What correction factor should be used to compute
The standard error?
A) 0.949
B) 0.901
C) 1.96
D) 9.01
E) Cannot be determined
Unlock Deck
Unlock for access to all 134 flashcards in this deck.
Unlock Deck
k this deck
49
What kind of distribution is the t distribution?
A) Continuous
B) Discrete
C) Subjective
D) Standard
A) Continuous
B) Discrete
C) Subjective
D) Standard
Unlock Deck
Unlock for access to all 134 flashcards in this deck.
Unlock Deck
k this deck
50
A manager of a local store wants to estimate the mean amount spent per shopping visit by
Customers. Summary statistics from a sample taken reveal the following:
If 90% and 95% confidence intervals were developed to estimate the true shopping expenditure,
What similarities would exist?
A) Point estimates
B) t-values would be the same
C) Standard errors
D) Both point estimates and standard errors
E) Both point estimates and t-values
Unlock Deck
Unlock for access to all 134 flashcards in this deck.
Unlock Deck
k this deck
51
The t distribution approaches __________ as the sample size increases.
As the sample size increases, the computed value of t ______________.
A) Z distribution; decreases
B) Z distribution; increases
C) Z distribution; stays the same
D) 0; decreases
E) 0; increases
As the sample size increases, the computed value of t ______________.
A) Z distribution; decreases
B) Z distribution; increases
C) Z distribution; stays the same
D) 0; decreases
E) 0; increases
Unlock Deck
Unlock for access to all 134 flashcards in this deck.
Unlock Deck
k this deck
52
The distribution of Student's t is
A) symmetrical.
B) negatively skewed.
C) positively skewed.
D) a discrete probability distribution.
A) symmetrical.
B) negatively skewed.
C) positively skewed.
D) a discrete probability distribution.
Unlock Deck
Unlock for access to all 134 flashcards in this deck.
Unlock Deck
k this deck
53
A manager of a local store wants to estimate the mean amount spent per shopping visit by
Customers. Summary statistics from a sample taken reveal the following:
If 95% and 98% confidence intervals were developed to estimate the true shopping expenditure,
What differences would exist?
A) Standard errors
B) Interval widths
C) t-values
D) Both interval widths and t-values
E) Both standard errors and interval widths
Unlock Deck
Unlock for access to all 134 flashcards in this deck.
Unlock Deck
k this deck
54
When using Student's t to compute an interval estimate,
A) we assume that the samples are collected from normally distributed populations.
B) we estimate the population standard deviation based on the sample standard deviation.
C) use the z distribution.
D) we assume that samples are collected from normally distributed populations and the estimate of the population standard deviation based on the sample standard deviation.
E) we assume that the samples are collected from normally distributed populations and use the z distribution.
Unlock Deck
Unlock for access to all 134 flashcards in this deck.
Unlock Deck
k this deck
55
How does the t distribution differ from the standard z distribution?
A) Continuous distribution
B) Bell-shaped
C) Family of distributions
D) Symmetrical
A) Continuous distribution
B) Bell-shaped
C) Family of distributions
D) Symmetrical
Unlock Deck
Unlock for access to all 134 flashcards in this deck.
Unlock Deck
k this deck
56
A statistics professor wishes to estimate the average mark on a term test for a course that has
Multiple sections and many students. A survey of some of the students registered for the course
Reveals the following results:
Determine a 95% confidence interval for the term test results.
A) [48.0, 93.6]
B) [66.8, 74.8]
C) [62.9, 78.71]
D) [64.2, 77.3]
E) [62.6, 79.0]
Multiple sections and many students. A survey of some of the students registered for the course
Reveals the following results:
Determine a 95% confidence interval for the term test results.
A) [48.0, 93.6]
B) [66.8, 74.8]
C) [62.9, 78.71]
D) [64.2, 77.3]
E) [62.6, 79.0]
Unlock Deck
Unlock for access to all 134 flashcards in this deck.
Unlock Deck
k this deck
57
In order to construct a 95% confidence interval for the population mean when the population
Standard deviation is unknown and the sample size is 15, you should use the t-value indicated as:
A) t0.10,15
B) t0.10,14
C) t0.05,15
D) t0.05,14
E) t0.025,14
Standard deviation is unknown and the sample size is 15, you should use the t-value indicated as:
A) t0.10,15
B) t0.10,14
C) t0.05,15
D) t0.05,14
E) t0.025,14
Unlock Deck
Unlock for access to all 134 flashcards in this deck.
Unlock Deck
k this deck
58
The distribution of Student's t has
A) a mean of zero and a standard deviation of one.
B) a mean of one and a standard deviation of one.
C) a mean of zero and a standard deviation that depends on the sample size.
D) a mean that depends on the sample size and a standard deviation of one.
A) a mean of zero and a standard deviation of one.
B) a mean of one and a standard deviation of one.
C) a mean of zero and a standard deviation that depends on the sample size.
D) a mean that depends on the sample size and a standard deviation of one.
Unlock Deck
Unlock for access to all 134 flashcards in this deck.
Unlock Deck
k this deck
59
In order to construct a 90% confidence interval for the population mean when the population
Standard deviation is unknown and the sample size is 18, you should use the t-value indicated as:
A) t0.10,18
B) t0.10,17
C) t0.05,18
D) t0.05,17
E) t0.90,17
Standard deviation is unknown and the sample size is 18, you should use the t-value indicated as:
A) t0.10,18
B) t0.10,17
C) t0.05,18
D) t0.05,17
E) t0.90,17
Unlock Deck
Unlock for access to all 134 flashcards in this deck.
Unlock Deck
k this deck
60
Student's t is used when
A) the sample is more than 30 observations.
B) the sample size is ≤ 5% of the population.
C) the population standard deviation is unknown.
D) any time.
A) the sample is more than 30 observations.
B) the sample size is ≤ 5% of the population.
C) the population standard deviation is unknown.
D) any time.
Unlock Deck
Unlock for access to all 134 flashcards in this deck.
Unlock Deck
k this deck
61
The following summarizes the amount of snowfall in Ontario over the past number of years. If 90% and 95% confidence intervals were developed to estimate the true average annual snowfall,
What similarities would they have?
A) Point estimates
B) Z-values
C) Standard errors
D) Both point estimates and standard errors
E) Both point estimates and Z-Values
If 90% and 95% confidence intervals were developed to estimate the true average annual snowfall,What similarities would they have?
A) Point estimates
B) Z-values
C) Standard errors
D) Both point estimates and standard errors
E) Both point estimates and Z-Values
Unlock Deck
Unlock for access to all 134 flashcards in this deck.
Unlock Deck
k this deck
62
The following summarizes the amount of snowfall in Ontario over the past number of years. If 95% and 98% confidence intervals were developed to estimate the true average annual snowfall,
What differences would exist?
A) Standard errors
B) Interval widths
C) Z-values
D) Both interval widths and Z-values
If 95% and 98% confidence intervals were developed to estimate the true average annual snowfall,What differences would exist?
A) Standard errors
B) Interval widths
C) Z-values
D) Both interval widths and Z-values
Unlock Deck
Unlock for access to all 134 flashcards in this deck.
Unlock Deck
k this deck
63
A random sample of 85 group leaders, supervisors, and similar personnel revealed that on the
Average a person spent 6.5 years on the job before being promoted. The standard deviation of the
Sample was 1.7 years. What is the 95% confidence interval for the true population mean?
A) 6.46 and 6.54
B) 3.17 and 9.83
C) 6.13 and 6.87
D) 6.20 and 6.70
E) 6.32 and 6.88
Average a person spent 6.5 years on the job before being promoted. The standard deviation of the
Sample was 1.7 years. What is the 95% confidence interval for the true population mean?
A) 6.46 and 6.54
B) 3.17 and 9.83
C) 6.13 and 6.87
D) 6.20 and 6.70
E) 6.32 and 6.88
Unlock Deck
Unlock for access to all 134 flashcards in this deck.
Unlock Deck
k this deck
64
A statistics professor wishes to estimate the average mark on a term test for a course that has
Multiple sections and many students. A survey of some of the students registered for the course
Reveals the following results:
The student from the course wonders whether the population mean could have been 60 or 80.
A) Since 80 is within the 95% confidence interval, the population mean is likely to be 80.
B) Since 80 is not within the 95% confidence interval, the population mean is not likely to be 80.
C) Since 60 is within the 95% confidence interval, the population mean is likely to be 60.
D) Since neither 60 nor 80 is within the 95% confidence interval, the population mean is not likely to be 60 or 80.
Unlock Deck
Unlock for access to all 134 flashcards in this deck.
Unlock Deck
k this deck
65
The following summarizes the amount of snowfall in Ontario over the past number of years. You wonder whether the population mean could have been 1,600 or 2,100.
A) Since 1600 is within the 95% confidence interval, the population mean is likely to be 1,600.
B) Since 1600 is not within the 95% confidence interval, the population mean is not likely to be 1,600.
C) Since 2100 is within the 95% confidence interval, the population mean is likely to be 2,100.
D) Since neither 1,600 nor 2,100 is within the 95% confidence interval, the population mean is not likely to be 1,600 or 2000.
E) Since 1900 and 2000 are both within the 95% confidence interval, the population mean is likely to be either value.
You wonder whether the population mean could have been 1,600 or 2,100.A) Since 1600 is within the 95% confidence interval, the population mean is likely to be 1,600.
B) Since 1600 is not within the 95% confidence interval, the population mean is not likely to be 1,600.
C) Since 2100 is within the 95% confidence interval, the population mean is likely to be 2,100.
D) Since neither 1,600 nor 2,100 is within the 95% confidence interval, the population mean is not likely to be 1,600 or 2000.
E) Since 1900 and 2000 are both within the 95% confidence interval, the population mean is likely to be either value.
Unlock Deck
Unlock for access to all 134 flashcards in this deck.
Unlock Deck
k this deck
66
Dottie Kleman is the "Cookie Lady." She bakes and sells cookies at 50 different locations. Ms.
Kleman is concerned about absenteeism among her workers. The information below reports the
Number of days absent for a sample of 10 workers during the last two-week pay period.
The sample mean is calculated to be 1.8 and sample standard deviation is 1.1353. Develop a 95%
Confidence interval for the population mean. Assume that the population distribution is normal. Is it
Reasonable to conclude that the typical worker misses 2 days during a pay period?
A) [0.99, 2.61] It is unreasonable to conclude that the mean number of days of work missed is 2 per employee.
B) [0.99, 2.61] It is reasonable to conclude that the mean number of days of work missed is 2 per employee.
C) [1.99, 2.61] It is unreasonable to conclude that the mean number of days of work missed is 2 per employee.
D) [0.99, 1.61] It is reasonable to conclude that the mean number of days of work missed is 2 per employee.
Unlock Deck
Unlock for access to all 134 flashcards in this deck.
Unlock Deck
k this deck
67
A statistics professor wishes to estimate the average mark on a term test for a course that has
Multiple sections and many students. A survey of some of the students registered for the course
Reveals the following results:
Determine a 98% confidence interval for the term test results.
A) [48.0, 93.6]
B) [66.8, 74.8]
C) [62.9, 78.71]
D) [64.2, 77.3]
E) [60.9, 80.7]
Multiple sections and many students. A survey of some of the students registered for the course
Reveals the following results:
Determine a 98% confidence interval for the term test results.
A) [48.0, 93.6]
B) [66.8, 74.8]
C) [62.9, 78.71]
D) [64.2, 77.3]
E) [60.9, 80.7]
Unlock Deck
Unlock for access to all 134 flashcards in this deck.
Unlock Deck
k this deck
68
The mean weight of trucks traveling on a particular section of Highway 401 is not known. A
Provincial highway inspector needs an estimate of the mean. He selects a random sample of 49
Trucks passing the weighing station and finds the mean is 15.8 tons, with a standard deviation of the
Sample of 3.8 tons. What is the 95 percent interval for the population mean?
A) 14.7 and 16.9
B) 13.2 and 17.6
C) 10.0 and 20.0
D) 16.1 and 18.1
Unlock Deck
Unlock for access to all 134 flashcards in this deck.
Unlock Deck
k this deck
69
A statistics professor wishes to estimate the average mark on a term test for a course that has
Multiple sections and many students. A survey of some of the students registered for the course
Reveals the following results:
The student from the course wonders whether the population mean could have been 75 or 80.
A) Since 80 is within the 95% confidence interval, the population mean is likely to be 80.
B) Since 80 is not within the 95% confidence interval, the population mean is not likely to be 80.
C) Since 75 is within the 95% confidence interval, the population mean is likely to be 75.
D) Since neither 75 nor 80 is within the 95% confidence interval, the population mean is not likely to be 75 or 80.
E) Since 80 is not within the 95% confidence interval, the population mean is not likely to be 80, but it is likely to be 75.
Unlock Deck
Unlock for access to all 134 flashcards in this deck.
Unlock Deck
k this deck
70
The following summarizes the amount of snowfall in Ontario over the past number of years. Determine a 98% confidence interval for the average annual snowfall.
A) [1698, 2046]
B) [1665, 2079]
C) [1213, 2531]
D) [1783, 1961]
E) [1659, 2085]
Determine a 98% confidence interval for the average annual snowfall.A) [1698, 2046]
B) [1665, 2079]
C) [1213, 2531]
D) [1783, 1961]
E) [1659, 2085]
Unlock Deck
Unlock for access to all 134 flashcards in this deck.
Unlock Deck
k this deck
71
The following summarizes the average price of Air Canada stock at the end of 20 randomly
Selected weeks in 2000.
Determine a 95% confidence interval for the average Air Canada stock price in 2000.
A) [16.83, 17.42]
B) [14.90, 19.87]
C) [17.48, 19.40]
D) [16.24, 18.56]
E) [16.23, 18.55]
Selected weeks in 2000.
Determine a 95% confidence interval for the average Air Canada stock price in 2000.
A) [16.83, 17.42]
B) [14.90, 19.87]
C) [17.48, 19.40]
D) [16.24, 18.56]
E) [16.23, 18.55]
Unlock Deck
Unlock for access to all 134 flashcards in this deck.
Unlock Deck
k this deck
72
The following summarizes the amount of snowfall in Ontario over the past number of years. Determine a 95% confidence interval for the average annual snowfall.
A) [1,698, 2,046]
B) [1,665, 2,079]
C) [1,213, 2,531]
D) [1,783, 1,961]
E) [1694, 2050]
Determine a 95% confidence interval for the average annual snowfall.A) [1,698, 2,046]
B) [1,665, 2,079]
C) [1,213, 2,531]
D) [1,783, 1,961]
E) [1694, 2050]
Unlock Deck
Unlock for access to all 134 flashcards in this deck.
Unlock Deck
k this deck
73
A pharmaceutical company wanted to estimate the population mean of monthly sales for their 250
Sales people. Forty sales people were randomly selected. Their mean monthly sales were $10,000
With a standard deviation of $1,000. Construct a 95% confidence interval for the population mean.
A) [9,690.1, 10,309.9]
B) [9706.3, 10293.7]
C) [8,040, 11,960]
D) [8,000, 12,000]
E) [9,000, 11,000]
Sales people. Forty sales people were randomly selected. Their mean monthly sales were $10,000
With a standard deviation of $1,000. Construct a 95% confidence interval for the population mean.
A) [9,690.1, 10,309.9]
B) [9706.3, 10293.7]
C) [8,040, 11,960]
D) [8,000, 12,000]
E) [9,000, 11,000]
Unlock Deck
Unlock for access to all 134 flashcards in this deck.
Unlock Deck
k this deck
74
The Sugar Producers Association wants to estimate the mean yearly sugar consumption. A sample
Of 16 people reveals the mean yearly consumption to be 27 kg with a sample standard deviation of
9 kg. Assume a normal population. For a 95% confidence interval, what is the critical value needed?
A) t = 1.753
B) t = 2.131
C) t = 2.947
D) z = 1.645
E) z = 1.96
Of 16 people reveals the mean yearly consumption to be 27 kg with a sample standard deviation of
9 kg. Assume a normal population. For a 95% confidence interval, what is the critical value needed?
A) t = 1.753
B) t = 2.131
C) t = 2.947
D) z = 1.645
E) z = 1.96
Unlock Deck
Unlock for access to all 134 flashcards in this deck.
Unlock Deck
k this deck
75
The Sugar Producers Association wants to estimate the mean yearly sugar consumption. A sample
Of 16 people reveals the mean yearly consumption to be 27 kg with a sample standard deviation of
9 kg. Assume a normal population. For a 90% confidence interval, what is the critical value needed?
A) t = 1.753
B) t = 2.131
C) t = 2.947
D) z = 1.645
E) z = 1.96
Of 16 people reveals the mean yearly consumption to be 27 kg with a sample standard deviation of
9 kg. Assume a normal population. For a 90% confidence interval, what is the critical value needed?
A) t = 1.753
B) t = 2.131
C) t = 2.947
D) z = 1.645
E) z = 1.96
Unlock Deck
Unlock for access to all 134 flashcards in this deck.
Unlock Deck
k this deck
76
The following summarizes the average price of Air Canada stock at the end of 20 randomly
Selected weeks in 2000.
Determine a 90% confidence interval for the average Air Canada stock price in 2000.
A) [16.44, 18.36]
B) [14.90, 19.87]
C) [17.48, 19.40]
D) [16.43, 18.35]
E) Unable to determine from the information given
Selected weeks in 2000.
Determine a 90% confidence interval for the average Air Canada stock price in 2000.
A) [16.44, 18.36]
B) [14.90, 19.87]
C) [17.48, 19.40]
D) [16.43, 18.35]
E) Unable to determine from the information given
Unlock Deck
Unlock for access to all 134 flashcards in this deck.
Unlock Deck
k this deck
77
A statistics professor wishes to estimate the average mark on a term test for a course that has
Multiple sections and many students. A survey of some of the students registered for the course
Reveals the following results:
If 95% and 98% confidence intervals were developed to estimate the true term test mean, what
Differences would exist?
A) Standard errors
B) Interval widths
C) t-values
D) Both interval widths and t-values
Unlock Deck
Unlock for access to all 134 flashcards in this deck.
Unlock Deck
k this deck
78
A statistics professor wishes to estimate the average mark on a term test for a course that has
Multiple sections and many students. A survey of some of the students registered for the course
Reveals the following results:
If 90% and 95% confidence intervals were developed to estimate the true term test mean, what
Similarities would exist?
A) Point estimates
B) t-values
C) Standard errors
D) Both point estimates and standard errors
E) No similarities with point estimates, t-values or standard errors
Unlock Deck
Unlock for access to all 134 flashcards in this deck.
Unlock Deck
k this deck
79
The following summarizes the average price of Air Canada stock at the end of 20 randomly
Selected weeks in 2000.
Determine a 98% confidence interval for the average TSE 300 stock index in 2000.
A) [9467.57, 10 084.68]
B) [9401.80, 10 150.40]
C) [9628.70, 9923.55]
D) [9468.61, 10 083.65]
Selected weeks in 2000.
Determine a 98% confidence interval for the average TSE 300 stock index in 2000.
A) [9467.57, 10 084.68]
B) [9401.80, 10 150.40]
C) [9628.70, 9923.55]
D) [9468.61, 10 083.65]
Unlock Deck
Unlock for access to all 134 flashcards in this deck.
Unlock Deck
k this deck
80
The following summarizes the amount of snowfall in Ontario over the past number of years. You wonder whether the population mean could have been 2000 or 1900.
A) Since 1900 is within the 95% confidence interval, the population mean is likely to be 1900.
B) Since 1900 is within the 95% confidence interval, the population mean is not likely to be 1900.
C) Since 2000 is within the 95% confidence interval, the population mean is likely to be 2000.
D) Since neither 1900 nor 200 is within the 95% confidence interval, the population mean is not likely to be 1900 or 2000.
E) Since 1900 and 2000 are both within the 95% confidence interval, the population mean is likely to be either value.
You wonder whether the population mean could have been 2000 or 1900.A) Since 1900 is within the 95% confidence interval, the population mean is likely to be 1900.
B) Since 1900 is within the 95% confidence interval, the population mean is not likely to be 1900.
C) Since 2000 is within the 95% confidence interval, the population mean is likely to be 2000.
D) Since neither 1900 nor 200 is within the 95% confidence interval, the population mean is not likely to be 1900 or 2000.
E) Since 1900 and 2000 are both within the 95% confidence interval, the population mean is likely to be either value.
Unlock Deck
Unlock for access to all 134 flashcards in this deck.
Unlock Deck
k this deck
Unlock Deck
Unlock for access to all 134 flashcards in this deck.


