Deck 3: Describing Data: Numerical Measures
Full screen (f)
Question
Using the information gathered for real estate prices in Regina and surrounding areas in the early
2000's, determine the standard deviation of the selling prices at that time.
A) $88,330
B) $20,000
C) $25,000
D) $78,350
E) $88,939
2000's, determine the standard deviation of the selling prices at that time.
A) $88,330
B) $20,000
C) $25,000
D) $78,350
E) $88,939
Question
Using the information gathered for real estate prices in Regina and surrounding areas in the early
2000's, determine the mean of the selling prices at that time.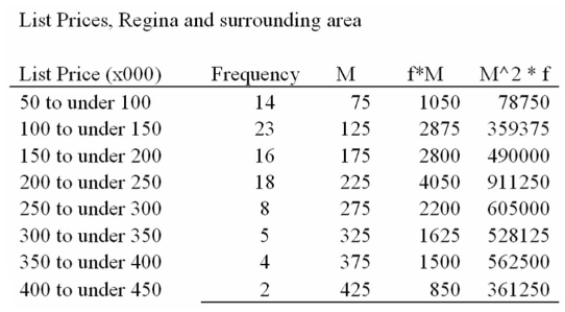
A) $188,330
B) $200,000
C) $125,000
D) $178,350
E) $195,600
2000's, determine the mean of the selling prices at that time.
A) $188,330
B) $200,000
C) $125,000
D) $178,350
E) $195,600
Question
Question
Question
Question
Question
A sample of the daily production of transceivers was organized into the following distribution. 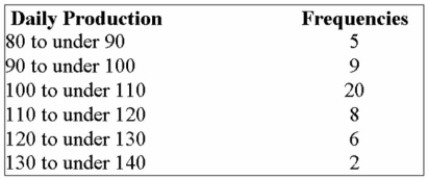 What is the mean daily production?
A) 86.4
B) 101.4
C) 111.4
D) 106.4
E) 20.0
What is the mean daily production?A) 86.4
B) 101.4
C) 111.4
D) 106.4
E) 20.0
Question
A bottling company offers three kinds of delivery service - instant, same day and within five days.
The profit per delivery varies according to the kind of delivery. The profit for an instant delivery is
Less than the other kinds because the driver has to go directly to a grocery store with a small load
And return to the bottling plant. To find out what effect each type of delivery has on the profit
Picture, the company has made the following tabulation based on deliveries for the previous
Quarter.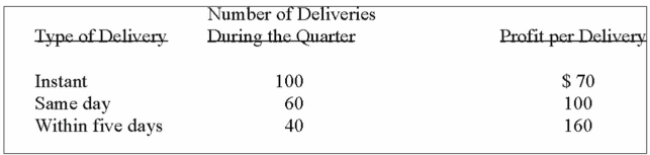
What is the weighted mean profit per delivery?
A) $72
B) $100
C) $142
D) $97
E) $99
Question
Question
Question
Question
Question
The net sales of a sample of small stamping plants were organized into the following percent
Frequency distribution.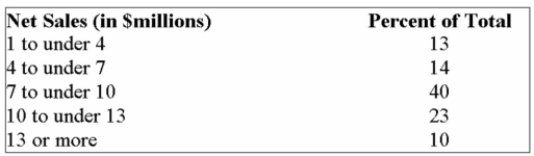
What is the mean net sales (in $millions)?
A) $7.09
B) $10.09
C) $8.59
D) $8.34
E) Mean cannot be computed
Frequency distribution.
What is the mean net sales (in $millions)?
A) $7.09
B) $10.09
C) $8.59
D) $8.34
E) Mean cannot be computed
Question
Using the information gathered for real estate prices in Regina and surrounding areas in the early
2000's, determine the median of the selling prices at that time.
A) $188,330
B) $200,000
C) $125,000
D) $175,000
E) $195,600
2000's, determine the median of the selling prices at that time.
A) $188,330
B) $200,000
C) $125,000
D) $175,000
E) $195,600
Question
Question
Question
Question
During the past six months, the purchasing agent bought: 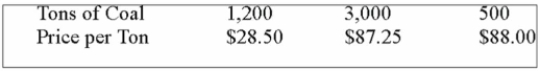 What is the weighted arithmetic mean price per ton?
A) $87.25
B) $72.33
C) $68.47
D) $89.18
E) Weighted mean cannot be computed for this data set.
What is the weighted arithmetic mean price per ton?A) $87.25
B) $72.33
C) $68.47
D) $89.18
E) Weighted mean cannot be computed for this data set.
Question
The ages of newly hired, unskilled employees were grouped into the following distribution: 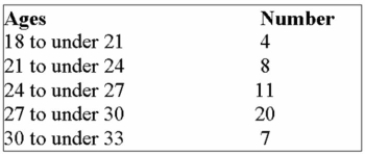 What is the median age?
A) 28.50
B) 28.08
C) 25.08
D) 27.14
E) 20.00
What is the median age?A) 28.50
B) 28.08
C) 25.08
D) 27.14
E) 20.00
Question
A sample of light trucks using diesel fuel revealed the following distribution based on fuel efficiency,
i.e., litres per 100 km.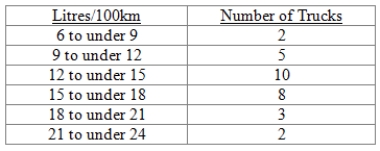
What is the arithmetic mean in litres per 100 km?
A) 16.9
B) 14.6
C) 17.0
D) 17.9
E) Mean cannot be estimated.
i.e., litres per 100 km.
What is the arithmetic mean in litres per 100 km?
A) 16.9
B) 14.6
C) 17.0
D) 17.9
E) Mean cannot be estimated.
Question
Question
Listed below is the average earnings ratio by sex for full-year, full-time workers from 1999 to 2008.
(Source: Adapted from Statistics Canada-see Connect for data file.)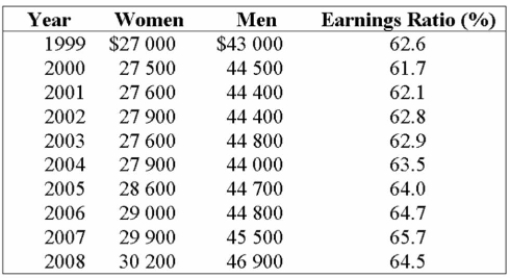
What were the median earnings for men for the years 1999-2008?
A) $43,000
B) $44,400
C) $44,500
D) $44,600
E) $44,700
(Source: Adapted from Statistics Canada-see Connect for data file.)
What were the median earnings for men for the years 1999-2008?
A) $43,000
B) $44,400
C) $44,500
D) $44,600
E) $44,700
Question
Question
Question
Question
Question
Question
Question
Question
Question
Listed below is the average earnings ratio by sex for full-year, full-time workers from 1999 to 2008.
(Source: Adapted from Statistics Canada-see Connect for data file.)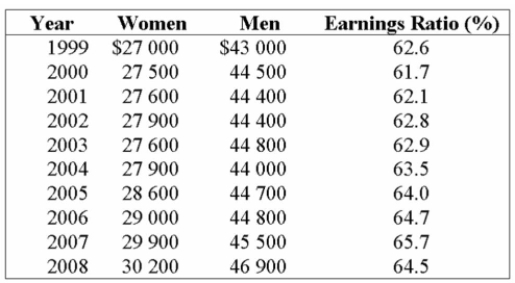
What are the mean earnings for women for the years 1999-2008?
A) $27,000
B) $27,600
C) $27,900
D) $28,320
E) $28,600
(Source: Adapted from Statistics Canada-see Connect for data file.)
What are the mean earnings for women for the years 1999-2008?
A) $27,000
B) $27,600
C) $27,900
D) $28,320
E) $28,600
Question
Question
Listed below is the average earnings ratio by sex for full-year, full-time workers from 1999 to 2008.
(Source: Adapted from Statistics Canada-see Connect for data file.)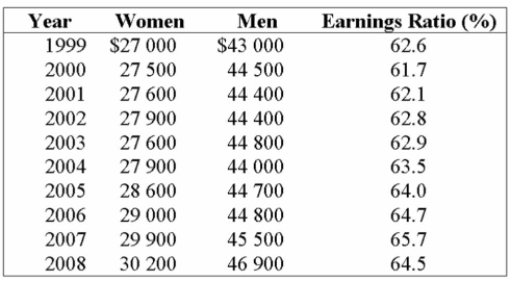
What were the modal earnings for women for the years 1999-2008?
A) $27,000
B) $27,600
C) $27,900
D) $28,320
E) $28,600
(Source: Adapted from Statistics Canada-see Connect for data file.)
What were the modal earnings for women for the years 1999-2008?
A) $27,000
B) $27,600
C) $27,900
D) $28,320
E) $28,600
Question
Question
Question
Question
Question
Listed below is the average earnings ratio by sex for full-year, full-time workers from 1999 to 2008.
(Source: Adapted from Statistics Canada-see Connect for data file.)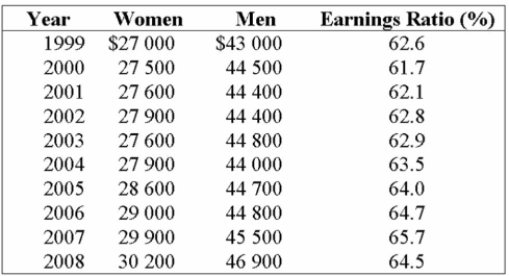
What are the median earnings for women for the years 1999-2008?
A) $27,000
B) $27,600
C) $27,900
D) $28,320
E) $28,600
(Source: Adapted from Statistics Canada-see Connect for data file.)
What are the median earnings for women for the years 1999-2008?
A) $27,000
B) $27,600
C) $27,900
D) $28,320
E) $28,600
Question
Question
Listed below is the average earnings ratio by sex for full-year, full-time workers from 1999 to 2008.
(Source: Adapted from Statistics Canada-see Connect for data file.)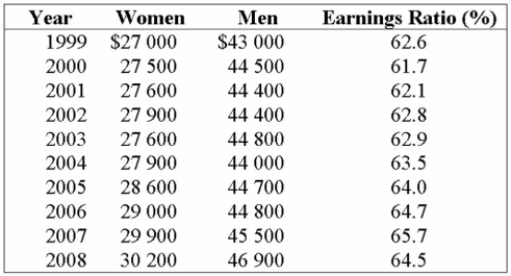
What were the mean earnings for men for the years 1999-2008?
A) $43,000
B) $44,400
C) $44,500
D) $44,600
E) $44,700
(Source: Adapted from Statistics Canada-see Connect for data file.)
What were the mean earnings for men for the years 1999-2008?
A) $43,000
B) $44,400
C) $44,500
D) $44,600
E) $44,700
Question
Referring to the histogram below, choose the best term to describe its shape. 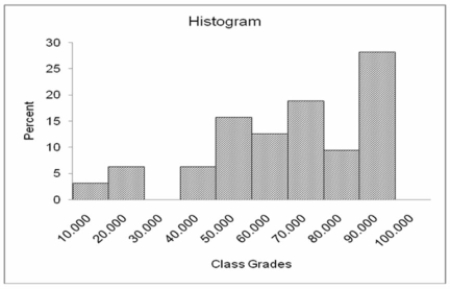
A) Positively skewed
B) Negatively skewed
C) Perfectly symmetrical
D) Statistical
A) Positively skewed
B) Negatively skewed
C) Perfectly symmetrical
D) Statistical
Question
Question
Question
Question
Question
Question
Question
Question
Question
Question
Question
Question
Question
Question
Question
Question
Referring to the printout below, describe the shape of the distribution of the corresponding
Histogram.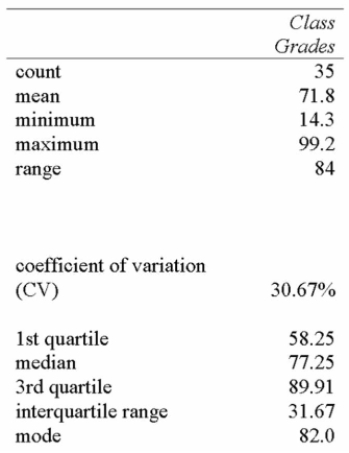
A) Positively skewed
B) Negatively skewed
C) Perfectly symmetrical
D) Statistical
Histogram.
A) Positively skewed
B) Negatively skewed
C) Perfectly symmetrical
D) Statistical
Question
Question
Question
Listed below is the average earnings ratio by sex for full-year, full-time workers from 1999 to 2008.
(Source: Adapted from Statistics Canada-see Connect for data file.)
What were the modal earnings for men for the years 1999-2008?
A) $43,000
B) $44,400
C) $44,500
D) $44,600
E) $44,700
(Source: Adapted from Statistics Canada-see Connect for data file.)
What were the modal earnings for men for the years 1999-2008?
A) $43,000
B) $44,400
C) $44,500
D) $44,600
E) $44,700
Question
Question
Question
Question
Question
Question
Question
Question
The following printout is a summary of housing prices in Edmonton: 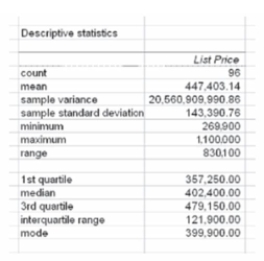 What can we determine from this printout?
A) The mean list price is less than both the median and modal prices
B) The median list price is the most representative as it is larger than the modal price and smaller than the mean price.
C) The modal price is affected by a few houses that must be priced very high
D) More than half of the houses are listed above $425,000.
What can we determine from this printout?A) The mean list price is less than both the median and modal prices
B) The median list price is the most representative as it is larger than the modal price and smaller than the mean price.
C) The modal price is affected by a few houses that must be priced very high
D) More than half of the houses are listed above $425,000.
Question
Question
The following printout is a summary of number of bedrooms in homes for sale in Regina: 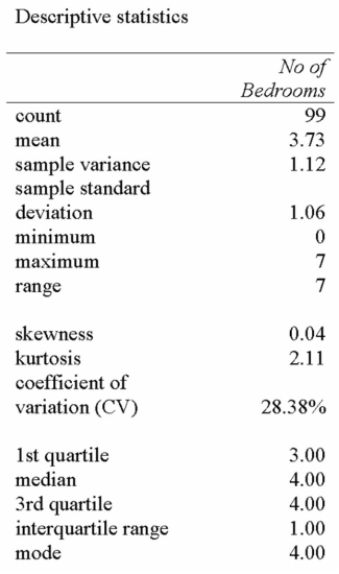 What can we determine from this printout?
A) The mean number of bedrooms is less than both the median and modal number.
B) The median number of bedrooms is the most representative as it is larger than the modal number and smaller than the mean number of bedrooms.
C) The modal number of bedrooms is affected by a few houses that must have a large number of bedrooms.
D) 75% of the houses have more than 3 bedrooms.
What can we determine from this printout?A) The mean number of bedrooms is less than both the median and modal number.
B) The median number of bedrooms is the most representative as it is larger than the modal number and smaller than the mean number of bedrooms.
C) The modal number of bedrooms is affected by a few houses that must have a large number of bedrooms.
D) 75% of the houses have more than 3 bedrooms.
Question
Based on the graph below, how can we best describe the shape of this distribution? 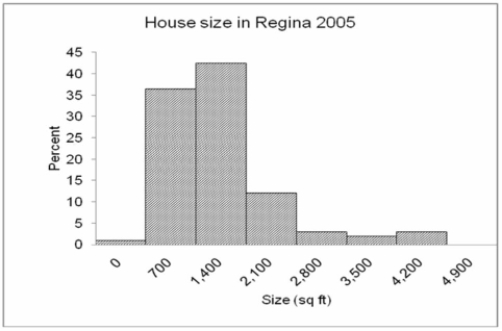
A) Symmetrical
B) Positively skewed
C) Negatively skewed
D) No variation
E) Bimodal
A) Symmetrical
B) Positively skewed
C) Negatively skewed
D) No variation
E) Bimodal
Question
Question
Question
Question
Question
Based on the graph below, how can we best describe the shape of this distribution? 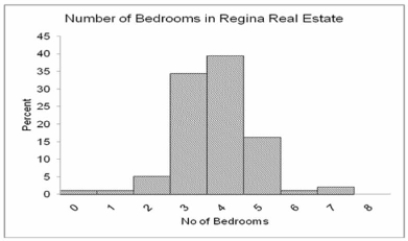
A) Relatively symmetrical
B) Positively skewed
C) Negatively skewed
D) No variation
E) Bimodal
A) Relatively symmetrical
B) Positively skewed
C) Negatively skewed
D) No variation
E) Bimodal
Question
Question
Based on the graph below, how can we best describe the shape of this distribution? 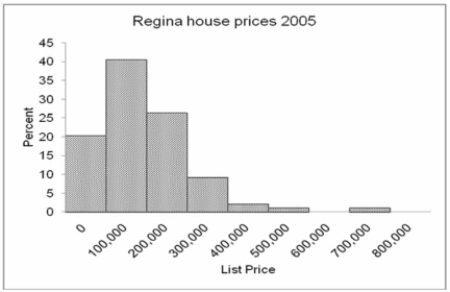
A) Relatively symmetrical
B) Positively skewed
C) Negatively skewed
D) No variation
E) Bimodal
A) Relatively symmetrical
B) Positively skewed
C) Negatively skewed
D) No variation
E) Bimodal
Question
The ages of a sample of telephones used in a small town hotel were organized into the following
Table: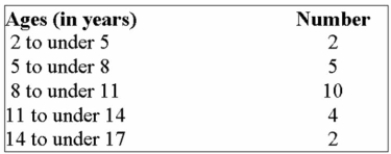
What is the sample variance?
A) About 10.2
B) About 6.1
C) About 14.0
D) About 3.2
E) About 5.0
Table:
What is the sample variance?
A) About 10.2
B) About 6.1
C) About 14.0
D) About 3.2
E) About 5.0
Question

Unlock Deck
Sign up to unlock the cards in this deck!
Unlock Deck
Unlock Deck
1/214
Play
Full screen (f)
Deck 3: Describing Data: Numerical Measures
1
Using the information gathered for real estate prices in Regina and surrounding areas in the early
2000's, determine the standard deviation of the selling prices at that time.
A) $88,330
B) $20,000
C) $25,000
D) $78,350
E) $88,939
2000's, determine the standard deviation of the selling prices at that time.
A) $88,330
B) $20,000
C) $25,000
D) $78,350
E) $88,939
$88,939
2
Using the information gathered for real estate prices in Regina and surrounding areas in the early
2000's, determine the mean of the selling prices at that time.
A) $188,330
B) $200,000
C) $125,000
D) $178,350
E) $195,600
2000's, determine the mean of the selling prices at that time.
A) $188,330
B) $200,000
C) $125,000
D) $178,350
E) $195,600
$188,330
3
Production of passenger cars in Japan increased from 3.94 million in 1990 to 6.74 million in 2000.
What is the geometric mean annual percent increase?
A) 4.0
B) 1.9
C) 5.5
D) 16.6
E) 47.3
What is the geometric mean annual percent increase?
A) 4.0
B) 1.9
C) 5.5
D) 16.6
E) 47.3
5.5
4
The Federal Aviation Administration reported that passenger revenues on international flights
Increased from $528 million in 1977 to $5,100 million in 2000. What is the geometric mean annual
Percent increase in international passenger revenues?
A) 10.4
B) 27.9
C) 103.6
D) 9.96
E) None of the choices are correct.
Increased from $528 million in 1977 to $5,100 million in 2000. What is the geometric mean annual
Percent increase in international passenger revenues?
A) 10.4
B) 27.9
C) 103.6
D) 9.96
E) None of the choices are correct.
Unlock Deck
Unlock for access to all 214 flashcards in this deck.
Unlock Deck
k this deck
5
A sample of the paramedical fees charged by clinics revealed these amounts: $55, $49, $50, $45,
$52 and $55. What is the median charge?
A) $47.50
B) $51.00
C) $52.00
D) $55.00
E) $48.00
$52 and $55. What is the median charge?
A) $47.50
B) $51.00
C) $52.00
D) $55.00
E) $48.00
Unlock Deck
Unlock for access to all 214 flashcards in this deck.
Unlock Deck
k this deck
6
A sample of single persons receiving social security payments revealed these monthly benefits:
$826, $699, $1,087, $880, $839 and $965. How many observations are below the median?
A) 0
B) 1
C) 2
D) 3
$826, $699, $1,087, $880, $839 and $965. How many observations are below the median?
A) 0
B) 1
C) 2
D) 3
Unlock Deck
Unlock for access to all 214 flashcards in this deck.
Unlock Deck
k this deck
7
A sample of the daily production of transceivers was organized into the following distribution. What is the mean daily production?
A) 86.4
B) 101.4
C) 111.4
D) 106.4
E) 20.0
What is the mean daily production?A) 86.4
B) 101.4
C) 111.4
D) 106.4
E) 20.0
Unlock Deck
Unlock for access to all 214 flashcards in this deck.
Unlock Deck
k this deck
8
A bottling company offers three kinds of delivery service - instant, same day and within five days.
The profit per delivery varies according to the kind of delivery. The profit for an instant delivery is
Less than the other kinds because the driver has to go directly to a grocery store with a small load
And return to the bottling plant. To find out what effect each type of delivery has on the profit
Picture, the company has made the following tabulation based on deliveries for the previous
Quarter.
What is the weighted mean profit per delivery?
A) $72
B) $100
C) $142
D) $97
E) $99
The profit per delivery varies according to the kind of delivery. The profit for an instant delivery is
Less than the other kinds because the driver has to go directly to a grocery store with a small load
And return to the bottling plant. To find out what effect each type of delivery has on the profit
Picture, the company has made the following tabulation based on deliveries for the previous
Quarter.
What is the weighted mean profit per delivery?
A) $72
B) $100
C) $142
D) $97
E) $99
Unlock Deck
Unlock for access to all 214 flashcards in this deck.
Unlock Deck
k this deck
9
i. A value that is typical or representative of the data is referred to as a measure of central tendency.
ii. The arithmetic mean is the sum of the observations divided by the total number of observations
iii. The value of the observation in the center after they have been arranged in numerical order is
Called the weighted mean
A) (i), (ii), and (iii) are all correct statements
B) (i) and, (ii) are correct statements but not (iii).
C) (i) and (iii) are correct statements but not (ii).
D) (ii) and (iii) are correct statements but not (i).
E) (i), (ii), and (iii) are all false statements.
Unlock Deck
Unlock for access to all 214 flashcards in this deck.
Unlock Deck
k this deck
10
The lengths of time (in minutes) several underwriters took to review applications for similar
Insurance coverage are: 50, 230, 52 and 57. What is the median length of time required to review
An application?
A) 54.5
B) 141.0
C) 97.25
D) 109.0
E) $$55.40
Insurance coverage are: 50, 230, 52 and 57. What is the median length of time required to review
An application?
A) 54.5
B) 141.0
C) 97.25
D) 109.0
E) $$55.40
Unlock Deck
Unlock for access to all 214 flashcards in this deck.
Unlock Deck
k this deck
11
The Investment Company Institute reported in its Mutual Fund Fact Book that the number of mutual
Funds increased from 410 in 1990 to 857 in 2000. What is the geometric mean annual percent
Increase in the number of funds?
A) 1.12
B) 7.65
C) 19.41
D) 48.66
Funds increased from 410 in 1990 to 857 in 2000. What is the geometric mean annual percent
Increase in the number of funds?
A) 1.12
B) 7.65
C) 19.41
D) 48.66
Unlock Deck
Unlock for access to all 214 flashcards in this deck.
Unlock Deck
k this deck
12
A stockbroker placed the following order for a customer:
-50 shares of Kaiser Aluminum preferred at $104 a share
-100 shares of GTE preferred at $25 1/4 a share
-20 shares of Boston Edison preferred at $9 1/8 a share
What is the weighted arithmetic mean price per share?
A) $25.25
B) $79.75
C) $103.50
D) $42.75
E) Weighted mean cannot be computed for this data set.
Unlock Deck
Unlock for access to all 214 flashcards in this deck.
Unlock Deck
k this deck
13
The net sales of a sample of small stamping plants were organized into the following percent
Frequency distribution.
What is the mean net sales (in $millions)?
A) $7.09
B) $10.09
C) $8.59
D) $8.34
E) Mean cannot be computed
Frequency distribution.
What is the mean net sales (in $millions)?
A) $7.09
B) $10.09
C) $8.59
D) $8.34
E) Mean cannot be computed
Unlock Deck
Unlock for access to all 214 flashcards in this deck.
Unlock Deck
k this deck
14
Using the information gathered for real estate prices in Regina and surrounding areas in the early
2000's, determine the median of the selling prices at that time.
A) $188,330
B) $200,000
C) $125,000
D) $175,000
E) $195,600
2000's, determine the median of the selling prices at that time.
A) $188,330
B) $200,000
C) $125,000
D) $175,000
E) $195,600
Unlock Deck
Unlock for access to all 214 flashcards in this deck.
Unlock Deck
k this deck
15
The number of work stoppages in a highly industrialized region for selected months are: 6, 0, 10, 14,
8 and 0. What is the median number of stoppages?
A) 0
B) 6
C) 7
D) 8
8 and 0. What is the median number of stoppages?
A) 0
B) 6
C) 7
D) 8
Unlock Deck
Unlock for access to all 214 flashcards in this deck.
Unlock Deck
k this deck
16
Assume a student received the following grades for the semester: History, B; Statistics, A; Spanish,C. History and English are 5 credit hour courses, Statistics a 4 credit hour course and Spanish a 3 credit hour course. If 4 grade points are assigned for an A, 3 for a B and 2 for a C, what is the weighted mean for the semester grades?
A) 4.00
B) 1.96
C) 2.76
D) 3.01
E) 2.88
A) 4.00
B) 1.96
C) 2.76
D) 3.01
E) 2.88
Unlock Deck
Unlock for access to all 214 flashcards in this deck.
Unlock Deck
k this deck
17
The U.S. Department of Education reported that for the past six years 23, 19, 15, 30, 27 and 25
Women received doctorate degrees in computer and information sciences. What is the mean
Arithmetic annual number of women receiving this degree?
A) 15.1
B) 23.2
C) 37.9
D) 22.9
E) $22.3
Women received doctorate degrees in computer and information sciences. What is the mean
Arithmetic annual number of women receiving this degree?
A) 15.1
B) 23.2
C) 37.9
D) 22.9
E) $22.3
Unlock Deck
Unlock for access to all 214 flashcards in this deck.
Unlock Deck
k this deck
18
During the past six months, the purchasing agent bought: What is the weighted arithmetic mean price per ton?
A) $87.25
B) $72.33
C) $68.47
D) $89.18
E) Weighted mean cannot be computed for this data set.
What is the weighted arithmetic mean price per ton?A) $87.25
B) $72.33
C) $68.47
D) $89.18
E) Weighted mean cannot be computed for this data set.
Unlock Deck
Unlock for access to all 214 flashcards in this deck.
Unlock Deck
k this deck
19
The ages of newly hired, unskilled employees were grouped into the following distribution: What is the median age?
A) 28.50
B) 28.08
C) 25.08
D) 27.14
E) 20.00
What is the median age?A) 28.50
B) 28.08
C) 25.08
D) 27.14
E) 20.00
Unlock Deck
Unlock for access to all 214 flashcards in this deck.
Unlock Deck
k this deck
20
A sample of light trucks using diesel fuel revealed the following distribution based on fuel efficiency,
i.e., litres per 100 km.
What is the arithmetic mean in litres per 100 km?
A) 16.9
B) 14.6
C) 17.0
D) 17.9
E) Mean cannot be estimated.
i.e., litres per 100 km.
What is the arithmetic mean in litres per 100 km?
A) 16.9
B) 14.6
C) 17.0
D) 17.9
E) Mean cannot be estimated.
Unlock Deck
Unlock for access to all 214 flashcards in this deck.
Unlock Deck
k this deck
21
On a survey questionnaire, students were asked to indicate their class rank in college. If there were
Only four choices from which to choose, which measure(s) of central tendency would be appropriate
To use for the data generated by that questionnaire item?
A) Mean and median
B) Mean and mode
C) Mode and median
D) Mode only
E) Median only
Only four choices from which to choose, which measure(s) of central tendency would be appropriate
To use for the data generated by that questionnaire item?
A) Mean and median
B) Mean and mode
C) Mode and median
D) Mode only
E) Median only
Unlock Deck
Unlock for access to all 214 flashcards in this deck.
Unlock Deck
k this deck
22
Listed below is the average earnings ratio by sex for full-year, full-time workers from 1999 to 2008.
(Source: Adapted from Statistics Canada-see Connect for data file.)
What were the median earnings for men for the years 1999-2008?
A) $43,000
B) $44,400
C) $44,500
D) $44,600
E) $44,700
(Source: Adapted from Statistics Canada-see Connect for data file.)
What were the median earnings for men for the years 1999-2008?
A) $43,000
B) $44,400
C) $44,500
D) $44,600
E) $44,700
Unlock Deck
Unlock for access to all 214 flashcards in this deck.
Unlock Deck
k this deck
23
Fifteen accounting majors had an average grade of 90 on a finance exam. Seven marketing majors
Averaged 85, while ten finance majors averaged 93 on the same exam. What is the weighted mean
For the 32 students taking the exam?
A) 89.84
B) 89.33
C) 89.48
D) Impossible to determine without more information
E) $89.88
Averaged 85, while ten finance majors averaged 93 on the same exam. What is the weighted mean
For the 32 students taking the exam?
A) 89.84
B) 89.33
C) 89.48
D) Impossible to determine without more information
E) $89.88
Unlock Deck
Unlock for access to all 214 flashcards in this deck.
Unlock Deck
k this deck
24
The number of students at a local university increased from 2,500 students 5000 students in 10
Years. Based on a geometric mean, the university grew at an average percentage rate of
A) 2,500 students per year
B) 1.071 students per year
C) 7.1 percent per year
D) 250 students per year
E) Cannot be determined
Years. Based on a geometric mean, the university grew at an average percentage rate of
A) 2,500 students per year
B) 1.071 students per year
C) 7.1 percent per year
D) 250 students per year
E) Cannot be determined
Unlock Deck
Unlock for access to all 214 flashcards in this deck.
Unlock Deck
k this deck
25
The U.S. Department of Education reported that for the past seven years 4,033, 5,652, 6,407, 7,201,
8,719, 11,154, and 15,121 people received bachelor's degrees in computer and information sciences.
What is the arithmetic mean annual number receiving this degree?
A) About 12,240
B) About 8,327
C) About 6,217
D) About 15,962
E) About 8,399
8,719, 11,154, and 15,121 people received bachelor's degrees in computer and information sciences.
What is the arithmetic mean annual number receiving this degree?
A) About 12,240
B) About 8,327
C) About 6,217
D) About 15,962
E) About 8,399
Unlock Deck
Unlock for access to all 214 flashcards in this deck.
Unlock Deck
k this deck
26
Which measure of central tendency is found by arranging the data from low to high, and selecting
The middle value?
A) Arithmetic mean
B) Median
C) Mode
D) Geometric mean
The middle value?
A) Arithmetic mean
B) Median
C) Mode
D) Geometric mean
Unlock Deck
Unlock for access to all 214 flashcards in this deck.
Unlock Deck
k this deck
27
A question in a market survey asks for a respondent's favourite car colour. Which measure of central
Tendency should be used to summarize this question?
A) Mode
B) Median
C) Mean
D) Geometric mean
E) Weighted mean
Tendency should be used to summarize this question?
A) Mode
B) Median
C) Mean
D) Geometric mean
E) Weighted mean
Unlock Deck
Unlock for access to all 214 flashcards in this deck.
Unlock Deck
k this deck
28
i. A parameter is a measurable characteristic of a sample.
ii. The weighted mean is the nth root of n observations.
iii. A statistic is a measurable characteristic of the population.
A) (i), (ii) and (iii) are all correct statements
B) (i) and, (ii) are correct statements but not (iii).
C) (i) and, (iii) are correct statements but not (ii).
D) (ii) and, (iii) are correct statements but not (i).
E) (i), (ii) and (iii) are all false statements.
Unlock Deck
Unlock for access to all 214 flashcards in this deck.
Unlock Deck
k this deck
29
AAA Heating and Air Conditioning completed 30 jobs last month with a mean revenue of $5,430
Per job. The president wants to know the total revenue for the month.
A) Insufficient information to estimate.
B) $5,430
C) $54,330
D) $162,900
E) $169,200
Per job. The president wants to know the total revenue for the month.
A) Insufficient information to estimate.
B) $5,430
C) $54,330
D) $162,900
E) $169,200
Unlock Deck
Unlock for access to all 214 flashcards in this deck.
Unlock Deck
k this deck
30
Which measure of central tendency is used to determine the average annual percent increase?
A) Arithmetic mean
B) Weighted mean
C) Mode
D) Geometric mean
E) Median
A) Arithmetic mean
B) Weighted mean
C) Mode
D) Geometric mean
E) Median
Unlock Deck
Unlock for access to all 214 flashcards in this deck.
Unlock Deck
k this deck
31
Listed below is the average earnings ratio by sex for full-year, full-time workers from 1999 to 2008.
(Source: Adapted from Statistics Canada-see Connect for data file.)
What are the mean earnings for women for the years 1999-2008?
A) $27,000
B) $27,600
C) $27,900
D) $28,320
E) $28,600
(Source: Adapted from Statistics Canada-see Connect for data file.)
What are the mean earnings for women for the years 1999-2008?
A) $27,000
B) $27,600
C) $27,900
D) $28,320
E) $28,600
Unlock Deck
Unlock for access to all 214 flashcards in this deck.
Unlock Deck
k this deck
32
For which measure of central tendency will the sum of the deviations of each value from that
Average always be zero?
A) Mode
B) Mean
C) Median
D) Geometric mean
E) The sum of the deviations of each value from that average will always be zero for all measures of central tendency.
Average always be zero?
A) Mode
B) Mean
C) Median
D) Geometric mean
E) The sum of the deviations of each value from that average will always be zero for all measures of central tendency.
Unlock Deck
Unlock for access to all 214 flashcards in this deck.
Unlock Deck
k this deck
33
Listed below is the average earnings ratio by sex for full-year, full-time workers from 1999 to 2008.
(Source: Adapted from Statistics Canada-see Connect for data file.)
What were the modal earnings for women for the years 1999-2008?
A) $27,000
B) $27,600
C) $27,900
D) $28,320
E) $28,600
(Source: Adapted from Statistics Canada-see Connect for data file.)
What were the modal earnings for women for the years 1999-2008?
A) $27,000
B) $27,600
C) $27,900
D) $28,320
E) $28,600
Unlock Deck
Unlock for access to all 214 flashcards in this deck.
Unlock Deck
k this deck
34
What is the median of 26, 30, 24, 32, 32, 31, 27 and 29?
A) 32
B) 29
C) 30
D) 29.5
E) 30.5
A) 32
B) 29
C) 30
D) 29.5
E) 30.5
Unlock Deck
Unlock for access to all 214 flashcards in this deck.
Unlock Deck
k this deck
35
The net incomes (in $millions) of a sample of steel fabricators are: $86, $67, $86 and $85. What is
The modal net income?
A) $67
B) $85
C) $85.5
D) $86
E) $84
The modal net income?
A) $67
B) $85
C) $85.5
D) $86
E) $84
Unlock Deck
Unlock for access to all 214 flashcards in this deck.
Unlock Deck
k this deck
36
If there are an odd number of observations in a set of ungrouped data that have been arrayed from
Low to high or vice versa, where is the median located?
A) n
B) n/2
C) (n + 1)/2
D) n + 1/2
Low to high or vice versa, where is the median located?
A) n
B) n/2
C) (n + 1)/2
D) n + 1/2
Unlock Deck
Unlock for access to all 214 flashcards in this deck.
Unlock Deck
k this deck
37
Which one of the following is referred to as the population mean?
A) Statistic
B) µ
C) Sample
D) ∑
A) Statistic
B) µ
C) Sample
D) ∑
Unlock Deck
Unlock for access to all 214 flashcards in this deck.
Unlock Deck
k this deck
38
Listed below is the average earnings ratio by sex for full-year, full-time workers from 1999 to 2008.
(Source: Adapted from Statistics Canada-see Connect for data file.)
What are the median earnings for women for the years 1999-2008?
A) $27,000
B) $27,600
C) $27,900
D) $28,320
E) $28,600
(Source: Adapted from Statistics Canada-see Connect for data file.)
What are the median earnings for women for the years 1999-2008?
A) $27,000
B) $27,600
C) $27,900
D) $28,320
E) $28,600
Unlock Deck
Unlock for access to all 214 flashcards in this deck.
Unlock Deck
k this deck
39
Three persons earn $8 an hour, six earn $9 an hour, and one earns $12 an hour. Find the weighted
Mean hourly wage.
A) $8
B) $9
C) $12
D) $6
E) $10
Mean hourly wage.
A) $8
B) $9
C) $12
D) $6
E) $10
Unlock Deck
Unlock for access to all 214 flashcards in this deck.
Unlock Deck
k this deck
40
Listed below is the average earnings ratio by sex for full-year, full-time workers from 1999 to 2008.
(Source: Adapted from Statistics Canada-see Connect for data file.)
What were the mean earnings for men for the years 1999-2008?
A) $43,000
B) $44,400
C) $44,500
D) $44,600
E) $44,700
(Source: Adapted from Statistics Canada-see Connect for data file.)
What were the mean earnings for men for the years 1999-2008?
A) $43,000
B) $44,400
C) $44,500
D) $44,600
E) $44,700
Unlock Deck
Unlock for access to all 214 flashcards in this deck.
Unlock Deck
k this deck
41
Referring to the histogram below, choose the best term to describe its shape.
A) Positively skewed
B) Negatively skewed
C) Perfectly symmetrical
D) Statistical
A) Positively skewed
B) Negatively skewed
C) Perfectly symmetrical
D) Statistical
Unlock Deck
Unlock for access to all 214 flashcards in this deck.
Unlock Deck
k this deck
42
Which measures of central tendency always have but one value for a set of grouped or ungrouped
Data?
A) Mode and median
B) Mode and mean
C) Mode and geometric mean
D) Mean and median
E) Mean, median and geometric mean
Data?
A) Mode and median
B) Mode and mean
C) Mode and geometric mean
D) Mean and median
E) Mean, median and geometric mean
Unlock Deck
Unlock for access to all 214 flashcards in this deck.
Unlock Deck
k this deck
43
In the calculation of the arithmetic mean for grouped data, which value is used to represent all the
Values in a particular class?
A) The upper limit of the class
B) The lower limit of the class
C) The frequency of the class
D) The cumulative frequency preceding the class
E) The midpoint of the class
Values in a particular class?
A) The upper limit of the class
B) The lower limit of the class
C) The frequency of the class
D) The cumulative frequency preceding the class
E) The midpoint of the class
Unlock Deck
Unlock for access to all 214 flashcards in this deck.
Unlock Deck
k this deck
44
A disadvantage of using an arithmetic mean to summarize a set of data is
A) The arithmetic mean sometimes has two values.
B) It can be used for interval and ratio data
C) It is always different from the median.
D) It can be biased by one or two extremely small or large values.
E) It doesn't always exist.
A) The arithmetic mean sometimes has two values.
B) It can be used for interval and ratio data
C) It is always different from the median.
D) It can be biased by one or two extremely small or large values.
E) It doesn't always exist.
Unlock Deck
Unlock for access to all 214 flashcards in this deck.
Unlock Deck
k this deck
45
i. For salaries of $102,000, $98,000, $35,000, $106,000 and $101,000, the arithmetic mean would
Be an appropriate average.
ii. Extremely high or low scores do not affect the value of the median.
iii. Three persons earn $8 an hour, six earn $9 an hour, and one earns $12 an hour. The weighted
Mean hourly wage is $9.
A) (i), (ii) and (iii) are all correct statements
B) (i) and, (ii) are correct statements but not (iii).
C) (i) and, (iii) are correct statements but not (ii).
D) (ii) and, (iii) are correct statements but not (i).
E) (i), (ii) and (iii) are all false statements.
Unlock Deck
Unlock for access to all 214 flashcards in this deck.
Unlock Deck
k this deck
46
i. For salaries of $102,000, $98,000, $25,000, $106,000 and $101,000, the median would be an
Appropriate average.
ii. There are always as many values above the mean as below it.
iii. Three persons earn $8 an hour, six earn $9 an hour, and one earns $12 an hour. The weighted
Mean hourly wage is $9.
A) (i), (ii) and (iii) are all correct statements.
B) (i) and, (ii) are correct statements but not (iii).
C) (i) and, (iii) are correct statements but not (ii).
D) (ii) and, (iii) are correct statements but not (i).
E) (i), (ii) and (iii) are all false statements.
Unlock Deck
Unlock for access to all 214 flashcards in this deck.
Unlock Deck
k this deck
47
The mean, as a measure of central location would be inappropriate for which one of the following?
A) Ages of adults at a senior citizen center
B) Incomes of lawyers
C) Number of pages in textbooks on statistics
D) Marital status of college students at a particular university
A) Ages of adults at a senior citizen center
B) Incomes of lawyers
C) Number of pages in textbooks on statistics
D) Marital status of college students at a particular university
Unlock Deck
Unlock for access to all 214 flashcards in this deck.
Unlock Deck
k this deck
48
The mean, as a measure of central tendency, would be inappropriate for which one of the
Following?
A) Ages of adults at a senior citizen center
B) Incomes of lawyers
C) Number of pages in textbooks on statistics
D) Marital status of college students at a particular university
E) Number of family pets
Following?
A) Ages of adults at a senior citizen center
B) Incomes of lawyers
C) Number of pages in textbooks on statistics
D) Marital status of college students at a particular university
E) Number of family pets
Unlock Deck
Unlock for access to all 214 flashcards in this deck.
Unlock Deck
k this deck
49
i. If there is an even number of ungrouped values, then half of the values will be less than the
Median.
ii. Extremely high or low scores affect the value of the median.
iii. There are always as many values above the mean as below it.
A) (i), (ii) and (iii) are all correct statements.
B) (i) and, (ii) are correct statements but not (iii).
C) (i) and, (iii) are correct statements but not (ii).
D) (i) is a correct statement, but not (ii) or (iii).
E) (i), (ii) and (iii) are all false statements.
Unlock Deck
Unlock for access to all 214 flashcards in this deck.
Unlock Deck
k this deck
50
If a major sports star were to move into your neighbourhood, what would you expect to happen to
The neighbourhood's "average" income?
A) The mean income would increase significantly
B) The median income would increase significantly
C) The modal income would increase significantly
D) The mean income would increase significantly, but the modal income and median income would decrease
E) The standard deviation of the neighbourhood's income would get smaller
Unlock Deck
Unlock for access to all 214 flashcards in this deck.
Unlock Deck
k this deck
51
Sometimes, data has two values that have the highest and equal frequencies. In this case, the
Distribution of the data can best be summarized as
A) symmetric
B) bimodal (having two modes)
C) positively skewed
D) negatively skewed
E) continuous
Distribution of the data can best be summarized as
A) symmetric
B) bimodal (having two modes)
C) positively skewed
D) negatively skewed
E) continuous
Unlock Deck
Unlock for access to all 214 flashcards in this deck.
Unlock Deck
k this deck
52
If a frequency distribution has open-ended intervals at the extremes, which measure of central
Tendency is the most difficult to estimate?
A) Median
B) Mode
C) Mean
D) Mean, Median and Mode
Tendency is the most difficult to estimate?
A) Median
B) Mode
C) Mean
D) Mean, Median and Mode
Unlock Deck
Unlock for access to all 214 flashcards in this deck.
Unlock Deck
k this deck
53
What are half of the observations always greater than?
A) Median
B) Mode
C) Mean
D) Geometric mean
E) Weighted mean
A) Median
B) Mode
C) Mean
D) Geometric mean
E) Weighted mean
Unlock Deck
Unlock for access to all 214 flashcards in this deck.
Unlock Deck
k this deck
54
Which measures of central tendency are not affected by extremely low or extremely high values?
A) Mean and median
B) Mean and mode
C) Mode and median
D) Geometric mean and mean
E) Mean only
A) Mean and median
B) Mean and mode
C) Mode and median
D) Geometric mean and mean
E) Mean only
Unlock Deck
Unlock for access to all 214 flashcards in this deck.
Unlock Deck
k this deck
55
A disadvantage of using an arithmetic mean to summarize a set of data is
A) It can be used for ratio data.
B) It is always different from the median.
C) It can be biased by one or two extremely small or large values.
D) The arithmetic mean sometimes has two values.
A) It can be used for ratio data.
B) It is always different from the median.
C) It can be biased by one or two extremely small or large values.
D) The arithmetic mean sometimes has two values.
Unlock Deck
Unlock for access to all 214 flashcards in this deck.
Unlock Deck
k this deck
56
i. If there is an even number of ungrouped values, then half of the values will be less than the
Median.
ii. Extremely high or low scores do not affect the value of the median.
iii. There are always as many values above the mean as below it.
A) (i), (ii) and (iii) are all correct statements
B) (i) and, (ii) are correct statements but not (iii).
C) (i) and, (iii) are correct statements but not (ii).
D) (i) is a correct statement, but not (ii) or (iii).
E) (i), (ii) and (iii) are all false statements.
Unlock Deck
Unlock for access to all 214 flashcards in this deck.
Unlock Deck
k this deck
57
Referring to the printout below, describe the shape of the distribution of the corresponding
Histogram.
A) Positively skewed
B) Negatively skewed
C) Perfectly symmetrical
D) Statistical
Histogram.
A) Positively skewed
B) Negatively skewed
C) Perfectly symmetrical
D) Statistical
Unlock Deck
Unlock for access to all 214 flashcards in this deck.
Unlock Deck
k this deck
58
What must be the least scale of measurement for the median?
A) Nominal
B) Ordinal
C) Interval
D) Ratio
A) Nominal
B) Ordinal
C) Interval
D) Ratio
Unlock Deck
Unlock for access to all 214 flashcards in this deck.
Unlock Deck
k this deck
59
i. For salaries of $102,000, $98,000, $25,000, $106,000 and $101,000, the arithmetic mean would
Be an appropriate average.
ii. Extremely high or low scores affect the value of the median.
iii. Three persons earn $8 an hour, six earn $9 an hour, and one earns $12 an hour. The weighted
Mean hourly wage is $10.
A) (i), (ii) and (iii) are all correct statements
B) (i) and, (ii) are correct statements but not (iii).
C) (i) and, (iii) are correct statements but not (ii).
D) (ii) and, (iii) are correct statements but not (i).
E) (i), (ii) and (iii) are all false statements.
Unlock Deck
Unlock for access to all 214 flashcards in this deck.
Unlock Deck
k this deck
60
Listed below is the average earnings ratio by sex for full-year, full-time workers from 1999 to 2008.
(Source: Adapted from Statistics Canada-see Connect for data file.)
What were the modal earnings for men for the years 1999-2008?
A) $43,000
B) $44,400
C) $44,500
D) $44,600
E) $44,700
(Source: Adapted from Statistics Canada-see Connect for data file.)
What were the modal earnings for men for the years 1999-2008?
A) $43,000
B) $44,400
C) $44,500
D) $44,600
E) $44,700
Unlock Deck
Unlock for access to all 214 flashcards in this deck.
Unlock Deck
k this deck
61
What is the relationship among the mean, median and mode in a symmetric distribution?
A) All values are equal
B) Mean is always the smallest value
C) Mean is always the largest value
D) Mode is the largest value
E) Median is always the largest value
A) All values are equal
B) Mean is always the smallest value
C) Mean is always the largest value
D) Mode is the largest value
E) Median is always the largest value
Unlock Deck
Unlock for access to all 214 flashcards in this deck.
Unlock Deck
k this deck
62
A purchasing agent for a trucking company is shopping for replacement tires for their trucks from
Two suppliers. The suppliers' prices are the same. However, Supplier A's tires have an average life of
100,000 kms with a standard deviation of 10,000 kms. Supplier B's tires have an average life of
100,000 kms with a standard deviation of 2,000 kms. Which of the following statements is true?
A) The two distributions of tire life are the same
B) On average, Supplier A's tires have a longer life then Supplier B's tires
C) The life of Supplier B's tire is more predictable than the life of Supplier A's tires
D) The dispersion of Supplier A's tire life is less than the dispersion of Supplier B's tire life
E) The life of Supplier A's tire is more predictable than the life of Supplier B's tires
Unlock Deck
Unlock for access to all 214 flashcards in this deck.
Unlock Deck
k this deck
63
i. In a negatively skewed distribution, the mean is always greater than the median.
ii. In a negatively skewed distribution, the median occurs at the peak of the curve.
iii. In a positively skewed distribution, the mode is greater than the median.
A) (i), (ii) and (iii) are all correct statements
B) (i) and, (ii) are correct statements but not (iii).
C) (i) and, (iii) are correct statements but not (ii).
D) (i) is a correct statement, but not (ii) or (iii).
E) (i), (ii) and (iii) are all false statements.
Unlock Deck
Unlock for access to all 214 flashcards in this deck.
Unlock Deck
k this deck
64
What is the relationship between the variance and the standard deviation?
A) Variance is the square root of the standard deviation
B) Variance is the square of the standard deviation
C) Variance is twice the standard deviation
D) No constant relationship between the variance and the standard deviation
A) Variance is the square root of the standard deviation
B) Variance is the square of the standard deviation
C) Variance is twice the standard deviation
D) No constant relationship between the variance and the standard deviation
Unlock Deck
Unlock for access to all 214 flashcards in this deck.
Unlock Deck
k this deck
65
i. The sum of the deviations from the mean for the set of numbers 4, 9 and 5 will equal zero.
ii. If there is an even number of ungrouped values, the median is found by arranging them from low
To high and then determining the arithmetic mean of the two middle values.
iii. For salaries of $102,000, $98,000, $35,000, $106,000 and $101,000, the arithmetic mean would
Be an appropriate average.
A) (i), (ii) and (iii) are all correct statements.
B) (i) and, (ii) are correct statements but not (iii).
C) (i) and, (iii) are correct statements but not (ii).
D) (ii) and, (iii) are correct statements but not (i).
E) (i), (ii) and (iii) are all false statements.
Unlock Deck
Unlock for access to all 214 flashcards in this deck.
Unlock Deck
k this deck
66
i. In a positively skewed distribution, the mean is always greater than the median.
ii. In a negatively skewed distribution, the median occurs at the peak of the curve.
iii. In a negatively skewed distribution, the mode is greater than the median.
A) (i), (ii) and (iii) are all correct statements
B) (i) and, (ii) are correct statements but not (iii).
C) (i) and, (iii) are correct statements but not (ii).
D) (i) is a correct statement, but not (ii) or (iii).
E) (i), (ii) and (iii) are all false statements.
Unlock Deck
Unlock for access to all 214 flashcards in this deck.
Unlock Deck
k this deck
67
Which of the following measures of dispersion are based on deviations from the mean?
A) Variance
B) Standard deviation
C) Mean deviation
D) Mean deviation, standard deviation, and variance
A) Variance
B) Standard deviation
C) Mean deviation
D) Mean deviation, standard deviation, and variance
Unlock Deck
Unlock for access to all 214 flashcards in this deck.
Unlock Deck
k this deck
68
The following printout is a summary of housing prices in Edmonton: What can we determine from this printout?
A) The mean list price is less than both the median and modal prices
B) The median list price is the most representative as it is larger than the modal price and smaller than the mean price.
C) The modal price is affected by a few houses that must be priced very high
D) More than half of the houses are listed above $425,000.
What can we determine from this printout?A) The mean list price is less than both the median and modal prices
B) The median list price is the most representative as it is larger than the modal price and smaller than the mean price.
C) The modal price is affected by a few houses that must be priced very high
D) More than half of the houses are listed above $425,000.
Unlock Deck
Unlock for access to all 214 flashcards in this deck.
Unlock Deck
k this deck
69
i. In a positively skewed distribution, the mean is always greater than the median.
ii. In a negatively skewed distribution, the mode occurs at the peak of the curve.
iii. In a negatively skewed distribution, the mode is greater than the median.
A) (i), (ii) and (iii) are all correct statements
B) (i) and, (ii) are correct statements but not (iii).
C) (i) and, (iii) are correct statements but not (ii).
D) (i) is a correct statement, but not (ii) or (iii).
E) (i), (ii) and (iii) are all false statements.
Unlock Deck
Unlock for access to all 214 flashcards in this deck.
Unlock Deck
k this deck
70
The following printout is a summary of number of bedrooms in homes for sale in Regina: What can we determine from this printout?
A) The mean number of bedrooms is less than both the median and modal number.
B) The median number of bedrooms is the most representative as it is larger than the modal number and smaller than the mean number of bedrooms.
C) The modal number of bedrooms is affected by a few houses that must have a large number of bedrooms.
D) 75% of the houses have more than 3 bedrooms.
What can we determine from this printout?A) The mean number of bedrooms is less than both the median and modal number.
B) The median number of bedrooms is the most representative as it is larger than the modal number and smaller than the mean number of bedrooms.
C) The modal number of bedrooms is affected by a few houses that must have a large number of bedrooms.
D) 75% of the houses have more than 3 bedrooms.
Unlock Deck
Unlock for access to all 214 flashcards in this deck.
Unlock Deck
k this deck
71
Based on the graph below, how can we best describe the shape of this distribution?
A) Symmetrical
B) Positively skewed
C) Negatively skewed
D) No variation
E) Bimodal
A) Symmetrical
B) Positively skewed
C) Negatively skewed
D) No variation
E) Bimodal
Unlock Deck
Unlock for access to all 214 flashcards in this deck.
Unlock Deck
k this deck
72
i. The mode is the value of the observation that appears most frequently.
ii. A distribution that has the same shape on either side of the center is said to be symmetrical.
iii. Negatively skewed indicates that a distribution is not symmetrical. The long tail is to the left or in
The negative direction.
A) (i), (ii) and (iii) are all correct statements
B) (i) and, (ii) are correct statements but not (iii).
C) (i) and, (iii) are correct statements but not (ii).
D) (ii) and, (iii) are correct statements but not (i).
E) (i), (ii) and (iii) are all false statements.
Unlock Deck
Unlock for access to all 214 flashcards in this deck.
Unlock Deck
k this deck
73
If a major sports star were to move into your neighbourhood, what would you expect to happen to
The neighbourhood's "average" income?
A) The mean income would decrease significantly
B) The median income would increase significantly
C) The modal income would increase significantly
D) The mean income would increase significantly, but the median income would stay almost the same as before
E) The standard deviation of the neighbourhood's income would get smaller
Unlock Deck
Unlock for access to all 214 flashcards in this deck.
Unlock Deck
k this deck
74
What is the range for this sample of March electric bills amounts for all-electric homes of similar
Sizes (to the nearest dollar): $212, $191, $176, $129, $106, $92, $108, $109, $103, $121, $175 and
$194.
A) $100
B) $130
C) $120
D) $112
E) $115
Sizes (to the nearest dollar): $212, $191, $176, $129, $106, $92, $108, $109, $103, $121, $175 and
$194.
A) $100
B) $130
C) $120
D) $112
E) $115
Unlock Deck
Unlock for access to all 214 flashcards in this deck.
Unlock Deck
k this deck
75
Rank the measures of dispersion in terms of their relative computational difficulty from least to most
Difficulty.
A) Mode, median, mean
B) Range, mean deviation, variance
C) Variance, mean deviation, range
D) There is no difference
Difficulty.
A) Mode, median, mean
B) Range, mean deviation, variance
C) Variance, mean deviation, range
D) There is no difference
Unlock Deck
Unlock for access to all 214 flashcards in this deck.
Unlock Deck
k this deck
76
Based on the graph below, how can we best describe the shape of this distribution?
A) Relatively symmetrical
B) Positively skewed
C) Negatively skewed
D) No variation
E) Bimodal
A) Relatively symmetrical
B) Positively skewed
C) Negatively skewed
D) No variation
E) Bimodal
Unlock Deck
Unlock for access to all 214 flashcards in this deck.
Unlock Deck
k this deck
77
What is a disadvantage of the range as a measure of dispersion?
A) Based on only two observations
B) Can be distorted by a large mean
C) Not in the same units as the original data
D) Has no disadvantage
A) Based on only two observations
B) Can be distorted by a large mean
C) Not in the same units as the original data
D) Has no disadvantage
Unlock Deck
Unlock for access to all 214 flashcards in this deck.
Unlock Deck
k this deck
78
Based on the graph below, how can we best describe the shape of this distribution?
A) Relatively symmetrical
B) Positively skewed
C) Negatively skewed
D) No variation
E) Bimodal
A) Relatively symmetrical
B) Positively skewed
C) Negatively skewed
D) No variation
E) Bimodal
Unlock Deck
Unlock for access to all 214 flashcards in this deck.
Unlock Deck
k this deck
79
The ages of a sample of telephones used in a small town hotel were organized into the following
Table:
What is the sample variance?
A) About 10.2
B) About 6.1
C) About 14.0
D) About 3.2
E) About 5.0
Table:
What is the sample variance?
A) About 10.2
B) About 6.1
C) About 14.0
D) About 3.2
E) About 5.0
Unlock Deck
Unlock for access to all 214 flashcards in this deck.
Unlock Deck
k this deck
80
The sum of the differences between sample observations and the sample mean is
A) Zero
B) The mean deviation
C) The range
D) The standard deviation
E) The mean
A) Zero
B) The mean deviation
C) The range
D) The standard deviation
E) The mean
Unlock Deck
Unlock for access to all 214 flashcards in this deck.
Unlock Deck
k this deck
Unlock Deck
Unlock for access to all 214 flashcards in this deck.


