Deck 11: Two Sample Tests of Hypothesis
Full screen (f)
Question
Question
Question
Question
Two accounting professors decided to compare the variation of their grading procedures. To
Accomplish this they each graded the same 10 exams with the following results:
Using Excel to assist in the comparison, what test would be used?
A) ANOVA: Single Factor
B) ANOVA: Two-Factor with Replication
C) F-Test Two Sample for Variances
D) t-Test: Paired Two Sample for Means
E) We need the raw data in order to use the F-test in Excel
Question
Question
Question
Question
Question
Question
Question
Two accounting professors decided to compare the variation of their grading procedures. To
Accomplish this they each graded the same 10 exams with the following results:
What is H1?
A) σ21 = σ22
B) σ21 ≠ σ22
C) µ1 = µ2
D) µ1 ≠ µ2
Accomplish this they each graded the same 10 exams with the following results:
What is H1?
A) σ21 = σ22
B) σ21 ≠ σ22
C) µ1 = µ2
D) µ1 ≠ µ2
Question
Question
Question
Question
Question
Question
Question
Question
Question
Two accounting professors decided to compare the variation of their grading procedures. To
Accomplish this they each graded the same 10 exams with the following results:
What is H0?
A) σ21 = σ22
B) σ21 ≠ σ22
C) µ1 = µ2
D) µ1 ≠ µ2
Accomplish this they each graded the same 10 exams with the following results:
What is H0?
A) σ21 = σ22
B) σ21 ≠ σ22
C) µ1 = µ2
D) µ1 ≠ µ2
Question
Two accounting professors decided to compare the variation of their grading procedures. To
Accomplish this they each graded the same 10 exams with the following results: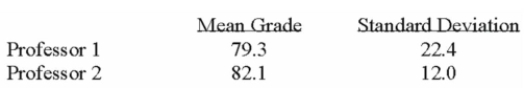
What are the degrees of freedom for the denominator of the F ratio?
A) 20
B) 18
C) 10
D) 9
E) 8
Accomplish this they each graded the same 10 exams with the following results:
What are the degrees of freedom for the denominator of the F ratio?
A) 20
B) 18
C) 10
D) 9
E) 8
Question
Two accounting professors decided to compare the variation of their grading procedures. To
Accomplish this they each graded the same 10 exams with the following results:
At the 1% level of significance, what is the decision?
A) Reject the null hypothesis and conclude the variance is different.
B) Fail to reject the null hypothesis and conclude the variance is different.
C) Reject the null hypothesis and conclude the variance is the same.
D) Fail to reject the null hypothesis and conclude the variance is the same.
Question
Two accounting professors decided to compare the variation of their grading procedures. To
Accomplish this they each graded the same 10 exams with the following results:
What is the critical value of F at the 0.05 level of significance?
A) 5.85
B) 5.35
C) 3.18
D) 4.03
Accomplish this they each graded the same 10 exams with the following results:
What is the critical value of F at the 0.05 level of significance?
A) 5.85
B) 5.35
C) 3.18
D) 4.03
Question
A random sample of 30 executives from companies with assets over $1 million was selected and
Asked for their annual income and level of education. The following table summarized the results: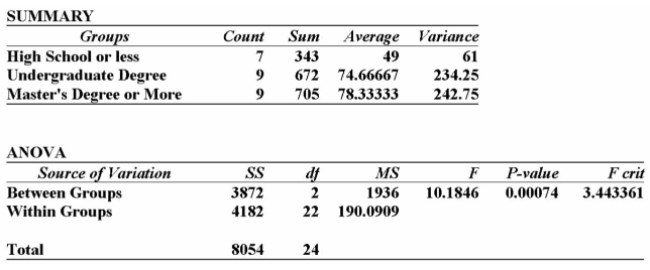
Using this output, what conclusions can you draw?
A) Since the calculated F-value is smaller than the F-critical value, there is a significant difference in the incomes of these 3 groups.
B) Since the calculated F-value is smaller than the F-critical value, there is no significant difference in the incomes of these three groups.
C) Since the P-value is 0.001, there is a 10% chance of these results happening when there is no significant difference in the incomes of these three groups.
D) Since the calculated F-value is larger than the F-critical value, and the P-value is so small, there is strong evidence to suggest that the three groups with different levels of education
Do not all have the same incomes.
E) Since the calculated F-value is larger than the F-critical value, and the P-value is so small, there is strong evidence to suggest that all three groups with different levels of education
Question
Question
Question
Question
Question
Two accounting professors decided to compare the variation of their grading procedures. To
Accomplish this they each graded the same 10 exams with the following results:
What is the critical value of F at the 0.01 level of significance?
A) 5.85
B) 5.35
C) 6.51
D) 4.03
Accomplish this they each graded the same 10 exams with the following results:
What is the critical value of F at the 0.01 level of significance?
A) 5.85
B) 5.35
C) 6.51
D) 4.03
Question
A random sample of 30 executives from companies with assets over $1 million was selected and
Asked for their annual income and level of education. The following table summarized the results: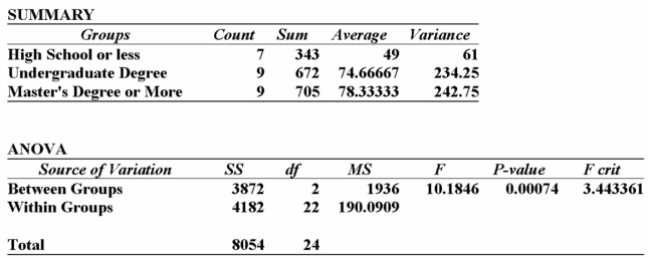
Using this output, what conclusions can you draw?
A) Since the calculated F-value is smaller than the F-critical value, there is no significant difference in the incomes of these three groups.
B) Since the calculated F-value is smaller than the F-critical value, there is a significant difference in the incomes of these 3 groups.
C) Since the _P-value is 0.001, there is a 10% chance of these results happening when there is no significant difference in the incomes of these three groups.
D) Since the calculated F-value is larger than the F-critical value, and the P-value is so small, there is strong evidence to suggest that all three groups with different levels of education
Have the same incomes.
E) Since the calculated F-value is larger than the F-critical value, and the P-value is so small, there is strong evidence to suggest that the three groups with different levels of education
Question
Question
Question
Two accounting professors decided to compare the variation of their grading procedures. To
Accomplish this they each graded the same 10 exams with the following results:
The calculated F ratio is:
A) 3.484
B) 1.867
C) 3.18
D) 5.35
Accomplish this they each graded the same 10 exams with the following results:
The calculated F ratio is:
A) 3.484
B) 1.867
C) 3.18
D) 5.35
Question
Question
Question
Question
Two accounting professors decided to compare the variation of their grading procedures. To
Accomplish this they each graded the same 10 exams with the following results:
What are the degrees of freedom for the numerator of the F ratio?
A) 8
B) 9
C) 10
D) 18
E) 20
Accomplish this they each graded the same 10 exams with the following results:
What are the degrees of freedom for the numerator of the F ratio?
A) 8
B) 9
C) 10
D) 18
E) 20
Question
Two accounting professors decided to compare the variation of their grading procedures. To
Accomplish this they each graded the same 10 exams with the following results:
At the 5% level of significance, what is the decision?
A) Reject the null hypothesis and conclude the variance is different.
B) Fail to reject the null hypothesis and conclude no significant difference in the variance.
C) Reject the null hypothesis and conclude the variance is the same.
D) Fail to reject the null hypothesis and conclude the variance is the same.
Question
Question
Question
In an effort to determine the most effective way to teach safety principles to a group of employees,
Four different methods were tried. Some employees were given programmed instruction booklets
And worked through the course at their own pace. Other employees attended lectures. A third
Group watched a television presentation, and a fourth group was divided into small discussion
Groups. A high of 10 was possible. Samples of five tests were selected from each group. The test
Grade results were: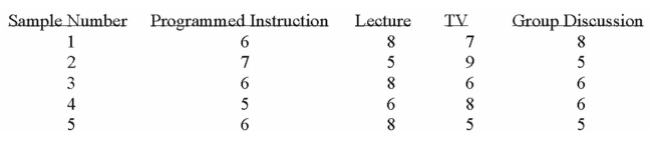
At the 0.01 level, what is the critical value?
A) 1.00
B) 1.96
C) 3.24
D) 5.29
Question
Question
A random sample of 25 executives from companies with assets over $1 million was selected and
Asked for their annual income and level of education. The following Excel printout summarized the
Results: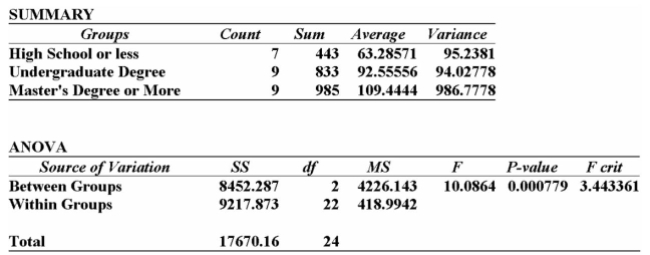
A) Since the calculated F-value is smaller than the F-critical value, there is a significant difference in the incomes of these 3 groups.
B) Since the calculated F-value is smaller than the F-critical value, there is no significant difference in the incomes of these three groups.
C) Since the P-value is 0.001, there is a 10% chance of these results happening when there is no significant difference in the incomes of these three groups.
D) Since the calculated F-value is larger than the F-critical value, and the P-value is so small, there is strong evidence to suggest that all three groups with different levels of education
Have the same incomes.
E) Since the calculated F-value is larger than the F-critical value, and the P-value is so small, there is strong evidence to suggest that the three groups with different levels of education
Question
Question
In an effort to determine the most effective way to teach safety principles to a group of employees,
Four different methods were tried. Some employees were given programmed instruction booklets
And worked through the course at their own pace. Other employees attended lectures. A third
Group watched a television presentation, and a fourth group was divided into small discussion
Groups. A high of 10 was possible. Samples of five tests were selected from each group. The test
Grade results were: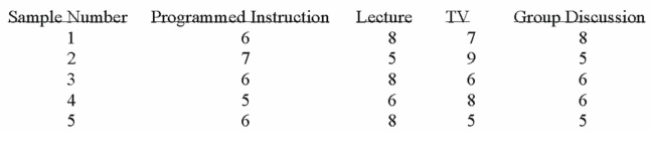
Using Excel to assist in determining if all methods generate the same results, what test would be
Used?
A) ANOVA: Single Factor.
B) ANOVA: Two-Factor with Replication.
C) ANOVA: Two-Factor without Replication.
D) F-Test Two Sample for Variances.
E) t-Test: Paired Two Sample for Means.
Question
Question
Question
Suppose that an automobile manufacturer designed a radically new lightweight engine and wants
To recommend the grade of gasoline to use. The four grades are: below regular, regular, premium,
And super premium. The test car made three trial runs on the test track using each of the four
Grades. Is there a difference in the performance between the four grades of gas?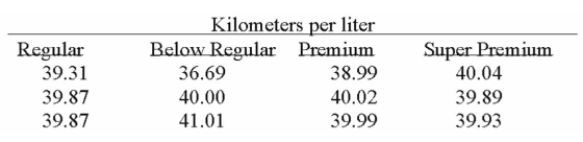
If you were to use Excel to assist in your solution to this problem, which test would you use?
A) ANOVA: Single Factor.
B) ANOVA: Two-Factor with Replication.
C) ANOVA: Two-Factor without Replication.
D) F-Test Two Sample for Variances.
E) t-Test: Paired Two Sample for Means.
Question
Using the Excel printout below to compare the mean annual incomes for executives with
Undergraduate and Master's Degree or more, the following statements can be made: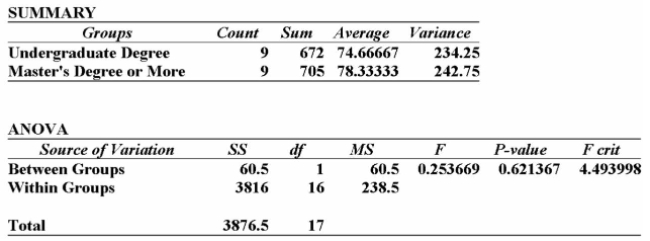
A) since the calculated F-value is smaller than the F-critical value, there is no significant difference in the incomes of these two groups.
B) since the calculated F-value is smaller than the F-critical value, there is a significant difference in the incomes of these two groups.
C) since the P-value is 0.62, there is a 62% chance of these results happening when there is no significant difference in the incomes of these two groups.
D) since the calculated F-value is larger than the F-critical value, and the P-value is so small, there is strong evidence to suggest that both groups with different levels of education
Have the same incomes.
E) since the calculated F-value is smaller than the F-critical value, there is no significant difference in the incomes of these two groups; also, since the P-value is 0.62, there is a
Question
Question
Random sample of executives from companies with assets over $1 million was selected and asked
For their annual income and level of education. The following MegaStat output summarized the
Results: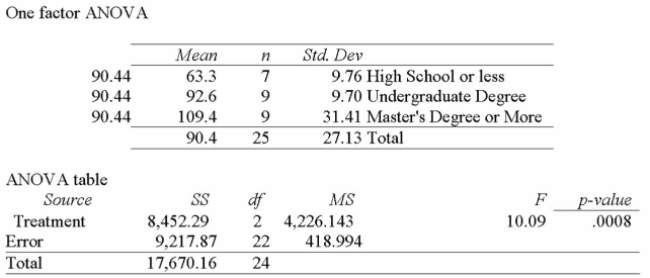
Using this output, what conclusions can you draw?
A) The total size of the sample used was 24.
B) Since the P-value is 0.0008, there is an 8% chance of these results happening when there is no significant difference in the incomes of these three groups.
C) Since the calculated F-value is large, and the P-value is so small, there is strong evidence to suggest that the three groups with different levels of education do not all have the same
Incomes.
D) Since the calculated F-value is large, and the P-value is so small, there is strong evidence to suggest that all three groups with different levels of education have the same incomes.
Question
Suppose that an automobile manufacturer designed a radically new lightweight engine and wants
To recommend the grade of gasoline to use. The four grades are: below regular, regular, premium,
And super premium. The test car made three trial runs on the test track using each of the four
Grades. Assuming any grade can be used at the 0.05 level, what is the critical value of F using 0.05
Level of significance?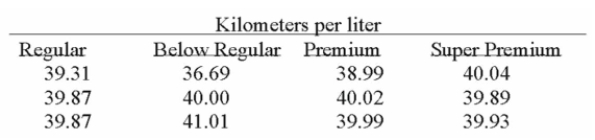
A) 1.96
B) 4.07
C) 2.33
D) 12.00
Question
Question
Suppose that an automobile manufacturer designed a radically new lightweight engine and wants
To recommend the grade of gasoline to use. The four grades are: below regular, regular, premium,
And super premium. The test car made three trial runs on the test track using each of the four
Grades. Is there a difference in the performance between the four grades of gas?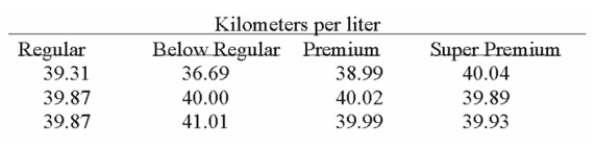
Using the printout given by Excel, what to you conclude?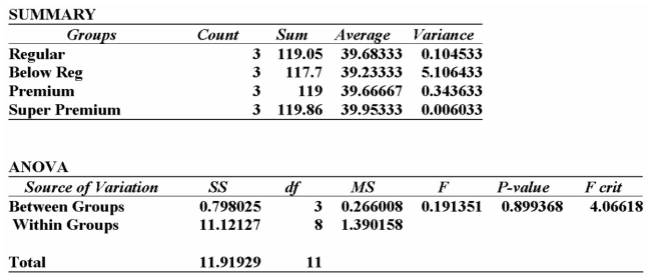
A) Since the calculated F-value is smaller than the F-critical value, there is a difference in the performance of these four grades of gas.
B) Since the calculated F-value is smaller than the F-critical value, there is no significant difference in the performance of these four grades of gas.
C) Since the calculated F-value is larger than the F-critical value, there is no significant difference in the performance in the four grades of gas.
D) There is no significant difference in the performance of these four grades of gas as indicated by the calculated F-value being smaller than the F-critical value, and the P-value
Question
The plant manager believes that the temperature in the packaging area of the plant affects the daily
Rate of production. To investigate, the plant temperature is set at 18 degrees, 20 degrees, and 22
Degrees. The number of units produced at each of these temperatures for a sample of days is
Collected.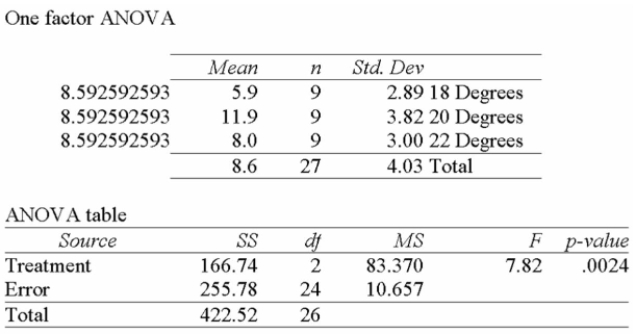
Using this output, what conclusions can you draw?
A) The total size of the sample used was 24.
B) Since the P-value is 0.0024, there is a 2% chance of these results happening when there is no significant difference in the number of units produced at the three temperatures.
C) Since the calculated F-value is large, and the P-value is so small, there is strong evidence to suggest that the number of units produced at the three temperatures is all the same.
D) Since the calculated F-value is large, and the P-value is so small, there is strong evidence to suggest that the number of units produced at the three temperatures is not all the same.
Question
Question
Question
Several employees have submitted different methods of assembling a product. Sample data for
Each method are: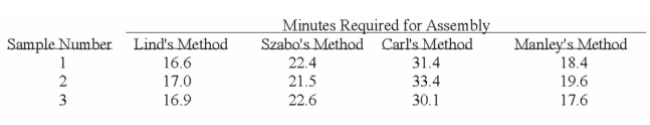
How many treatments are there?
A) 3
B) 4
C) 12
D) 0
Each method are:
How many treatments are there?
A) 3
B) 4
C) 12
D) 0
Question
Question
In an effort to determine the most effective way to teach safety principles to a group of employees,
Four different methods were tried. Some employees were given programmed instruction booklets
And worked through the course at their own pace. Other employees attended lectures. A third
Group watched a television presentation, and a fourth group was divided into small discussion
Groups. A high of 10 was possible. Samples of five tests were selected from each group. The test
Grade results were:
Excel's summary results at the 0.05 level produce the following output: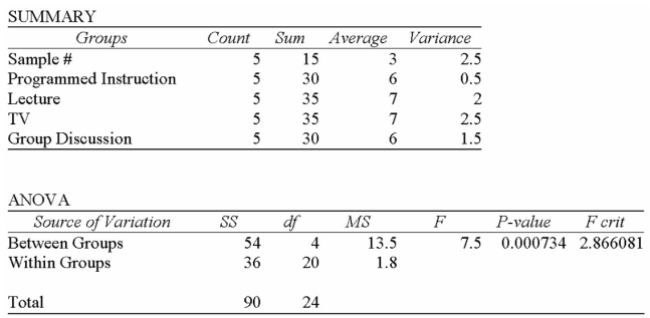
Using this output, what conclusions can you draw?
A) Since the calculated F-value is larger than the F-critical value, and the P-value is so small, there is strong evidence to suggest that all teaching methods give equal test results.
B) Since the calculated F-value is smaller than the F-critical value, there is a significant difference in the methods of teaching.
C) Since the calculated F-value is smaller than the F-critical value, there is no significant difference in the methods of teaching.
D) Since the P-value is 0.001, there is a 10% chance of these results happening when there is no significant difference in the methods of teaching.
E) Since the calculated F-value is larger than the F-critical value, and the P-value is so small,
there is strong evidence to suggest that all teaching methods do not give equal test
results
Question
Using the MegaStat printout below to compare the mean annual incomes for executives with
Undergraduate and High School or less, the following statements can be made: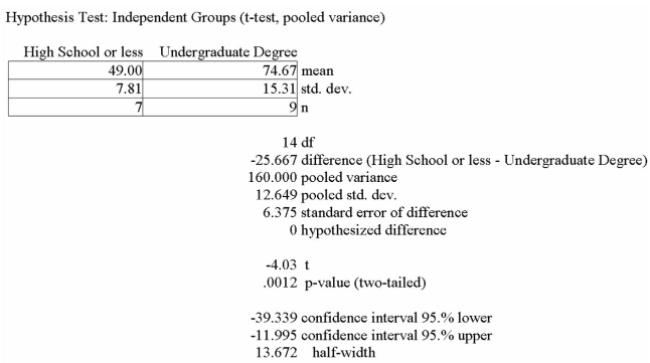
A) since the 95% confidence interval does not contain the value 0, there is no significant difference in the incomes of these two groups.
B) since the 95% confidence interval does not contain the value 0, there is a significant difference in the incomes of these two groups.
C) since the P-value is small, there is a strong chance of these results happening when there is no significant difference in the incomes of these two groups.
D) since the P-value is small, there is very little chance of these results happening when there is no significant difference in the incomes of these two groups-therefore those executives
With an undergraduate degree make more than their counterparts without.
E) since the 95% confidence interval does not contain the value 0, there is a significant difference in the incomes of these two groups; also, since the P-value is small, there is very
Question
A manufacturer of automobile transmissions uses three different processes. The management
Ordered a study of the production costs to see if there is a difference among the three processes. A
Summary of the findings is shown below.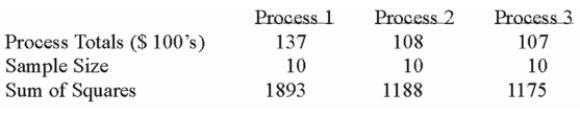
What is the critical value of F at the 1% level of significance?
A) 99.46
B) 5.49
C) 5.39
D) 4.61
Ordered a study of the production costs to see if there is a difference among the three processes. A
Summary of the findings is shown below.
What is the critical value of F at the 1% level of significance?
A) 99.46
B) 5.49
C) 5.39
D) 4.61
Question
A manufacturer of automobile transmissions uses three different processes. The management
Ordered a study of the production costs to see if there is a difference among the three processes. A
Summary of the findings is shown below.
What is the sum of squares for the treatment?
A) 67.80
B) 58.07
C) 149.34
D) 23.47
Ordered a study of the production costs to see if there is a difference among the three processes. A
Summary of the findings is shown below.
What is the sum of squares for the treatment?
A) 67.80
B) 58.07
C) 149.34
D) 23.47
Question
Question
Question
Question
Question
A manufacturer of automobile transmissions uses three different processes. The management
Ordered a study of the production costs to see if there is a difference among the three processes. A
Summary of the findings is shown below.
What are the total degrees of freedom?
A) 27
B) 28
C) 29
D) 30
Ordered a study of the production costs to see if there is a difference among the three processes. A
Summary of the findings is shown below.
What are the total degrees of freedom?
A) 27
B) 28
C) 29
D) 30
Question
Question
A manufacturer of automobile transmissions uses three different processes. The management
Ordered a study of the production costs to see if there is a difference among the three processes. A
Summary of the findings is shown below.
What are the degrees of freedom for the numerator of the F ratio?
A) 2
B) 3
C) 10
D) 27
Ordered a study of the production costs to see if there is a difference among the three processes. A
Summary of the findings is shown below.
What are the degrees of freedom for the numerator of the F ratio?
A) 2
B) 3
C) 10
D) 27
Question
A manufacturer of automobile transmissions uses three different processes. The management
Ordered a study of the production costs to see if there is a difference among the three processes. A
Summary of the findings is shown below.
What is the critical value of F at the 5% level of significance?
A) 19.45
B) 3.00
C) 3.35
D) 3.39
Ordered a study of the production costs to see if there is a difference among the three processes. A
Summary of the findings is shown below.
What is the critical value of F at the 5% level of significance?
A) 19.45
B) 3.00
C) 3.35
D) 3.39
Question
A manufacturer of automobile transmissions uses three different processes. The management
Ordered a study of the production costs to see if there is a difference among the three processes. A
Summary of the findings is shown below.
What is the sum of squares of the error?
A) 67.80
B) 58.07
C) 149.34
D) 23.47
Ordered a study of the production costs to see if there is a difference among the three processes. A
Summary of the findings is shown below.
What is the sum of squares of the error?
A) 67.80
B) 58.07
C) 149.34
D) 23.47
Question
Question
Question
Given the following Analysis of Variance table for three treatments each with six observations. 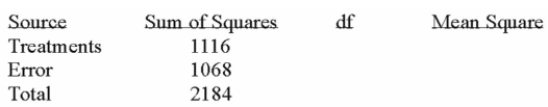 What is the decision?
A) Reject H0-there is a difference in treatments.
B) Fail to reject H0-there is a difference in treatments.
C) Reject H0-there is a difference in errors.
D) Fail to reject H0-there is a difference in errors.
What is the decision?A) Reject H0-there is a difference in treatments.
B) Fail to reject H0-there is a difference in treatments.
C) Reject H0-there is a difference in errors.
D) Fail to reject H0-there is a difference in errors.
Question
A manufacturer of automobile transmissions uses three different processes. The management
Ordered a study of the production costs to see if there is a difference among the three processes. A
Summary of the findings is shown below.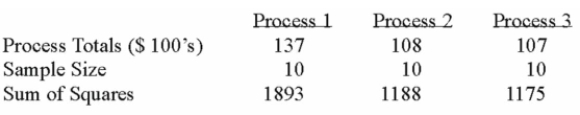
What are the degrees of freedom for the denominator?
A) 3
B) 10
C) 27
D) 30
Ordered a study of the production costs to see if there is a difference among the three processes. A
Summary of the findings is shown below.
What are the degrees of freedom for the denominator?
A) 3
B) 10
C) 27
D) 30
Question
Question
Question
Question

Unlock Deck
Sign up to unlock the cards in this deck!
Unlock Deck
Unlock Deck
1/103
Play
Full screen (f)
Deck 11: Two Sample Tests of Hypothesis
1
i. One characteristic of the F distribution is that computed F can only range between -1 and +1.
ii. The shape of the F distribution is determined by the degrees of freedom for the F-statistic, one for
The numerator and one for the denominator.
iii. The F distribution's curve is positively skewed.
A) (i), (ii), and (iii) are all correct statements.
B) (i) and (ii) are correct statements but not (iii).
C) (i) and (iii) are correct statements but not (ii).
D) (ii) and (iii) are correct statements but not (i).
E) (i), (ii), and (iii) are all false statements.
(ii) and (iii) are correct statements but not (i).
2
i. One characteristic of the F distribution is that computed F can only range between -1 and +1.
ii. The F distribution's curve is positively skewed.
iii. Like Student's t distribution, a change in the degrees of freedom causes a change in the shape of
The F distribution.
A) (i), (ii), and (iii) are all correct statements.
B) (i) and (ii) are correct statements but not (iii).
C) (i) and (iii) are correct statements but not (ii).
D) (ii) and (iii) are correct statements but not (i).
E) (i), (ii), and (iii) are all false statements.
(ii) and (iii) are correct statements but not (i).
3
i. One characteristic of the F distribution is that F cannot be negative.
ii. The shape of the F distribution is determined by the degrees of freedom for the F-statistic, one for
The numerator and one for the denominator.
iii. The F distribution's curve is positively skewed.
A) (i), (ii), and (iii) are all correct statements.
B) (i) and (ii) are correct statements but not (iii).
C) (i) and (iii) are correct statements but not (ii).
D) (ii) and (iii) are correct statements but not (i).
E) (i), (ii), and (iii) are all false statements.
(i), (ii), and (iii) are all correct statements.
4
Two accounting professors decided to compare the variation of their grading procedures. To
Accomplish this they each graded the same 10 exams with the following results:
Using Excel to assist in the comparison, what test would be used?
A) ANOVA: Single Factor
B) ANOVA: Two-Factor with Replication
C) F-Test Two Sample for Variances
D) t-Test: Paired Two Sample for Means
E) We need the raw data in order to use the F-test in Excel
Unlock Deck
Unlock for access to all 103 flashcards in this deck.
Unlock Deck
k this deck
5
Which statement is correct about the F distribution?
A) Cannot be negative.
B) Cannot be positive.
C) Is the same as the t distribution.
D) Is the same as the z distribution.
A) Cannot be negative.
B) Cannot be positive.
C) Is the same as the t distribution.
D) Is the same as the z distribution.
Unlock Deck
Unlock for access to all 103 flashcards in this deck.
Unlock Deck
k this deck
6
i. One characteristic of the F distribution is that F cannot be negative.
ii. One characteristic of the F distribution is that computed F can only range between -1 and +1.
iii. The shape of the F distribution is positively skewed.
A) (i), (ii), and (iii) are all correct statements.
B) (i) and (ii) are correct statements but not (iii).
C) (i) and (iii) are correct statements but not (ii).
D) (ii) and (iii) are correct statements but not (i).
E) (i), (ii), and (iii) are all false statements.
Unlock Deck
Unlock for access to all 103 flashcards in this deck.
Unlock Deck
k this deck
7
i. The shape of the F distribution is determined by the degrees of freedom for the F-statistic, one for
The numerator and one for the denominator.
ii. Like Student's t distribution, a change in the degrees of freedom causes a change in the shape of
The F distribution.
iii. The calculated F value must be equal to or greater than zero (0).
A) (i), (ii), and (iii) are all correct statements.
B) (i) and (ii) are correct statements but not (iii).
C) (i) and (iii) are correct statements but not (ii).
D) (ii) and (iii) are correct statements but not (i).
E) (i), (ii), and (iii) are all false statements.
Unlock Deck
Unlock for access to all 103 flashcards in this deck.
Unlock Deck
k this deck
8
i. If the computed value of F is 0.99 and the critical value is 3.89, we would not reject the null
Hypothesis.
ii. When comparing two population variances we use the F distribution.
iii. A one way ANOVA is use to compare several treatment means.
A) (i), (ii), and (iii) are all correct statements.
B) (i) and (ii) are correct statements but not (iii).
C) (i) and (iii) are correct statements but not (ii).
D) (ii) and (iii) are correct statements but not (i).
E) (i), (ii), and (iii) are all false statements.
Unlock Deck
Unlock for access to all 103 flashcards in this deck.
Unlock Deck
k this deck
9
i. The test statistic used in ANOVA is t.
ii. The calculated F value must be equal to or greater than one (1).
iii. The shape of the F distribution is symmetrical.
A) (i), (ii), and (iii) are all correct statements.
B) (i) and (ii) are correct statements but not (iii).
C) (i) and (iii) are correct statements but not (ii).
D) (ii) and (iii) are correct statements but not (i).
E) (i), (ii), and (iii) are all false statements.
Unlock Deck
Unlock for access to all 103 flashcards in this deck.
Unlock Deck
k this deck
10
Which of the following are characteristics of the F distribution?
A) There is a "family" of F distributions.
B) The F distribution is continuous.
C) The F distribution cannot be negative.
D) The F distribution is continuous, cannot be negative, there is a "family" of F distributions.
A) There is a "family" of F distributions.
B) The F distribution is continuous.
C) The F distribution cannot be negative.
D) The F distribution is continuous, cannot be negative, there is a "family" of F distributions.
Unlock Deck
Unlock for access to all 103 flashcards in this deck.
Unlock Deck
k this deck
11
Two accounting professors decided to compare the variation of their grading procedures. To
Accomplish this they each graded the same 10 exams with the following results:
What is H1?
A) σ21 = σ22
B) σ21 ≠ σ22
C) µ1 = µ2
D) µ1 ≠ µ2
Accomplish this they each graded the same 10 exams with the following results:
What is H1?
A) σ21 = σ22
B) σ21 ≠ σ22
C) µ1 = µ2
D) µ1 ≠ µ2
Unlock Deck
Unlock for access to all 103 flashcards in this deck.
Unlock Deck
k this deck
12
i. The shape of the F distribution is determined by the degrees of freedom for the F-statistic, one for
The numerator and one for the denominator.
ii. The F distribution's curve is positively skewed.
iii. Unlike Student's t distribution, there is only one F distribution.
A) (i), (ii), and (iii) are all correct statements.
B) (i) and (ii) are correct statements but not (iii).
C) (i) and (iii) are correct statements but not (ii).
D) (ii) and (iii) are correct statements but not (i).
E) (i), (ii), and (iii) are all false statements.
Unlock Deck
Unlock for access to all 103 flashcards in this deck.
Unlock Deck
k this deck
13
i. The test statistic used in ANOVA is F.
ii. The calculated F value must be equal to or greater than zero (0).
iii. The shape of the F distribution is symmetrical.
A) (i), (ii), and (iii) are all correct statements.
B) (i) and (ii) are correct statements but not (iii).
C) (i) and (iii) are correct statements but not (ii).
D) (ii) and (iii) are correct statements but not (i).
E) (i), (ii), and (iii) are all false statements.
Unlock Deck
Unlock for access to all 103 flashcards in this deck.
Unlock Deck
k this deck
14
What distribution does the F distribution approach as the sample size increases?
A) Binomial
B) Normal
C) Poisson
D) Exponential
A) Binomial
B) Normal
C) Poisson
D) Exponential
Unlock Deck
Unlock for access to all 103 flashcards in this deck.
Unlock Deck
k this deck
15
i. The F distribution is positively skewed and its values may range from 0 to plus infinity.
ii. The F distribution's curve is positively skewed.
iii. There is one, unique F distribution for a F-statistic with 29 degrees of freedom in the numerator
And 28 degrees of freedom in the denominator.
A) (i), (ii), and (iii) are all correct statements.
B) (i) and (ii) are correct statements but not (iii).
C) (i) and (iii) are correct statements but not (ii).
D) (ii) and (iii) are correct statements but not (i).
E) (i), (ii), and (iii) are all false statements.
Unlock Deck
Unlock for access to all 103 flashcards in this deck.
Unlock Deck
k this deck
16
Which of the following is NOT a characteristic of the F distribution?
A) It is based on two sets of degrees of freedom.
B) It is positively skewed.
C) As the values of X increase, the F curve approaches the X-axis and eventually equals zero.
D) It is asymptotic.
A) It is based on two sets of degrees of freedom.
B) It is positively skewed.
C) As the values of X increase, the F curve approaches the X-axis and eventually equals zero.
D) It is asymptotic.
Unlock Deck
Unlock for access to all 103 flashcards in this deck.
Unlock Deck
k this deck
17
i. The F distribution is positively skewed and its values may range from 0 to plus infinity.
ii. The F distribution's curve is positively skewed.
iii. Like Student's t distribution, a change in the degrees of freedom causes a change in the shape of
The F distribution.
A) (i), (ii), and (iii) are all correct statements.
B) (i) and (ii) are correct statements but not (iii).
C) (i) and (iii) are correct statements but not (ii).
D) (ii) and (iii) are correct statements but not (i).
E) (i), (ii), and (iii) are all false statements.
Unlock Deck
Unlock for access to all 103 flashcards in this deck.
Unlock Deck
k this deck
18
i. The F distribution is positively skewed and its values may range from 0 to plus infinity.
ii. The F distribution's curve is positively symmetrical.
iii. Like Student's t distribution, a change in the degrees of freedom causes a change in the shape of
The F distribution.
A) (i), (ii), and (iii) are all correct statements.
B) (i) and (ii) are correct statements but not (iii).
C) (i) and (iii) are correct statements but not (ii).
D) (ii) and (iii) are correct statements but not (i).
E) (i), (ii), and (iii) are all false statements.
Unlock Deck
Unlock for access to all 103 flashcards in this deck.
Unlock Deck
k this deck
19
An F statistic is:
A) a ratio of two means.
B) a ratio of two variances.
C) the difference between three means.
D) a population parameter.
A) a ratio of two means.
B) a ratio of two variances.
C) the difference between three means.
D) a population parameter.
Unlock Deck
Unlock for access to all 103 flashcards in this deck.
Unlock Deck
k this deck
20
Two accounting professors decided to compare the variation of their grading procedures. To
Accomplish this they each graded the same 10 exams with the following results:
What is H0?
A) σ21 = σ22
B) σ21 ≠ σ22
C) µ1 = µ2
D) µ1 ≠ µ2
Accomplish this they each graded the same 10 exams with the following results:
What is H0?
A) σ21 = σ22
B) σ21 ≠ σ22
C) µ1 = µ2
D) µ1 ≠ µ2
Unlock Deck
Unlock for access to all 103 flashcards in this deck.
Unlock Deck
k this deck
21
Two accounting professors decided to compare the variation of their grading procedures. To
Accomplish this they each graded the same 10 exams with the following results:
What are the degrees of freedom for the denominator of the F ratio?
A) 20
B) 18
C) 10
D) 9
E) 8
Accomplish this they each graded the same 10 exams with the following results:
What are the degrees of freedom for the denominator of the F ratio?
A) 20
B) 18
C) 10
D) 9
E) 8
Unlock Deck
Unlock for access to all 103 flashcards in this deck.
Unlock Deck
k this deck
22
Two accounting professors decided to compare the variation of their grading procedures. To
Accomplish this they each graded the same 10 exams with the following results:
At the 1% level of significance, what is the decision?
A) Reject the null hypothesis and conclude the variance is different.
B) Fail to reject the null hypothesis and conclude the variance is different.
C) Reject the null hypothesis and conclude the variance is the same.
D) Fail to reject the null hypothesis and conclude the variance is the same.
Unlock Deck
Unlock for access to all 103 flashcards in this deck.
Unlock Deck
k this deck
23
Two accounting professors decided to compare the variation of their grading procedures. To
Accomplish this they each graded the same 10 exams with the following results:
What is the critical value of F at the 0.05 level of significance?
A) 5.85
B) 5.35
C) 3.18
D) 4.03
Accomplish this they each graded the same 10 exams with the following results:
What is the critical value of F at the 0.05 level of significance?
A) 5.85
B) 5.35
C) 3.18
D) 4.03
Unlock Deck
Unlock for access to all 103 flashcards in this deck.
Unlock Deck
k this deck
24
A random sample of 30 executives from companies with assets over $1 million was selected and
Asked for their annual income and level of education. The following table summarized the results:
Using this output, what conclusions can you draw?
A) Since the calculated F-value is smaller than the F-critical value, there is a significant difference in the incomes of these 3 groups.
B) Since the calculated F-value is smaller than the F-critical value, there is no significant difference in the incomes of these three groups.
C) Since the P-value is 0.001, there is a 10% chance of these results happening when there is no significant difference in the incomes of these three groups.
D) Since the calculated F-value is larger than the F-critical value, and the P-value is so small, there is strong evidence to suggest that the three groups with different levels of education
Do not all have the same incomes.
E) Since the calculated F-value is larger than the F-critical value, and the P-value is so small, there is strong evidence to suggest that all three groups with different levels of education
Unlock Deck
Unlock for access to all 103 flashcards in this deck.
Unlock Deck
k this deck
25
Which one of the following is not assumed in the use of ANOVA?
A) The populations follow a normal distribution.
B) The samples have equal standard deviations.
C) The populations have equal standard deviations.
D) The populations are independent.
A) The populations follow a normal distribution.
B) The samples have equal standard deviations.
C) The populations have equal standard deviations.
D) The populations are independent.
Unlock Deck
Unlock for access to all 103 flashcards in this deck.
Unlock Deck
k this deck
26
i. The statistical technique used to test the equality of three or more population means is called
Analysis of variance (ANOVA).
ii. To employ ANOVA, the populations need not have equal standard deviations.
iii. To employ ANOVA, the populations being studied must be approximately normally distributed.
A) (i), (ii), and (iii) are all correct statements.
B) (i) and (ii) are correct statements but not (iii).
C) (i) and (iii) are correct statements but not (ii).
D) (ii) and (iii) are correct statements but not (i).
E) (i), (ii), and (iii) are all false statements.
Unlock Deck
Unlock for access to all 103 flashcards in this deck.
Unlock Deck
k this deck
27
i. To employ ANOVA, the populations need not have equal standard deviations.
ii. To employ ANOVA, the populations being studied need not be normally distributed.
iii. A technique that is efficient when simultaneously comparing more than two population means is
Known as analysis of deviation.
A) (i), (ii), and (iii) are all correct statements.
B) (i) and (ii) are correct statements but not (iii).
C) (i) and (iii) are correct statements but not (ii).
D) (ii) and (iii) are correct statements but not (i).
E) (i), (ii), and (iii) are all false statements.
Unlock Deck
Unlock for access to all 103 flashcards in this deck.
Unlock Deck
k this deck
28
i. To employ ANOVA, the populations should have approximately equal standard deviations.
ii. To employ ANOVA, the populations being studied must be approximately normally distributed.
iii. A technique that is efficient when simultaneously comparing more than two population means is
Known as analysis of variance (ANOVA).
A) (i), (ii), and (iii) are all correct statements.
B) (i) and (ii) are correct statements but not (iii).
C) (i) and (iii) are correct statements but not (ii).
D) (ii) and (iii) are correct statements but not (i).
E) (i), (ii), and (iii) are all false statements.
Unlock Deck
Unlock for access to all 103 flashcards in this deck.
Unlock Deck
k this deck
29
Two accounting professors decided to compare the variation of their grading procedures. To
Accomplish this they each graded the same 10 exams with the following results:
What is the critical value of F at the 0.01 level of significance?
A) 5.85
B) 5.35
C) 6.51
D) 4.03
Accomplish this they each graded the same 10 exams with the following results:
What is the critical value of F at the 0.01 level of significance?
A) 5.85
B) 5.35
C) 6.51
D) 4.03
Unlock Deck
Unlock for access to all 103 flashcards in this deck.
Unlock Deck
k this deck
30
A random sample of 30 executives from companies with assets over $1 million was selected and
Asked for their annual income and level of education. The following table summarized the results:
Using this output, what conclusions can you draw?
A) Since the calculated F-value is smaller than the F-critical value, there is no significant difference in the incomes of these three groups.
B) Since the calculated F-value is smaller than the F-critical value, there is a significant difference in the incomes of these 3 groups.
C) Since the _P-value is 0.001, there is a 10% chance of these results happening when there is no significant difference in the incomes of these three groups.
D) Since the calculated F-value is larger than the F-critical value, and the P-value is so small, there is strong evidence to suggest that all three groups with different levels of education
Have the same incomes.
E) Since the calculated F-value is larger than the F-critical value, and the P-value is so small, there is strong evidence to suggest that the three groups with different levels of education
Unlock Deck
Unlock for access to all 103 flashcards in this deck.
Unlock Deck
k this deck
31
i. The statistical technique used to test the equality of three or more population means is called
Analysis of variance (ANOVA).
ii. To employ ANOVA, the populations should have approximately equal standard deviations.
iii. To employ ANOVA, the populations being studied must be approximately normally distributed.
A) (i), (ii), and (iii) are all correct statements.
B) (i) and (ii) are correct statements but not (iii).
C) (i) and (iii) are correct statements but not (ii).
D) (ii) and (iii) are correct statements but not (i).
E) (i), (ii), and (iii) are all false statements.
Unlock Deck
Unlock for access to all 103 flashcards in this deck.
Unlock Deck
k this deck
32
i. The statistical technique used to test the equality of three or more population means is called
Analysis of variance (ANOVA).
ii. To employ ANOVA, the populations should have approximately equal standard deviations.
iii. The least number of sources of variation in ANOVA is two.
A) (i), (ii), and (iii) are all correct statements.
B) (i) and (ii) are correct statements but not (iii).
C) (i) and (iii) are correct statements but not (ii).
D) (ii) and (iii) are correct statements but not (i).
E) (i), (ii), and (iii) are all false statements.
Unlock Deck
Unlock for access to all 103 flashcards in this deck.
Unlock Deck
k this deck
33
Two accounting professors decided to compare the variation of their grading procedures. To
Accomplish this they each graded the same 10 exams with the following results:
The calculated F ratio is:
A) 3.484
B) 1.867
C) 3.18
D) 5.35
Accomplish this they each graded the same 10 exams with the following results:
The calculated F ratio is:
A) 3.484
B) 1.867
C) 3.18
D) 5.35
Unlock Deck
Unlock for access to all 103 flashcards in this deck.
Unlock Deck
k this deck
34
The F test statistic is the ratio of the:
A) estimate of the population mean based on the differences among the sample standard deviations to the estimate of the population variance based on the variation within the
Samples.
B) estimate of the population variance based on the differences among the sample means to the estimate of the population variance based on the variation within the samples.
C) estimate of the population variance based on the sums of the sample means to the estimate of the population variance based on the variation within the samples.
Unlock Deck
Unlock for access to all 103 flashcards in this deck.
Unlock Deck
k this deck
35
i. To employ ANOVA, the populations being studied must be approximately normally distributed.
ii. A technique that is efficient when simultaneously comparing more than two population means is
Known as analysis of variance (ANOVA).
iii. The least number of sources of variation in ANOVA is two.
A) (i), (ii), and (iii) are all correct statements.
B) (i) and (ii) are correct statements but not (iii).
C) (i) and (iii) are correct statements but not (ii).
D) (ii) and (iii) are correct statements but not (i).
E) (i), (ii), and (iii) are all false statements.
Unlock Deck
Unlock for access to all 103 flashcards in this deck.
Unlock Deck
k this deck
36
Analysis of variance is used to:
A) compare nominal data.
B) compute t test.
C) compare population proportion.
D) simultaneously compare several population means.
A) compare nominal data.
B) compute t test.
C) compare population proportion.
D) simultaneously compare several population means.
Unlock Deck
Unlock for access to all 103 flashcards in this deck.
Unlock Deck
k this deck
37
Two accounting professors decided to compare the variation of their grading procedures. To
Accomplish this they each graded the same 10 exams with the following results:
What are the degrees of freedom for the numerator of the F ratio?
A) 8
B) 9
C) 10
D) 18
E) 20
Accomplish this they each graded the same 10 exams with the following results:
What are the degrees of freedom for the numerator of the F ratio?
A) 8
B) 9
C) 10
D) 18
E) 20
Unlock Deck
Unlock for access to all 103 flashcards in this deck.
Unlock Deck
k this deck
38
Two accounting professors decided to compare the variation of their grading procedures. To
Accomplish this they each graded the same 10 exams with the following results:
At the 5% level of significance, what is the decision?
A) Reject the null hypothesis and conclude the variance is different.
B) Fail to reject the null hypothesis and conclude no significant difference in the variance.
C) Reject the null hypothesis and conclude the variance is the same.
D) Fail to reject the null hypothesis and conclude the variance is the same.
Unlock Deck
Unlock for access to all 103 flashcards in this deck.
Unlock Deck
k this deck
39
i. To employ ANOVA, the populations should have approximately equal standard deviations.
ii. To employ ANOVA, the populations being studied must be approximately normally distributed.
iii. The least number of sources of variation in ANOVA is two.
A) (i), (ii), and (iii) are all correct statements.
B) (i) and (ii) are correct statements but not (iii).
C) (i) and (iii) are correct statements but not (ii).
D) (ii) and (iii) are correct statements but not (i).
E) (i), (ii), and (iii) are all false statements.
Unlock Deck
Unlock for access to all 103 flashcards in this deck.
Unlock Deck
k this deck
40
i. The rejection region for analysis of variance is in the upper tail of the F distribution.
ii. In ANOVA, k -1 degrees of freedom are associated with the numerator of the F ratio.
iii. In ANOVA, k-1 degrees of freedom are associated with the denominator of the F ratio.
A) (i), (ii), and (iii) are all correct statements.
B) (i) and (ii) are correct statements but not (iii).
C) (i) and (iii) are correct statements but not (ii).
D) (ii) and (iii) are correct statements but not (i).
E) (i), (ii), and (iii) are all false statements.
Unlock Deck
Unlock for access to all 103 flashcards in this deck.
Unlock Deck
k this deck
41
In an effort to determine the most effective way to teach safety principles to a group of employees,
Four different methods were tried. Some employees were given programmed instruction booklets
And worked through the course at their own pace. Other employees attended lectures. A third
Group watched a television presentation, and a fourth group was divided into small discussion
Groups. A high of 10 was possible. Samples of five tests were selected from each group. The test
Grade results were:
At the 0.01 level, what is the critical value?
A) 1.00
B) 1.96
C) 3.24
D) 5.29
Unlock Deck
Unlock for access to all 103 flashcards in this deck.
Unlock Deck
k this deck
42
Suppose a package delivery company purchased 14 trucks at the same time. Five trucks were purchased from manufacturer A, four from B and five from manufacturer C. The cost of maintaining each truck was recorded. The company wants to test if the mean maintenance cost for trucks from each manufacturer were equal. Using Excel, what test would be used?
A) ANOVA: Single Factor.
B) ANOVA: Two-Factor with Replication.
C) ANOVA: Two-Factor without Replication.
D) F-Test Two Sample for Variances.
E) t-Test: Paired Two Sample for Means.
A) ANOVA: Single Factor.
B) ANOVA: Two-Factor with Replication.
C) ANOVA: Two-Factor without Replication.
D) F-Test Two Sample for Variances.
E) t-Test: Paired Two Sample for Means.
Unlock Deck
Unlock for access to all 103 flashcards in this deck.
Unlock Deck
k this deck
43
A random sample of 25 executives from companies with assets over $1 million was selected and
Asked for their annual income and level of education. The following Excel printout summarized the
Results:
A) Since the calculated F-value is smaller than the F-critical value, there is a significant difference in the incomes of these 3 groups.
B) Since the calculated F-value is smaller than the F-critical value, there is no significant difference in the incomes of these three groups.
C) Since the P-value is 0.001, there is a 10% chance of these results happening when there is no significant difference in the incomes of these three groups.
D) Since the calculated F-value is larger than the F-critical value, and the P-value is so small, there is strong evidence to suggest that all three groups with different levels of education
Have the same incomes.
E) Since the calculated F-value is larger than the F-critical value, and the P-value is so small, there is strong evidence to suggest that the three groups with different levels of education
Asked for their annual income and level of education. The following Excel printout summarized the
Results:
A) Since the calculated F-value is smaller than the F-critical value, there is a significant difference in the incomes of these 3 groups.
B) Since the calculated F-value is smaller than the F-critical value, there is no significant difference in the incomes of these three groups.
C) Since the P-value is 0.001, there is a 10% chance of these results happening when there is no significant difference in the incomes of these three groups.
D) Since the calculated F-value is larger than the F-critical value, and the P-value is so small, there is strong evidence to suggest that all three groups with different levels of education
Have the same incomes.
E) Since the calculated F-value is larger than the F-critical value, and the P-value is so small, there is strong evidence to suggest that the three groups with different levels of education
Unlock Deck
Unlock for access to all 103 flashcards in this deck.
Unlock Deck
k this deck
44
Three different advertisements were used to sell a popular toy. In computing F, how many degrees
Of freedom are there in the numerator?
A) 0
B) 1
C) 2
D) 3
Of freedom are there in the numerator?
A) 0
B) 1
C) 2
D) 3
Unlock Deck
Unlock for access to all 103 flashcards in this deck.
Unlock Deck
k this deck
45
In an effort to determine the most effective way to teach safety principles to a group of employees,
Four different methods were tried. Some employees were given programmed instruction booklets
And worked through the course at their own pace. Other employees attended lectures. A third
Group watched a television presentation, and a fourth group was divided into small discussion
Groups. A high of 10 was possible. Samples of five tests were selected from each group. The test
Grade results were:
Using Excel to assist in determining if all methods generate the same results, what test would be
Used?
A) ANOVA: Single Factor.
B) ANOVA: Two-Factor with Replication.
C) ANOVA: Two-Factor without Replication.
D) F-Test Two Sample for Variances.
E) t-Test: Paired Two Sample for Means.
Unlock Deck
Unlock for access to all 103 flashcards in this deck.
Unlock Deck
k this deck
46
An electronics company wants to compare the quality of their cell phones to the cell phones from
Three competitors. They sample 10 phones from each company and count the number of defects for
Each phone. Using Excel, what test is used to compare the average number of defects?
A) ANOVA: Single Factor.
B) ANOVA: Two-Factor with Replication.
C) ANOVA: Two-Factor without Replication.
D) F-Test Two Sample for Variances.
E) t-Test: Paired Two Sample for Means.
Unlock Deck
Unlock for access to all 103 flashcards in this deck.
Unlock Deck
k this deck
47
If an ANOVA test is conducted and the null hypothesis is rejected, what does this indicate?
A) Too many degrees of freedom.
B) No difference between the population means.
C) A difference between at least one pair of population means.
A) Too many degrees of freedom.
B) No difference between the population means.
C) A difference between at least one pair of population means.
Unlock Deck
Unlock for access to all 103 flashcards in this deck.
Unlock Deck
k this deck
48
Suppose that an automobile manufacturer designed a radically new lightweight engine and wants
To recommend the grade of gasoline to use. The four grades are: below regular, regular, premium,
And super premium. The test car made three trial runs on the test track using each of the four
Grades. Is there a difference in the performance between the four grades of gas?
If you were to use Excel to assist in your solution to this problem, which test would you use?
A) ANOVA: Single Factor.
B) ANOVA: Two-Factor with Replication.
C) ANOVA: Two-Factor without Replication.
D) F-Test Two Sample for Variances.
E) t-Test: Paired Two Sample for Means.
Unlock Deck
Unlock for access to all 103 flashcards in this deck.
Unlock Deck
k this deck
49
Using the Excel printout below to compare the mean annual incomes for executives with
Undergraduate and Master's Degree or more, the following statements can be made:
A) since the calculated F-value is smaller than the F-critical value, there is no significant difference in the incomes of these two groups.
B) since the calculated F-value is smaller than the F-critical value, there is a significant difference in the incomes of these two groups.
C) since the P-value is 0.62, there is a 62% chance of these results happening when there is no significant difference in the incomes of these two groups.
D) since the calculated F-value is larger than the F-critical value, and the P-value is so small, there is strong evidence to suggest that both groups with different levels of education
Have the same incomes.
E) since the calculated F-value is smaller than the F-critical value, there is no significant difference in the incomes of these two groups; also, since the P-value is 0.62, there is a
Undergraduate and Master's Degree or more, the following statements can be made:
A) since the calculated F-value is smaller than the F-critical value, there is no significant difference in the incomes of these two groups.
B) since the calculated F-value is smaller than the F-critical value, there is a significant difference in the incomes of these two groups.
C) since the P-value is 0.62, there is a 62% chance of these results happening when there is no significant difference in the incomes of these two groups.
D) since the calculated F-value is larger than the F-critical value, and the P-value is so small, there is strong evidence to suggest that both groups with different levels of education
Have the same incomes.
E) since the calculated F-value is smaller than the F-critical value, there is no significant difference in the incomes of these two groups; also, since the P-value is 0.62, there is a
Unlock Deck
Unlock for access to all 103 flashcards in this deck.
Unlock Deck
k this deck
50
A preliminary study of hourly wages paid to unskilled employees in three metropolitan areas was
Conducted. Seven employees were included from Area A, 9 from Area B and 12 from Area D The test statistic was computed to be 4.91. What can we conclude at the 0.05 level?
A) Mean hourly wages of unskilled employees all areas are equal.
B) Mean hourly wages in at least 2 metropolitan areas are different.
C) More degrees of freedom are needed.
Unlock Deck
Unlock for access to all 103 flashcards in this deck.
Unlock Deck
k this deck
51
Random sample of executives from companies with assets over $1 million was selected and asked
For their annual income and level of education. The following MegaStat output summarized the
Results:
Using this output, what conclusions can you draw?
A) The total size of the sample used was 24.
B) Since the P-value is 0.0008, there is an 8% chance of these results happening when there is no significant difference in the incomes of these three groups.
C) Since the calculated F-value is large, and the P-value is so small, there is strong evidence to suggest that the three groups with different levels of education do not all have the same
Incomes.
D) Since the calculated F-value is large, and the P-value is so small, there is strong evidence to suggest that all three groups with different levels of education have the same incomes.
For their annual income and level of education. The following MegaStat output summarized the
Results:
Using this output, what conclusions can you draw?
A) The total size of the sample used was 24.
B) Since the P-value is 0.0008, there is an 8% chance of these results happening when there is no significant difference in the incomes of these three groups.
C) Since the calculated F-value is large, and the P-value is so small, there is strong evidence to suggest that the three groups with different levels of education do not all have the same
Incomes.
D) Since the calculated F-value is large, and the P-value is so small, there is strong evidence to suggest that all three groups with different levels of education have the same incomes.
Unlock Deck
Unlock for access to all 103 flashcards in this deck.
Unlock Deck
k this deck
52
Suppose that an automobile manufacturer designed a radically new lightweight engine and wants
To recommend the grade of gasoline to use. The four grades are: below regular, regular, premium,
And super premium. The test car made three trial runs on the test track using each of the four
Grades. Assuming any grade can be used at the 0.05 level, what is the critical value of F using 0.05
Level of significance?
A) 1.96
B) 4.07
C) 2.33
D) 12.00
Unlock Deck
Unlock for access to all 103 flashcards in this deck.
Unlock Deck
k this deck
53
In ANOVA, an F statistic is used to test a null hypothesis such as:
A) Ho: σ21 = σ22= σ23
B) Ho: σ21 ≠ σ22≠ σ23
C) Ho: µ1 = µ2= µ3
D) Ho: µ1 ≠ µ2≠ µ2
A) Ho: σ21 = σ22= σ23
B) Ho: σ21 ≠ σ22≠ σ23
C) Ho: µ1 = µ2= µ3
D) Ho: µ1 ≠ µ2≠ µ2
Unlock Deck
Unlock for access to all 103 flashcards in this deck.
Unlock Deck
k this deck
54
Suppose that an automobile manufacturer designed a radically new lightweight engine and wants
To recommend the grade of gasoline to use. The four grades are: below regular, regular, premium,
And super premium. The test car made three trial runs on the test track using each of the four
Grades. Is there a difference in the performance between the four grades of gas?
Using the printout given by Excel, what to you conclude?
A) Since the calculated F-value is smaller than the F-critical value, there is a difference in the performance of these four grades of gas.
B) Since the calculated F-value is smaller than the F-critical value, there is no significant difference in the performance of these four grades of gas.
C) Since the calculated F-value is larger than the F-critical value, there is no significant difference in the performance in the four grades of gas.
D) There is no significant difference in the performance of these four grades of gas as indicated by the calculated F-value being smaller than the F-critical value, and the P-value
Unlock Deck
Unlock for access to all 103 flashcards in this deck.
Unlock Deck
k this deck
55
The plant manager believes that the temperature in the packaging area of the plant affects the daily
Rate of production. To investigate, the plant temperature is set at 18 degrees, 20 degrees, and 22
Degrees. The number of units produced at each of these temperatures for a sample of days is
Collected.
Using this output, what conclusions can you draw?
A) The total size of the sample used was 24.
B) Since the P-value is 0.0024, there is a 2% chance of these results happening when there is no significant difference in the number of units produced at the three temperatures.
C) Since the calculated F-value is large, and the P-value is so small, there is strong evidence to suggest that the number of units produced at the three temperatures is all the same.
D) Since the calculated F-value is large, and the P-value is so small, there is strong evidence to suggest that the number of units produced at the three temperatures is not all the same.
Rate of production. To investigate, the plant temperature is set at 18 degrees, 20 degrees, and 22
Degrees. The number of units produced at each of these temperatures for a sample of days is
Collected.
Using this output, what conclusions can you draw?
A) The total size of the sample used was 24.
B) Since the P-value is 0.0024, there is a 2% chance of these results happening when there is no significant difference in the number of units produced at the three temperatures.
C) Since the calculated F-value is large, and the P-value is so small, there is strong evidence to suggest that the number of units produced at the three temperatures is all the same.
D) Since the calculated F-value is large, and the P-value is so small, there is strong evidence to suggest that the number of units produced at the three temperatures is not all the same.
Unlock Deck
Unlock for access to all 103 flashcards in this deck.
Unlock Deck
k this deck
56
Suppose a package delivery company purchased 14 trucks at the same time. Five trucks were
Purchased from manufacturer A, four from B and five from manufacturer C The cost of maintaining each truck was recorded. The company used ANOVA to test if the mean maintenance cost for
Trucks from each manufacturer were equal. To apply the F test, how many degrees of freedom are
In the denominator?
A) 2
B) 3
C) 11
D) 14
Unlock Deck
Unlock for access to all 103 flashcards in this deck.
Unlock Deck
k this deck
57
An electronics company wants to compare the quality of their cell phones to the cell phones from
Three competitors. They sample 10 phones from each company and count the number of defects for
Each phone. If ANOVA is used to compare the average number of defects, the treatments would be
Defined as:
A) the number of cell phones sampled.
B) the average number of defects.
C) the total number of phones.
D) the four companies.
Unlock Deck
Unlock for access to all 103 flashcards in this deck.
Unlock Deck
k this deck
58
Several employees have submitted different methods of assembling a product. Sample data for
Each method are:
How many treatments are there?
A) 3
B) 4
C) 12
D) 0
Each method are:
How many treatments are there?
A) 3
B) 4
C) 12
D) 0
Unlock Deck
Unlock for access to all 103 flashcards in this deck.
Unlock Deck
k this deck
59
A large department store examined a sample of the 18 credit card sales and recorded the amounts
Charged for each of three types of credit cards: MasterCard, Visa and American Express. Six
MasterCard sales, seven Visa and five American Express sales were recorded. The store used
ANOVA to test if the mean sales for each credit card were equal. What are the degrees of freedom
For the F statistic?
A) 18 in the numerator, 3 in the denominator.
B) 3 in the numerator, 18 in the denominator.
C) 2 in the numerator, 15 in the denominator.
D) 0 in the numerator, 15 in the denominator.
Unlock Deck
Unlock for access to all 103 flashcards in this deck.
Unlock Deck
k this deck
60
In an effort to determine the most effective way to teach safety principles to a group of employees,
Four different methods were tried. Some employees were given programmed instruction booklets
And worked through the course at their own pace. Other employees attended lectures. A third
Group watched a television presentation, and a fourth group was divided into small discussion
Groups. A high of 10 was possible. Samples of five tests were selected from each group. The test
Grade results were:
Excel's summary results at the 0.05 level produce the following output:
Using this output, what conclusions can you draw?
A) Since the calculated F-value is larger than the F-critical value, and the P-value is so small, there is strong evidence to suggest that all teaching methods give equal test results.
B) Since the calculated F-value is smaller than the F-critical value, there is a significant difference in the methods of teaching.
C) Since the calculated F-value is smaller than the F-critical value, there is no significant difference in the methods of teaching.
D) Since the P-value is 0.001, there is a 10% chance of these results happening when there is no significant difference in the methods of teaching.
E) Since the calculated F-value is larger than the F-critical value, and the P-value is so small,
there is strong evidence to suggest that all teaching methods do not give equal test
results
Unlock Deck
Unlock for access to all 103 flashcards in this deck.
Unlock Deck
k this deck
61
Using the MegaStat printout below to compare the mean annual incomes for executives with
Undergraduate and High School or less, the following statements can be made:
A) since the 95% confidence interval does not contain the value 0, there is no significant difference in the incomes of these two groups.
B) since the 95% confidence interval does not contain the value 0, there is a significant difference in the incomes of these two groups.
C) since the P-value is small, there is a strong chance of these results happening when there is no significant difference in the incomes of these two groups.
D) since the P-value is small, there is very little chance of these results happening when there is no significant difference in the incomes of these two groups-therefore those executives
With an undergraduate degree make more than their counterparts without.
E) since the 95% confidence interval does not contain the value 0, there is a significant difference in the incomes of these two groups; also, since the P-value is small, there is very
Undergraduate and High School or less, the following statements can be made:
A) since the 95% confidence interval does not contain the value 0, there is no significant difference in the incomes of these two groups.
B) since the 95% confidence interval does not contain the value 0, there is a significant difference in the incomes of these two groups.
C) since the P-value is small, there is a strong chance of these results happening when there is no significant difference in the incomes of these two groups.
D) since the P-value is small, there is very little chance of these results happening when there is no significant difference in the incomes of these two groups-therefore those executives
With an undergraduate degree make more than their counterparts without.
E) since the 95% confidence interval does not contain the value 0, there is a significant difference in the incomes of these two groups; also, since the P-value is small, there is very
Unlock Deck
Unlock for access to all 103 flashcards in this deck.
Unlock Deck
k this deck
62
A manufacturer of automobile transmissions uses three different processes. The management
Ordered a study of the production costs to see if there is a difference among the three processes. A
Summary of the findings is shown below.
What is the critical value of F at the 1% level of significance?
A) 99.46
B) 5.49
C) 5.39
D) 4.61
Ordered a study of the production costs to see if there is a difference among the three processes. A
Summary of the findings is shown below.
What is the critical value of F at the 1% level of significance?
A) 99.46
B) 5.49
C) 5.39
D) 4.61
Unlock Deck
Unlock for access to all 103 flashcards in this deck.
Unlock Deck
k this deck
63
A manufacturer of automobile transmissions uses three different processes. The management
Ordered a study of the production costs to see if there is a difference among the three processes. A
Summary of the findings is shown below.
What is the sum of squares for the treatment?
A) 67.80
B) 58.07
C) 149.34
D) 23.47
Ordered a study of the production costs to see if there is a difference among the three processes. A
Summary of the findings is shown below.
What is the sum of squares for the treatment?
A) 67.80
B) 58.07
C) 149.34
D) 23.47
Unlock Deck
Unlock for access to all 103 flashcards in this deck.
Unlock Deck
k this deck
64
i. If the computed value of F is 4.01 and the critical value is 2.67, we would conclude that all the
Population means are equal.
ii. Not rejecting the null hypothesis in ANOVA indicates that the population means are equal.
iii. The null hypothesis for an ANOVA is µ1 - µ2 = µ3.
A) (i), (ii), and (iii) are all correct statements.
B) (i) and (ii) are correct statements but not (iii).
C) (i) and (iii) are correct statements but not (ii).
D) (ii) and (iii) are correct statements but not (i).
E) (i), (ii), and (iii) are all false statements.
Unlock Deck
Unlock for access to all 103 flashcards in this deck.
Unlock Deck
k this deck
65
i. The alternate hypothesis for ANOVA states that not all the means are equal.
ii. For an ANOVA test, rejection of the null hypothesis does not identify which populations differ
Significantly.
iii. If the computed value of F is 4.01 and the critical value is 2.67, we would conclude that all the
Population means are equal.
A) (i), (ii), and (iii) are all correct statements.
B) (i) and (ii) are correct statements but not (iii).
C) (i) and (iii) are correct statements but not (ii).
D) (ii) and (iii) are correct statements but not (i).
E) (i), (ii), and (iii) are all false statements.
Unlock Deck
Unlock for access to all 103 flashcards in this deck.
Unlock Deck
k this deck
66
i. If the computed value of F is 4.01 and the critical value is 2.67, we would conclude that all the
Population means are equal.
ii. Rejecting the null hypothesis in ANOVA indicates that the population means are equal.
iii. The null hypothesis for an ANOVA is μ1 - μ2 ≠ μ3.
A) (i), (ii), and (iii) are all correct statements.
B) (i) and (ii) are correct statements but not (iii).
C) (i) and (iii) are correct statements but not (ii).
D) (ii) and (iii) are correct statements but not (i).
E) (i), (ii), and (iii) are all false statements.
Unlock Deck
Unlock for access to all 103 flashcards in this deck.
Unlock Deck
k this deck
67
Suppose we select 20 observations from each of five treatments. The appropriate degrees of
Freedom are:
A) 4 and 95
B) 5 and 20
C) 4 and 19
D) 4 and 20
Freedom are:
A) 4 and 95
B) 5 and 20
C) 4 and 19
D) 4 and 20
Unlock Deck
Unlock for access to all 103 flashcards in this deck.
Unlock Deck
k this deck
68
A manufacturer of automobile transmissions uses three different processes. The management
Ordered a study of the production costs to see if there is a difference among the three processes. A
Summary of the findings is shown below.
What are the total degrees of freedom?
A) 27
B) 28
C) 29
D) 30
Ordered a study of the production costs to see if there is a difference among the three processes. A
Summary of the findings is shown below.
What are the total degrees of freedom?
A) 27
B) 28
C) 29
D) 30
Unlock Deck
Unlock for access to all 103 flashcards in this deck.
Unlock Deck
k this deck
69
In a study of low tar cigarettes, five cigarettes from each of three brands were tested to see if the
Mean amount of tar per cigarette differs among the brands.
i. The F critical value for alpha = 0.05 is 3.89.
ii. If F calculated is 4.75, the decision if α = 0.05 is to reject H0.
iii. If the calculated F is 4.74, the decision if α = 0.01 is to not reject H0.
A) (i), (ii), and (iii) are all correct statements.
B) (i) and (ii) are correct statements but not (iii).
C) (i) and (iii) are correct statements but not (ii).
D) (ii) and (iii) are correct statements but not (i).
E) (i), (ii), and (iii) are all false statements.
Unlock Deck
Unlock for access to all 103 flashcards in this deck.
Unlock Deck
k this deck
70
A manufacturer of automobile transmissions uses three different processes. The management
Ordered a study of the production costs to see if there is a difference among the three processes. A
Summary of the findings is shown below.
What are the degrees of freedom for the numerator of the F ratio?
A) 2
B) 3
C) 10
D) 27
Ordered a study of the production costs to see if there is a difference among the three processes. A
Summary of the findings is shown below.
What are the degrees of freedom for the numerator of the F ratio?
A) 2
B) 3
C) 10
D) 27
Unlock Deck
Unlock for access to all 103 flashcards in this deck.
Unlock Deck
k this deck
71
A manufacturer of automobile transmissions uses three different processes. The management
Ordered a study of the production costs to see if there is a difference among the three processes. A
Summary of the findings is shown below.
What is the critical value of F at the 5% level of significance?
A) 19.45
B) 3.00
C) 3.35
D) 3.39
Ordered a study of the production costs to see if there is a difference among the three processes. A
Summary of the findings is shown below.
What is the critical value of F at the 5% level of significance?
A) 19.45
B) 3.00
C) 3.35
D) 3.39
Unlock Deck
Unlock for access to all 103 flashcards in this deck.
Unlock Deck
k this deck
72
A manufacturer of automobile transmissions uses three different processes. The management
Ordered a study of the production costs to see if there is a difference among the three processes. A
Summary of the findings is shown below.
What is the sum of squares of the error?
A) 67.80
B) 58.07
C) 149.34
D) 23.47
Ordered a study of the production costs to see if there is a difference among the three processes. A
Summary of the findings is shown below.
What is the sum of squares of the error?
A) 67.80
B) 58.07
C) 149.34
D) 23.47
Unlock Deck
Unlock for access to all 103 flashcards in this deck.
Unlock Deck
k this deck
73
i. For the population means, the alternate hypothesis used in the analysis of variance test states that
Μ1 = µ2 = µ3.
ii. For an ANOVA test, rejection of the null hypothesis does not identify which populations differ
Significantly.
iii. If the computed value of F is 4.01 and the critical value is 2.67, we would conclude that all the
Population means are equal.
A) (i), (ii), and (iii) are all correct statements.
B) (ii) is a correct statement but not (i) or (iii).
C) (iii) is a correct statements but not (i) or (ii).
D) (ii) and (iii) are correct statements but not (i).
E) (i), (ii), and (iii) are all false statements.
Unlock Deck
Unlock for access to all 103 flashcards in this deck.
Unlock Deck
k this deck
74
i. For the population means, the alternate hypothesis used in the analysis of variance test states that
Μ1 = µ2 = µ3.
ii. For an ANOVA test, rejection of the null hypothesis does not identify which populations differ
Significantly.
iii. Not rejecting the null hypothesis in ANOVA indicates that the population means are equal.
A) (i), (ii), and (iii) are all correct statements.
B) (i) and (ii) are correct statements but not (iii).
C) (i) and (iii) are correct statements but not (ii).
D) (ii) and (iii) are correct statements but not (i).
E) (i), (ii), and (iii) are all false statements.
Unlock Deck
Unlock for access to all 103 flashcards in this deck.
Unlock Deck
k this deck
75
Given the following Analysis of Variance table for three treatments each with six observations. What is the decision?
A) Reject H0-there is a difference in treatments.
B) Fail to reject H0-there is a difference in treatments.
C) Reject H0-there is a difference in errors.
D) Fail to reject H0-there is a difference in errors.
What is the decision?A) Reject H0-there is a difference in treatments.
B) Fail to reject H0-there is a difference in treatments.
C) Reject H0-there is a difference in errors.
D) Fail to reject H0-there is a difference in errors.
Unlock Deck
Unlock for access to all 103 flashcards in this deck.
Unlock Deck
k this deck
76
A manufacturer of automobile transmissions uses three different processes. The management
Ordered a study of the production costs to see if there is a difference among the three processes. A
Summary of the findings is shown below.
What are the degrees of freedom for the denominator?
A) 3
B) 10
C) 27
D) 30
Ordered a study of the production costs to see if there is a difference among the three processes. A
Summary of the findings is shown below.
What are the degrees of freedom for the denominator?
A) 3
B) 10
C) 27
D) 30
Unlock Deck
Unlock for access to all 103 flashcards in this deck.
Unlock Deck
k this deck
77
i. For an ANOVA test, rejection of the null hypothesis does not identify which populations differ
Significantly.
ii. Not rejecting the null hypothesis in ANOVA indicates that the population means are equal.
iii. The null hypothesis for an ANOVA is µ1 - µ2 = µ3.
A) (i), (ii), and (iii) are all correct statements.
B) (i) and (ii) are correct statements but not (iii).
C) (i) and (iii) are correct statements but not (ii).
D) (ii) and (iii) are correct statements but not (i).
E) (i), (ii), and (iii) are all false statements.
Unlock Deck
Unlock for access to all 103 flashcards in this deck.
Unlock Deck
k this deck
78
i. The alternate hypothesis for ANOVA states that not all the means are equal.
ii. Not rejecting the null hypothesis in ANOVA indicates that the population means are equal.
iii. The null hypothesis for an ANOVA is µ1 - µ2 = µ3.
A) (i), (ii), and (iii) are all correct statements.
B) (i) and (ii) are correct statements but not (iii).
C) (i) and (iii) are correct statements but not (ii).
D) (ii) and (iii) are correct statements but not (i).
E) (i), (ii), and (iii) are all false statements.
Unlock Deck
Unlock for access to all 103 flashcards in this deck.
Unlock Deck
k this deck
79
i. For the population means, the alternate hypothesis used in the analysis of variance test states that
Μ1 = µ2 = µ3.
ii. For an ANOVA test, rejection of the null hypothesis does not identify which populations differ
Significantly.
iii. The null hypothesis for an ANOVA is µ1 - µ2 = µ3.
A) (i), (ii), and (iii) are all correct statements.
B) (i) and (ii) are correct statements but not (iii).
C) (i) and (iii) are correct statements but not (ii).
D) (ii) and (iii) are correct statements but not (i).
E) (i), (ii), and (iii) are all false statements.
Unlock Deck
Unlock for access to all 103 flashcards in this deck.
Unlock Deck
k this deck
80
In a study of low tar cigarettes, five cigarettes from each of three brands were tested to see if the
Mean amount of tar per cigarette differs among the brands.
i. The F critical value for alpha = 0.05 is 3.74.
ii. If F calculated is 4.75, the decision if α = 0.05 is to reject H0.
iii. If the calculated F is 4.74, the decision if α = 0.01 is to reject H0.
A) (i), (ii), and (iii) are all correct statements.
B) (i) and (ii) are correct statements but not (iii).
C) (ii) is a correct statement but not (i) or (iii).
D) (ii) and (iii) are correct statements but not (i).
E) (i), (ii), and (iii) are all false statements.
Unlock Deck
Unlock for access to all 103 flashcards in this deck.
Unlock Deck
k this deck
Unlock Deck
Unlock for access to all 103 flashcards in this deck.


