Deck 25: Population and Evolutionary Genetics
Full screen (f)
Question
Question
Question
Question
Question
Question
Question
Question
Question
Question
Question
Question
Question
Question
Question
Question
Question
Question
Question
Question
Question
Question
Question
Question
Question
Question
Question
Question
Question
Question
Question
Question
Question
Question
Question
Shown below are two homologous lengths of the alpha and beta chains of human hemoglobin. Consult a genetic code dictionary (Figure) and determine how many amino acid substitutions may have occurred as a result of a single nucleotide substitution. For any that cannot occur as a result of a single change, determine the minimal mutational distance.

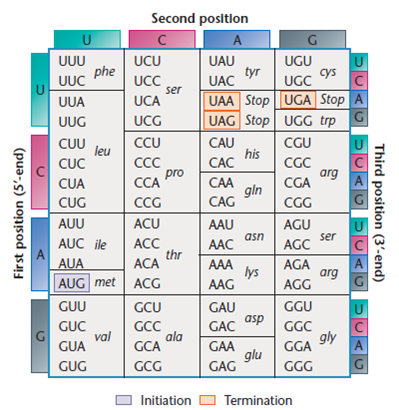
Figure. The coding dictionary. AUG encodes methionine which initiates most polypeptide chains. All other amino acids except tryptophan, which is encoded only by UGG, are represented by two to six triplets UAA, UAG, and UGA are termination signals and do not encode any amino acids.
Figure. The coding dictionary. AUG encodes methionine which initiates most polypeptide chains. All other amino acids except tryptophan, which is encoded only by UGG, are represented by two to six triplets UAA, UAG, and UGA are termination signals and do not encode any amino acids.
Question
Question
Comparisons of Neanderthal mitochondrial DNA with that of modern humans indicate that they are not related to modern humans and did not contribute to our mitochondrial heritage. However, because Neanderthals and modern humans are separated by at least 25,000 years, this does not rule out some forms of interbreeding causing the modern European gene pool to be derived from both Neanderthals and early humans (called Cro-Magnons). To resolve this question, Caramelli et al. (2003. Proc. Natl. Acad. Sci. [USA] 100: 6593-6597) analyzed mitochondrial DNA sequences from 25,000-year-old Cro-Magnon remains and compared them to four Neanderthal specimens and a large dataset derived from modern humans. The results are shown in the graph.
![Comparisons of Neanderthal mitochondrial DNA with that of modern humans indicate that they are not related to modern humans and did not contribute to our mitochondrial heritage. However, because Neanderthals and modern humans are separated by at least 25,000 years, this does not rule out some forms of interbreeding causing the modern European gene pool to be derived from both Neanderthals and early humans (called Cro-Magnons). To resolve this question, Caramelli et al. (2003. Proc. Natl. Acad. Sci. [USA] 100: 6593-6597) analyzed mitochondrial DNA sequences from 25,000-year-old Cro-Magnon remains and compared them to four Neanderthal specimens and a large dataset derived from modern humans. The results are shown in the graph. The x -axis represents the age of the specimens in thousands of years; the y -axis represents the average genetic distance. Modern humans are indicated by filled squares; Cro-Magnons, open squares; and Neanderthals, diamonds. (a) What can you conclude about the relationship between Cro-Magnons and modern Europeans? What about the relationship between Cro-Magnons and Neanderthals? (b) From these data, does it seem likely that Neanderthals made any mitochondrial DNA contributions to the Cro-Magnon gene pool or the modern European gene pool?<div style=padding-top: 35px>](https://storage.examlex.com/SM1220/11eb563d_4e81_dfa6_a8c8_37a5c5f9c932_SM1220_00.jpg)
The x -axis represents the age of the specimens in thousands of years; the y -axis represents the average genetic distance. Modern humans are indicated by filled squares; Cro-Magnons, open squares; and Neanderthals, diamonds.
(a) What can you conclude about the relationship between Cro-Magnons and modern Europeans? What about the relationship between Cro-Magnons and Neanderthals?
(b) From these data, does it seem likely that Neanderthals made any mitochondrial DNA contributions to the Cro-Magnon gene pool or the modern European gene pool?

Unlock Deck
Sign up to unlock the cards in this deck!
Unlock Deck
Unlock Deck
1/37
Play
Full screen (f)
Deck 25: Population and Evolutionary Genetics
1
A newborn screening program identified a baby with a rare autosomal recessive disorder called arginosuccinic aciduria (AGA), which causes high levels of ammonia to accumulate in the blood. Symptoms usually appear in the first week after birth and can progress to include severe liver damage, developmental delay, and mental retardation. AGA occurs with a frequency of about 1 in 70,000 births. There is no history of this disorder in either the father's or mother's family. The above case raises several questions:
Since it appears that the unaffected parents are heterozygotes, would it be considered unusual that there would be no family history of the disorder? How would they be counseled about risks to future children?
Since it appears that the unaffected parents are heterozygotes, would it be considered unusual that there would be no family history of the disorder? How would they be counseled about risks to future children?
Since the parents were both heterozygotes, it is not unusual that there was no family history of the disorder. Both families could have been carriers of arginosucciate aciduria and no offspring were homologous for the disease, so there was no affect offspring.
To know the chance that their future child will have this disease, we must do a punnett square. In the table shown, "A" stands for the dominant allele and "a" stands for the recessive allele. The top of will have "Aa", because the mother is heterozygous. Down the side, it will have "Aa" because the father is also heterozygous. According to the punnett square, is one out of four showing homozygous recessive. The genetic councilor would tell the parents that there is a 25 percent chance for each future child would get the disease. In other words, we treat each child as a separate event and each time a child is born there is a 25 percent chance that child will have the disease.
To know the chance that their future child will have this disease, we must do a punnett square. In the table shown, "A" stands for the dominant allele and "a" stands for the recessive allele. The top of will have "Aa", because the mother is heterozygous. Down the side, it will have "Aa" because the father is also heterozygous.
According to the punnett square, is one out of four showing homozygous recessive. The genetic councilor would tell the parents that there is a 25 percent chance for each future child would get the disease. In other words, we treat each child as a separate event and each time a child is born there is a 25 percent chance that child will have the disease. 2
Population geneticists study changes in the nature and amount of genetic variation in populations, the distribution of different genotypes, and how forces such as selection and drift act on genetic variation to bring about evolutionary change in populations and the formation of new species. From the explanation given in the chapter, what answers would you propose to the following fundamental questions?
(a) How do we know how much genetic variation is in a population?
(b) How do geneticists detect the presence of genetic variation as different alleles in a population?
(c) How do we know whether the genetic structure of a population is static or dynamic?
(d) How do we know when populations have diverged to the point that they form two different species?
(e) How do we know the age of the last common ancestor shared by two species?
The percentage of genetic variation in a population can be observed by analyzing the levels of amino acid and nucleotides in the genes. It is also possible to identify genetic variation by observing phenotypic variations in a population.
Geneticists detect genetic variation by considering order of bases in the nucleotides in genes and by identifying variation levels of enzymes through the process of protein electrophoresis.
(c)
Genetic structure of a population is always dynamic, which is brought by the mechanism of genetic variation.
(d)The genetic divergence can be identified at the point at which the gene flow between two species is decreased, by which one population may no longer interbreed with other group of species.
The divergence of population reflects the action of natural selection and genetic drift. The genetic variation in the group of species may carry considerable differences in alleles or allele frequencies at different loci of the chromosome. The allele frequencies will be homogenized among the species during migration of individuals between the populations. The emergence of migration leads to genetic divergence in the population.
(e)The analysis of mitochondrial Deoxyribonucleic acid (DNA) is useful to determine the last common ancestor shared by two divergent species.
3
A newborn screening program identified a baby with a rare autosomal recessive disorder called arginosuccinic aciduria (AGA), which causes high levels of ammonia to accumulate in the blood. Symptoms usually appear in the first week after birth and can progress to include severe liver damage, developmental delay, and mental retardation. AGA occurs with a frequency of about 1 in 70,000 births. There is no history of this disorder in either the father's or mother's family. The above case raises several questions:
If the disorder is so rare, what is the frequency of heterozygous carriers in the population?
If the disorder is so rare, what is the frequency of heterozygous carriers in the population?
To find the frequency of heterozygous carriers in a population, we assume the population is in Hardy-Weinberg equilibrium and use the Hardy-Weinberg equation to solve for frequency of carriers.  We know the frequence of homozygotes in the population, which is 1 in 70,000. However, we need to find the frequency of just the recessive allele. "q" stands for the frequency of recessive allele in the equation.
  Then, since p+q=1 we can find the frequency of the dominant allele.
  Now we can estimate the frequency of carriers.
  Therefore the frequency of carriers in the population is about 1 in 740.
We know the frequence of homozygotes in the population, which is 1 in 70,000. However, we need to find the frequency of just the recessive allele. "q" stands for the frequency of recessive allele in the equation. Then, since p+q=1 we can find the frequency of the dominant allele. Now we can estimate the frequency of carriers. Therefore the frequency of carriers in the population is about 1 in 740. 4
Read the Chapter Concepts list on page 647. All these pertain to the principles of population genetics and the evolution of species. Write a short essay describing the roles of mutation, migration, and selection in bringing about speciation.
▪Most populations and species harbor considerable genetic variation.
▪Th is variation is reflected in the alleles distributed among populations of a species.
▪The relationship between allele frequencies and genotype frequencies in an ideal population is described by the Hardy-Weinberg law.
▪Selection, migration, and genetic drift can cause changes in allele frequency.
▪Mutation creates new alleles and changes allele frequencies only in very small populations.
▪Nonrandom mating changes population genotype frequency but does not change allele frequency.
▪A reduction in gene flow between populations, accompanied by selection or genetic drift, can lead to reproductive isolation and speciation.
▪Genetic differences between populations or species are used to reconstruct evolutionary history.
Unlock Deck
Unlock for access to all 37 flashcards in this deck.
Unlock Deck
k this deck
5
A newborn screening program identified a baby with a rare autosomal recessive disorder called arginosuccinic aciduria (AGA), which causes high levels of ammonia to accumulate in the blood. Symptoms usually appear in the first week after birth and can progress to include severe liver damage, developmental delay, and mental retardation. AGA occurs with a frequency of about 1 in 70,000 births. There is no history of this disorder in either the father's or mother's family. The above case raises several questions:
What are the chances that two heterozygotes will meet and have an affected child?
What are the chances that two heterozygotes will meet and have an affected child?
Unlock Deck
Unlock for access to all 37 flashcards in this deck.
Unlock Deck
k this deck
6
Price et al. (1999. J. Bacteriol. 181: 2358-2362) conducted a genetic study of the toxin transport protein (PA) of Bacillus anthracis, the bacterium that causes anthrax in humans. Within the 2294-nucleotide gene in 26 strains they identified five point mutations-two missense and three synonyms-among different isolates. Necropsy samples from an anthrax outbreak in 1979 revealed a novel missense mutation and five unique nucleotide changes among ten victims. The authors concluded that these data indicate little or no horizontal transfer between different B. anthracis strains.
(a) Which types of nucleotide changes (missense or synonyms) cause amino acid changes?
(b) What is meant by horizontal transfer?
(c) On what basis did the authors conclude that evidence of horizontal transfer is absent from their data?
(a) Which types of nucleotide changes (missense or synonyms) cause amino acid changes?
(b) What is meant by horizontal transfer?
(c) On what basis did the authors conclude that evidence of horizontal transfer is absent from their data?
Unlock Deck
Unlock for access to all 37 flashcards in this deck.
Unlock Deck
k this deck
7
The genetic difference between two Drosophila species, D. heteroneura and D. sylvestris , as measured by nucleotide diversity, is about 1.8 percent. The difference between chimpanzees ( P. troglodytes ) and humans ( H. sapiens ) is about the same, yet the latter species are classified in different genera. In your opinion, is this valid? Explain why.
Unlock Deck
Unlock for access to all 37 flashcards in this deck.
Unlock Deck
k this deck
8
The use of nucleotide sequence data to measure genetic variability is complicated by the fact that the genes of higher eukaryotes are complex in organization and contain 5 ' and 3 ' flanking regions as well as introns. Researchers have compared the nucleotide sequence of two cloned alleles of the y-globin gene from a single individual and found a variation of 1 percent. Those differences include 13 substitutions of one nucleotide for another and 3 short DNA segments that have been inserted in one allele or deleted in the other. None of the changes takes place in the gene's exons (coding regions). Why do you think this is so, and should it change our concept of genetic variation?
Unlock Deck
Unlock for access to all 37 flashcards in this deck.
Unlock Deck
k this deck
9
The ability to taste the compound PTC is controlled by a dominant allele T , while individuals homozygous for the recessive allele t are unable to taste PTC. In a genetics class of 125 students, 88 can taste PTC and 37 cannot. Calculate the frequency of the T and t alleles and the frequency of the genotypes in this population.
Unlock Deck
Unlock for access to all 37 flashcards in this deck.
Unlock Deck
k this deck
10
Consider rare disorders in a population caused by an autosomal recessive mutation. From the frequencies of the disorder in the population given, calculate the percentage of heterozygous carriers:
(a) 0.0064
(b) 0.000081
(c) 0.09
(d) 0.01
(e) 0.10
(a) 0.0064
(b) 0.000081
(c) 0.09
(d) 0.01
(e) 0.10
Unlock Deck
Unlock for access to all 37 flashcards in this deck.
Unlock Deck
k this deck
11
What must be assumed in order to validate the answers in Problem?
Consider rare disorders in a population caused by an autosomal recessive mutation. From the frequencies of the disorder in the population given, calculate the percentage of heterozygous carriers:
(a) 0.0064
(b) 0.000081
(c) 0.09
(d) 0.01
(e) 0.10
Consider rare disorders in a population caused by an autosomal recessive mutation. From the frequencies of the disorder in the population given, calculate the percentage of heterozygous carriers:
(a) 0.0064
(b) 0.000081
(c) 0.09
(d) 0.01
(e) 0.10
Unlock Deck
Unlock for access to all 37 flashcards in this deck.
Unlock Deck
k this deck
12
In a population where only the total number of individuals with the dominant phenotype is known, how can you calculate the percentage of carriers and homozygous recessives?
Unlock Deck
Unlock for access to all 37 flashcards in this deck.
Unlock Deck
k this deck
13
Determine whether the following two sets of data represent populations that are in Hardy-Weinberg equilibrium (use chi-square analysis if necessary):
(a) CCR5 genotypes: 1 / 1 , 60 percent; 1 /? 32 , 35.1 percent; ? 32 /? 32 , 4.9 percent
(b) Sickle-cell hemoglobin: AA , 75.6 percent; AS 24.2 percent; SS 0.2 percent
(a) CCR5 genotypes: 1 / 1 , 60 percent; 1 /? 32 , 35.1 percent; ? 32 /? 32 , 4.9 percent
(b) Sickle-cell hemoglobin: AA , 75.6 percent; AS 24.2 percent; SS 0.2 percent
Unlock Deck
Unlock for access to all 37 flashcards in this deck.
Unlock Deck
k this deck
14
If 4 percent of a population in equilibrium expresses a recessive trait, what is the probability that the offspring of two individuals who do not express the trait will express it?
Unlock Deck
Unlock for access to all 37 flashcards in this deck.
Unlock Deck
k this deck
15
Consider a population in which the frequency of allele A is p = 0.7 and the frequency of allele a is q = 0.3, and where the alleles are codominant. What will be the allele frequencies after one generation if the following occurs?
(a) w AA = 1, w Aa = 0.9, w aa = 0.8
(b) w AA = 1, w Aa = 0.95, w aa = 0.9
(c) w AA = 1, w Aa = 0.99, w aa = 0.98
(d) w AA = 0.8, w Aa = 1, w aa = 0.8
(a) w AA = 1, w Aa = 0.9, w aa = 0.8
(b) w AA = 1, w Aa = 0.95, w aa = 0.9
(c) w AA = 1, w Aa = 0.99, w aa = 0.98
(d) w AA = 0.8, w Aa = 1, w aa = 0.8
Unlock Deck
Unlock for access to all 37 flashcards in this deck.
Unlock Deck
k this deck
16
If the initial allele frequencies are p = 0.5 and q = 0.5 and allele a is a lethal recessive, what will be the frequencies after 1, 5, 10, 25, 100, and 1000 generations?
Unlock Deck
Unlock for access to all 37 flashcards in this deck.
Unlock Deck
k this deck
17
Under what circumstances might a lethal dominant allele persist in a population?
Unlock Deck
Unlock for access to all 37 flashcards in this deck.
Unlock Deck
k this deck
18
Assume that a recessive autosomal disorder occurs in 1 of 10,000 individuals (0.0001) in the general population and that in this population about 2 percent (0.02) of the individuals are carriers for the disorder. Estimate the probability of this disorder occurring in the offspring of a marriage between first cousins. Compare this probability to the population at large.
Unlock Deck
Unlock for access to all 37 flashcards in this deck.
Unlock Deck
k this deck
19
One of the first Mendelian traits identified in humans was a dominant condition known as brachydactyly. This gene causes an abnormal shortening of the fingers or toes (or both). At the time, some researchers thought that the dominant trait would spread until 75 percent of the population would be affected (because the phenotypic ratio of dominant to recessive is 3:1). Show that the reasoning was incorrect.
Unlock Deck
Unlock for access to all 37 flashcards in this deck.
Unlock Deck
k this deck
20
Describe how populations with substantial genetic differences can form. What is the role of natural selection?
Unlock Deck
Unlock for access to all 37 flashcards in this deck.
Unlock Deck
k this deck
21
Achondroplasia is a dominant trait that causes a characteristic form of dwarfism. In a survey of 50,000 births, five infants with achondroplasia were identified. Three of the affected infants had affected parents, while two had normal parents. Calculate the mutation rate for achondroplasia and express the rate as the number of mutant genes per given number of gametes.
Unlock Deck
Unlock for access to all 37 flashcards in this deck.
Unlock Deck
k this deck
22
A recent study examining the mutation rates of 5669 mammalian genes (17,208 sequences) indicates that, contrary to popular belief, mutation rates among lineages with vastly different generation lengths and physiological attributes are remarkably constant (Kumar, S., and Subramanian, S. 2002. Proc. Natl. Acad. Sci. [USA] 99: 803-808). The average rate is estimated at 12.2 × 10 -9 per bp per year. What is the significance of this finding in terms of mammalian evolution?
Unlock Deck
Unlock for access to all 37 flashcards in this deck.
Unlock Deck
k this deck
23
What are considered significant factors in maintaining the surprisingly high levels of genetic variation in natural populations?
Unlock Deck
Unlock for access to all 37 flashcards in this deck.
Unlock Deck
k this deck
24
A botanist studying water lilies in an isolated pond observed three leaf shapes in the population: round, arrowhead, and scalloped. Marker analysis of DNA from 125 individuals showed the round-leaf plants to be homozygous for allele r1 , while the plants with arrowhead leaves were homozygous for a different allele at the same locus, r2. Plants with scalloped leaves showed DNA profiles with both the r1 and r2 alleles. Frequency of the r1 allele was estimated at 0.81. If the botanist counted 20 plants with scalloped leaves in the pond, what is the inbreeding coefficient F for this population?
Unlock Deck
Unlock for access to all 37 flashcards in this deck.
Unlock Deck
k this deck
25
A farmer plants transgenic Bt corn that is genetically modified to produce its own insecticide. Of the corn borer larvae feeding on these Bt crop plants, only 10 percent survive unless they have at least one copy of the dominant resistance allele B that confers resistance to the Bt insecticide. When the farmer first plants Bt corn, the frequency of the B resistance allele in the corn borer population is 0.02. What will be the frequency of the resistance allele after one generation of corn borers fed on Bt corn?
Unlock Deck
Unlock for access to all 37 flashcards in this deck.
Unlock Deck
k this deck
26
In an isolated population of desert bighorn sheep, a mutant recessive allele c when homozygous causes curled coats in both males and females. The normal dominant allele C produces straight coats. A biologist studying these sheep counts four with curled coats. She also takes blood samples from the population for DNA analysis, which reveals that 17 of the sheep are heterozygous carriers of the c allele. What is the inbreeding coefficient F for this population?
Unlock Deck
Unlock for access to all 37 flashcards in this deck.
Unlock Deck
k this deck
27
To increase genetic diversity in the bighorn sheep population described in Problem, ten sheep are introduced from a population where the c allele is absent. Assuming that random mating occurs between the original and the introduced sheep, and that the c allele is selectively neutral, what will be the frequency of c in the next generation?
In an isolated population of desert bighorn sheep, a mutant recessive allele c when homozygous causes curled coats in both males and females. The normal dominant allele C produces straight coats. A biologist studying these sheep counts four with curled coats. She also takes blood samples from the population for DNA analysis, which reveals that 17 of the sheep are heterozygous carriers of the c allele. What is the inbreeding coefficient F for this population?
In an isolated population of desert bighorn sheep, a mutant recessive allele c when homozygous causes curled coats in both males and females. The normal dominant allele C produces straight coats. A biologist studying these sheep counts four with curled coats. She also takes blood samples from the population for DNA analysis, which reveals that 17 of the sheep are heterozygous carriers of the c allele. What is the inbreeding coefficient F for this population?
Unlock Deck
Unlock for access to all 37 flashcards in this deck.
Unlock Deck
k this deck
28
What genetic changes take place during speciation?
Unlock Deck
Unlock for access to all 37 flashcards in this deck.
Unlock Deck
k this deck
29
Some critics have warned that the use of gene therapy to correct genetic disorders will affect the course of human evolution. Evaluate this criticism in light of what you know about population genetics and evolution, distinguishing between somatic gene therapy and germ-line gene therapy.
Unlock Deck
Unlock for access to all 37 flashcards in this deck.
Unlock Deck
k this deck
30
A form of dwarfism known as Ellis-van Creveld syndrome was first discovered in the late 1930s, when Richard Ellis and Simon van Creveld shared a train compartment on the way to a pediatrics meeting. In the course of conversation, they discovered that they each had a patient with this syndrome. They published a description of the syndrome in 1940. Affected individuals have a short-limbed form of dwarfism and often have defects of the lips and teeth, and polydactyly (extra fingers). The largest pedigree for the condition was reported in an Old Order Amish population in eastern Pennsylvania by Victor McKusick and his colleagues (1964). In that community, about 5 per 1000 births are affected, and in the population of 8000, the observed frequency is 2 per 1000. All affected individuals have unaffected parents, and all affected cases can trace their ancestry to Samuel King and his wife, who arrived in the area in 1774. It is known that neither King nor his wife was affected with the disorder. There are no cases of the disorder in other Amish communities, such as those in Ohio or Indiana.
(a) From the information provided, derive the most likely mode of inheritance of this disorder. Using the Hardy-Weinberg law, calculate the frequency of the mutant allele in the population and the frequency of heterozygotes, assuming Hardy-Weinberg conditions.
(b) What is the most likely explanation for the high frequency of the disorder in the Pennsylvania Amish community and its absence in other Amish communities?
Unlock Deck
Unlock for access to all 37 flashcards in this deck.
Unlock Deck
k this deck
31
List the barriers that prevent interbreeding and give an example of each.
Unlock Deck
Unlock for access to all 37 flashcards in this deck.
Unlock Deck
k this deck
32
What are the two groups of reproductive isolating mechanisms? Which of these is regarded as more efficient, and why?
Unlock Deck
Unlock for access to all 37 flashcards in this deck.
Unlock Deck
k this deck
33
The original source of new alleles, upon which selection operates, is mutation, a random event that occurs without regard to selectional value in the organism. Although many model organisms have been used to study mutational events in populations, some investigators have developed abiotic molecular models. Soll (2006) examined one such model to study the relationship between both deleterious and advantageous mutations and population size in a ligase molecule composed of RNA (a ribozyme). Soll found that the smaller the population of molecules, the more likely it was that not only deleterious mutations but also advantageous mutations would disappear. Why would population size influence the survival of both types of mutations (deleterious and advantageous) in populations?
Unlock Deck
Unlock for access to all 37 flashcards in this deck.
Unlock Deck
k this deck
34
A number of comparisons of nucleotide sequences among hom-inids and rodents indicate that inbreeding may have occurred more in hominid than in rodent ancestry. When an ancient population bottleneck leaving approximately 10,000 individuals occurred in humans, Knight (2005) and Bakewell (2007) both suggested that this event may have left early humans with a greater chance of genetic disease. Why would a population bottleneck influence the frequency of genetic disease?
Unlock Deck
Unlock for access to all 37 flashcards in this deck.
Unlock Deck
k this deck
35
Shown below are two homologous lengths of the alpha and beta chains of human hemoglobin. Consult a genetic code dictionary (Figure) and determine how many amino acid substitutions may have occurred as a result of a single nucleotide substitution. For any that cannot occur as a result of a single change, determine the minimal mutational distance.
Figure. The coding dictionary. AUG encodes methionine which initiates most polypeptide chains. All other amino acids except tryptophan, which is encoded only by UGG, are represented by two to six triplets UAA, UAG, and UGA are termination signals and do not encode any amino acids.
Figure. The coding dictionary. AUG encodes methionine which initiates most polypeptide chains. All other amino acids except tryptophan, which is encoded only by UGG, are represented by two to six triplets UAA, UAG, and UGA are termination signals and do not encode any amino acids.
Unlock Deck
Unlock for access to all 37 flashcards in this deck.
Unlock Deck
k this deck
36
Recent reconstructions of evolutionary history are often dependent on assigning divergence in terms of changes in amino acid or nucleotide sequences. For example, a comparison of cytochrome c shows 10 amino acid differences between humans and dogs, 24 differences between humans and moths, and 38 differences between humans and yeast. Such data provide no information as to the absolute times of divergence for humans, dogs, moths, and yeast. How might one calibrate the molecular clock to an absolute time clock? What problems might one encounter in such a calibration?
Unlock Deck
Unlock for access to all 37 flashcards in this deck.
Unlock Deck
k this deck
37
Comparisons of Neanderthal mitochondrial DNA with that of modern humans indicate that they are not related to modern humans and did not contribute to our mitochondrial heritage. However, because Neanderthals and modern humans are separated by at least 25,000 years, this does not rule out some forms of interbreeding causing the modern European gene pool to be derived from both Neanderthals and early humans (called Cro-Magnons). To resolve this question, Caramelli et al. (2003. Proc. Natl. Acad. Sci. [USA] 100: 6593-6597) analyzed mitochondrial DNA sequences from 25,000-year-old Cro-Magnon remains and compared them to four Neanderthal specimens and a large dataset derived from modern humans. The results are shown in the graph.
The x -axis represents the age of the specimens in thousands of years; the y -axis represents the average genetic distance. Modern humans are indicated by filled squares; Cro-Magnons, open squares; and Neanderthals, diamonds.
(a) What can you conclude about the relationship between Cro-Magnons and modern Europeans? What about the relationship between Cro-Magnons and Neanderthals?
(b) From these data, does it seem likely that Neanderthals made any mitochondrial DNA contributions to the Cro-Magnon gene pool or the modern European gene pool?
Unlock Deck
Unlock for access to all 37 flashcards in this deck.
Unlock Deck
k this deck
Unlock Deck
Unlock for access to all 37 flashcards in this deck.


