Deck 27: Evolutionary Genetics
Full screen (f)
Question
Question
Question
Question
Question
Question
Question
Question
Question
Question
Question
Question
Question
Question
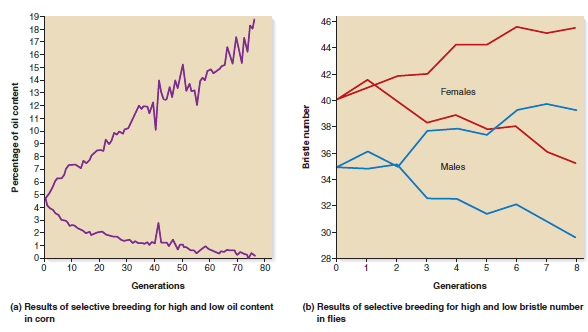
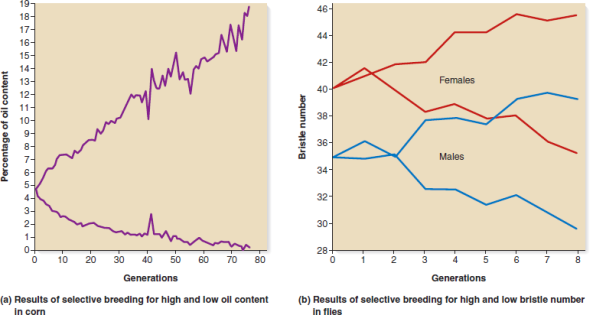
When artificial selection is practiced over many generations, it is common for the trait to reach a plateau in which further selection has little effect on the outcome of the trait. This phenomenon is illustrated in Figure 27.11. Explain why.FIGURE 27.11 Common results of selective breeding for a quantitative trait.
Question
Question
Question
Question
Question
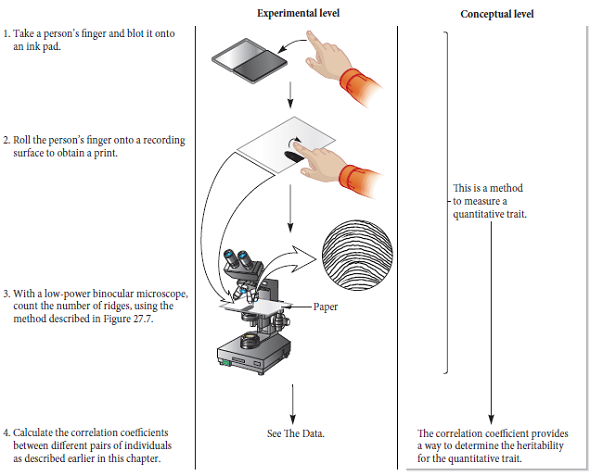
A danger in computing heritability values from studies involving genetically related individuals is the possibility that these individuals share more similar environments than do unrelated individuals. In the experiment of Figure 27.8, which data are the most compelling evidence that ridge count is not caused by genetically related individuals sharing common environments Explain.FIGURE 27.8 Heritability of human fingerprint patterns.
Starting material: A group of human subjects from Great Britain.
Starting material: A group of human subjects from Great Britain.
Question
Question
Question
Question
Question
Question
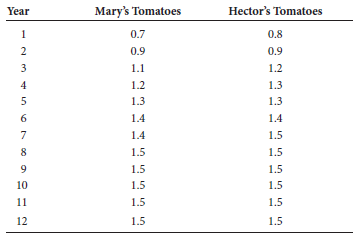
A large, genetically heterogeneous group of tomato plants was used as the original breeding stock by two different breeders, named Mary and Hector. Each breeder was given 50 seeds and began an artificial selection strategy, much like the one described in Figure 27.11. The seeds were planted, and the breeders selected the 10 plants with the highest mean tomato weights as the breeding stock for the next generation. This process was repeated over the course of 12 growing seasons, and the following data were obtained:
Mean Weight of Tomatoes (pounds)
a. Explain these results
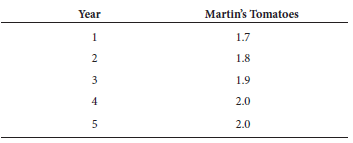
b. Another tomato breeder, named Martin, got some seeds from Mary's and Hector's tomato strains (after 12 generations), grew the plants, and then crossed them to each other. The mean weight of the tomatoes in these hybrids was about 1.7 pounds. For a period of 5 years, Martin subjected these hybrids to the same experimental strategy that Mary and Hector had followed, and he obtained the following results:
Mean Weight of Tomatoes (pounds)
a.
Explain Martin's data. Why was Martin able to obtain tomatoes heavier than 1.5 pounds, whereas Mary's and Hector's strains appeared to plateau at this weight
FIGURE 27.11 Common results of selective breeding for a quantitative trait.
Mean Weight of Tomatoes (pounds)
a. Explain these results
b. Another tomato breeder, named Martin, got some seeds from Mary's and Hector's tomato strains (after 12 generations), grew the plants, and then crossed them to each other. The mean weight of the tomatoes in these hybrids was about 1.7 pounds. For a period of 5 years, Martin subjected these hybrids to the same experimental strategy that Mary and Hector had followed, and he obtained the following results:
Mean Weight of Tomatoes (pounds)
a.
Explain Martin's data. Why was Martin able to obtain tomatoes heavier than 1.5 pounds, whereas Mary's and Hector's strains appeared to plateau at this weight
FIGURE 27.11 Common results of selective breeding for a quantitative trait.
Question
Question
Question
Question
Question
Question
Question
Question
Question
Question
Question
Question
Question
Question
Question
Question
Question
Question
Question
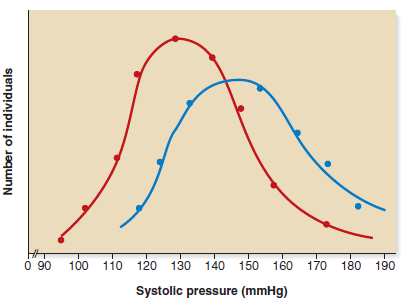
The trait of blood pressure in humans has a frequency distribution that is similar to a normal distribution. The following graph shows the ranges of blood pressures for a selected population of people. The red line depicts the frequency distribution of the systolic pressures for the entire population. Several individuals with high blood pressure were identified, and the blood pressures of their relatives were determined. This frequency distribution is depicted with a blue line. (Note: The blue line does not include the people who were identified with high blood pressure; it includes only their relatives.)
Question
Question
Here are data for height and weight among 10 male college students. 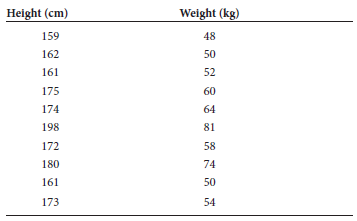
a. Calculate the correlation coefficients for this group
b. Is the correlation coefficient statistically significant Explain.
a. Calculate the correlation coefficients for this group
b. Is the correlation coefficient statistically significant Explain.
Question
Question
Question
Question
Question
Question
Question

Unlock Deck
Sign up to unlock the cards in this deck!
Unlock Deck
Unlock Deck
1/53
Play
Full screen (f)
Deck 27: Evolutionary Genetics
1
At the molecular level, explain why quantitative traits often exhibit a continuum of phenotypes within a population. How does the environment help produce this continuum
Environment also helps to produce continuum of phenotypic variation. When the environment effect is low on a trait, we can categorise the phenotypes of individuals into discrete genotypic classes, because, the phenotypic variation in this is only due to genetic variation with in group of individuals. But, it is difficult to categorise them when the effect of environment is high because of overlapping of one's phenotype with the phenotype of the other individual with in a group. Instead, the trait shows a continuum of phenotypic variation.
2
What does it mean when a correlation coefficient is negative Can you think of examples
When a correlation coefficient is negative, it means there is an opposite correlation between the two variables. That is, if one variable value increases then the other value of variable decreases and vice-versa.Example: if size of pistil increases in number of reproductive organs decrease in Thalictrum dioicum flowers.Some plants growing in desserts, the decrease the number and size of leaves leads to increase in water use efficiency.
3
What is the difference between broad-sense heritability and narrow-sense heritability Why is narrow-sense heritability such a useful concept in the field of agricultural genetics
Difference between broad sense heritability and narrow sense heritability:
Explanation:
Broad sense heritability takes all the genetic factors that affect the phenotype of a trait into account. But, in narrow sense heritability only additive alleles that affect the phenotype of a trait is considered.
Narrow-sense heritability exhibits the extent of variation that is passed from parent to offspring in a population. The alteration in between the population and selected parents is greater, if narrow-sense heritability (h 2 ) is greater.
Similarly, narrow sense heritability is useful because the phenotypic variation of a trait is due to the effect of additive alleles. So, it is predicted that the phenotype off-spring in selective breeding.
4
For selective breeding to be successful, the starting population must
A) have genetic variation that affects the trait of interest
B) be very large
C) be amenable to phenotypic variation caused by environmental effects
D) have very little phenotypic variation.
A) have genetic variation that affects the trait of interest
B) be very large
C) be amenable to phenotypic variation caused by environmental effects
D) have very little phenotypic variation.
Unlock Deck
Unlock for access to all 53 flashcards in this deck.
Unlock Deck
k this deck
5
The abdomen length (in millimeters) was measured in 15 male Drosophila, and the following data were obtained: 1.9, 2.4, 2.1, 2.0, 2.2, 2.4, 1.7, 1.8, 2.0, 2.0, 2.3, 2.1, 1.6, 2.3, and 2.2. Calculate the mean, standard deviation, and variance for this population of male fruit flies.
Unlock Deck
Unlock for access to all 53 flashcards in this deck.
Unlock Deck
k this deck
6
In a strain of mice, the average 6-week body weight is 25 g and the narrow-sense heritability for this trait is 0.21
a. What would be the average weight of the offspring if parents with a mean weight of 27 g were chosen
B. What weight of parents would you have to choose to obtain offspring with an average weight of 26.5 g
a. What would be the average weight of the offspring if parents with a mean weight of 27 g were chosen
B. What weight of parents would you have to choose to obtain offspring with an average weight of 26.5 g
Unlock Deck
Unlock for access to all 53 flashcards in this deck.
Unlock Deck
k this deck
7
The heritability for egg weight in a group of chickens on a farm in Maine is 0.95. Are the following statements regarding heritability true or false If a statement is false, explain why
a. The environment in Maine has very little effect on the outcome of this trait
b. Nearly all of the phenotypic variance for this trait in this group of chickens is due to genetic variance
c. The trait is polygenic and likely to involve a large number of genes
d. Based on the observation of the heritability in the Maine chickens, it is reasonable to conclude that the heritability for egg weight in a group of chickens on a farm in Montana is also very high.
Unlock Deck
Unlock for access to all 53 flashcards in this deck.
Unlock Deck
k this deck
8
The mean weight of cows in a population is 520 kg. Animals with a mean weight of 540 kg are used as parents and produce offspring that have a mean weight of 535 kg. What is the narrow-sense heritability ( h N 2 ) for body weight in this population of cows
A) 0.25
B) 0.5
C) 0.75
D) 1.0
A) 0.25
B) 0.5
C) 0.75
D) 1.0
Unlock Deck
Unlock for access to all 53 flashcards in this deck.
Unlock Deck
k this deck
9
From a biological viewpoint, speculate as to why many traits seem to fit a normal distribution. Students with a strong background in math and statistics may want to explain how a normal distribution is generated, and what it means. Can you think of biological examples that do not fit a normal distribution
Unlock Deck
Unlock for access to all 53 flashcards in this deck.
Unlock Deck
k this deck
10
When a correlation coefficient is statistically significant, what do you conclude about the two variables What do the results mean with regard to cause and effect
Unlock Deck
Unlock for access to all 53 flashcards in this deck.
Unlock Deck
k this deck
11
In a fairly large population of people living in a commune in the southern United States, everyone cares about good nutrition. All of the members of this population eat very nutritious foods, and their diets are very similar. How do you think the height of individuals in this commune population would compare with that of the general population in the following categories
a. Mean height
B. Heritability for height
C. Genetic variation for alleles that affect height
a. Mean height
B. Heritability for height
C. Genetic variation for alleles that affect height
Unlock Deck
Unlock for access to all 53 flashcards in this deck.
Unlock Deck
k this deck
12
What is a normal distribution Discuss this curve with regard to quantitative traits within a population. What is the relationship between the standard deviation and the normal distribution
Unlock Deck
Unlock for access to all 53 flashcards in this deck.
Unlock Deck
k this deck
13
You need to understand solved problem S5 before answering this question. The variance in height for fathers (in square inches) was 112, the variance for sons was 122, and the covariance was 144. The mean height for fathers was 68 inches, and the mean height for sons was 69 inches. If a father had a height of 70 inches, what is the most probable height of his son
Unlock Deck
Unlock for access to all 53 flashcards in this deck.
Unlock Deck
k this deck
14
When artificial selection is practiced over many generations, it is common for the trait to reach a plateau in which further selection has little effect on the outcome of the trait. This phenomenon is illustrated in Figure 27.11. Explain why.FIGURE 27.11 Common results of selective breeding for a quantitative trait.
Unlock Deck
Unlock for access to all 53 flashcards in this deck.
Unlock Deck
k this deck
15
In one strain of cabbage, you conduct an RFLP analysis of head weight; you determine that seven QTLs affect this trait. In another strain of cabbage, you find that only four QTLs affect this trait. Note that both strains of cabbage are from the same species, although they may have been subjected to different degrees of inbreeding. Explain how one strain can have seven QTLs and another strain four QTLs for exactly the same trait. Is the second strain missing three genes
Unlock Deck
Unlock for access to all 53 flashcards in this deck.
Unlock Deck
k this deck
16
What is polygenic inheritance Discuss the issues that make polygenic inheritance difficult to study.
Unlock Deck
Unlock for access to all 53 flashcards in this deck.
Unlock Deck
k this deck
17
Discuss whether a natural population of wolves or a domesticated population of German shepherds is more likely to have a higher heritability for the trait of size.
Unlock Deck
Unlock for access to all 53 flashcards in this deck.
Unlock Deck
k this deck
18
What is heterosis Discuss whether it is caused by a single gene or several genes. Discuss the two major hypotheses proposed to explain heterosis. Which do you think is more likely to be correct
Unlock Deck
Unlock for access to all 53 flashcards in this deck.
Unlock Deck
k this deck
19
A danger in computing heritability values from studies involving genetically related individuals is the possibility that these individuals share more similar environments than do unrelated individuals. In the experiment of Figure 27.8, which data are the most compelling evidence that ridge count is not caused by genetically related individuals sharing common environments Explain.FIGURE 27.8 Heritability of human fingerprint patterns.
Starting material: A group of human subjects from Great Britain.
Starting material: A group of human subjects from Great Britain.
Unlock Deck
Unlock for access to all 53 flashcards in this deck.
Unlock Deck
k this deck
20
With regard to heterosis, would the following statements be consistent with the dominance hypothesis, the overdominance hypothesis, or both
a. Strains that have been highly inbred have become monomorphic for one or more recessive alleles that are somewhat detrimental to the organism
b. Hybrid vigor occurs because highly inbred strains are monomorphic for many genes, whereas hybrids are more likely to be heterozygous for those same genes
c. If a gene exists in two alleles, hybrids are more vigorous because heterozygosity for the gene is more beneficial than homozygosity of either allele.
Unlock Deck
Unlock for access to all 53 flashcards in this deck.
Unlock Deck
k this deck
21
Explain the difference between a continuous trait and a discontinuous trait. Give two examples of each. Are quantitative traits likely to be continuous or discontinuous Explain why.
Unlock Deck
Unlock for access to all 53 flashcards in this deck.
Unlock Deck
k this deck
22
What is a quantitative trait locus (QTL) Does a QTL contain one gene or multiple genes What technique is commonly used to identify QTLs
Unlock Deck
Unlock for access to all 53 flashcards in this deck.
Unlock Deck
k this deck
23
Which of the following is an example of a quantitative trait
A) Height
B) Rate of glucose metabolism
C) Ability to learn a maze
D) All of the above
A) Height
B) Rate of glucose metabolism
C) Ability to learn a maze
D) All of the above
Unlock Deck
Unlock for access to all 53 flashcards in this deck.
Unlock Deck
k this deck
24
From an experimental viewpoint, what does it mean to say that an RFLP is associated with a trait Let's suppose that two strains of pea plants differ in two RFLPs that are linked to two genes governing pea size. RFLP-1 is found in 2000-bp and 2700-bp bands, and RFLP-2 is found in 3000-bp and 4000-bp bands. The plants producing large peas have RFLP-1 (2000 bp) and RFLP-2 (3000 bp); those producing small peas have RFLP-1 (2700 bp) and RFLP-2 (4000 bp). A cross is made between these two strains, and the F 1 offspring are allowed to self-fertilize. Five phenotypic classes are observed: small peas, small-medium peas, medium peas, medium-large peas, and large peas. We assume that each of the two genes makes an equal contribution to pea size and that the genetic variance is additive. Draw a gel and explain what RFLP banding patterns you would expect to observe for these five phenotypic categories. Note: Certain phenotypic categories may have more than one possible banding pattern.
Unlock Deck
Unlock for access to all 53 flashcards in this deck.
Unlock Deck
k this deck
25
A large, genetically heterogeneous group of tomato plants was used as the original breeding stock by two different breeders, named Mary and Hector. Each breeder was given 50 seeds and began an artificial selection strategy, much like the one described in Figure 27.11. The seeds were planted, and the breeders selected the 10 plants with the highest mean tomato weights as the breeding stock for the next generation. This process was repeated over the course of 12 growing seasons, and the following data were obtained:
Mean Weight of Tomatoes (pounds)
a. Explain these results
b. Another tomato breeder, named Martin, got some seeds from Mary's and Hector's tomato strains (after 12 generations), grew the plants, and then crossed them to each other. The mean weight of the tomatoes in these hybrids was about 1.7 pounds. For a period of 5 years, Martin subjected these hybrids to the same experimental strategy that Mary and Hector had followed, and he obtained the following results:
Mean Weight of Tomatoes (pounds)
a.
Explain Martin's data. Why was Martin able to obtain tomatoes heavier than 1.5 pounds, whereas Mary's and Hector's strains appeared to plateau at this weight
FIGURE 27.11 Common results of selective breeding for a quantitative trait.
Mean Weight of Tomatoes (pounds)
a. Explain these results
b. Another tomato breeder, named Martin, got some seeds from Mary's and Hector's tomato strains (after 12 generations), grew the plants, and then crossed them to each other. The mean weight of the tomatoes in these hybrids was about 1.7 pounds. For a period of 5 years, Martin subjected these hybrids to the same experimental strategy that Mary and Hector had followed, and he obtained the following results:
Mean Weight of Tomatoes (pounds)
a.
Explain Martin's data. Why was Martin able to obtain tomatoes heavier than 1.5 pounds, whereas Mary's and Hector's strains appeared to plateau at this weight
FIGURE 27.11 Common results of selective breeding for a quantitative trait.
Unlock Deck
Unlock for access to all 53 flashcards in this deck.
Unlock Deck
k this deck
26
Saying that a quantitative trait follows a continuum means that
A) the numerical value for the trait increases with the age of the individual
B) environmental effects are additive
C) phenotypes are continuous and do not fall into discrete categories
D) the trait continuously changes during the life of an individual.
A) the numerical value for the trait increases with the age of the individual
B) environmental effects are additive
C) phenotypes are continuous and do not fall into discrete categories
D) the trait continuously changes during the life of an individual.
Unlock Deck
Unlock for access to all 53 flashcards in this deck.
Unlock Deck
k this deck
27
What is a frequency distribution Explain how the graph is made for a quantitative trait that is continuous.
Unlock Deck
Unlock for access to all 53 flashcards in this deck.
Unlock Deck
k this deck
28
Let's suppose that weight in a species of mammal is polygenic, and each gene exists as a heavy and light allele. If the allele frequencies in the population were equal for both types of allele (i.e., 50% heavy alleles and 50% light alleles), what percentage of individuals would be homozygous for the light alleles at all of the genes affecting this trait, if the trait was determined by the following number of genes
a. Two
B. Three
C. Four
a. Two
B. Three
C. Four
Unlock Deck
Unlock for access to all 53 flashcards in this deck.
Unlock Deck
k this deck
29
The variance is
A) a measure of the variation around the mean
B) computed as a squared deviation
C) higher when there is less phenotypic variation
D) both a and b are correct.
A) a measure of the variation around the mean
B) computed as a squared deviation
C) higher when there is less phenotypic variation
D) both a and b are correct.
Unlock Deck
Unlock for access to all 53 flashcards in this deck.
Unlock Deck
k this deck
30
Let's suppose that two strains of pigs differ in 500 RFLPs. One strain is much larger than the other. The pigs are crossed to each other, and the members of the F 1 generation are also crossed among themselves to produce an F 2 generation. Three distinct RFLPs are associated with F 2 pigs that are larger. How would you interpret these results
Unlock Deck
Unlock for access to all 53 flashcards in this deck.
Unlock Deck
k this deck
31
The correlation coefficients for height were determined for 15 pairs of individuals with the following genetic relationships:
Mother-daughter: 0.36
Mother- granddaughter: 0.17
Sister-sister: 0.39
Sister-sister (fraternal twins): 0.40
Sister-sister (identical twins): 0.77
What is the average heritability for height in this group of females
Mother-daughter: 0.36
Mother- granddaughter: 0.17
Sister-sister: 0.39
Sister-sister (fraternal twins): 0.40
Sister-sister (identical twins): 0.77
What is the average heritability for height in this group of females
Unlock Deck
Unlock for access to all 53 flashcards in this deck.
Unlock Deck
k this deck
32
Which of the following statistics is used to compare two variables
A) Mean
B) Correlation coefficient
C) Variance
D) Standard deviation
A) Mean
B) Correlation coefficient
C) Variance
D) Standard deviation
Unlock Deck
Unlock for access to all 53 flashcards in this deck.
Unlock Deck
k this deck
33
The variance for weight in a particular herd of cattle is 484 pounds 2. The mean weight is 562 pounds. How heavy would an animal have to be if it was in the top 2.5% of the herd The bottom 0.13%
Unlock Deck
Unlock for access to all 53 flashcards in this deck.
Unlock Deck
k this deck
34
The broad-sense heritability for a trait equals 1.0. In your own words, explain what this value means. Would you conclude that the environment is unimportant in the outcome of this trait Explain your answer.
Unlock Deck
Unlock for access to all 53 flashcards in this deck.
Unlock Deck
k this deck
35
For quantitative traits, genotypes and phenotypes tend to overlap because
A) the trait changes over time
B) they are polygenic
C) environmental variation affects the trait
D) both b and c are correct.
A) the trait changes over time
B) they are polygenic
C) environmental variation affects the trait
D) both b and c are correct.
Unlock Deck
Unlock for access to all 53 flashcards in this deck.
Unlock Deck
k this deck
36
Outline the steps you would follow to determine the number of genes that influence the yield of rice. Describe the results you might get if rice yield is governed by variation in six different genes.
Unlock Deck
Unlock for access to all 53 flashcards in this deck.
Unlock Deck
k this deck
37
An animal breeder had a herd of sheep with a mean weight of 254 pounds at 3 years of age. He chose animals with mean weights of 281 pounds as parents for the next generation. When these offspring reached 3 years of age, their mean weights were 269 pounds
a. Calculate the narrow-sense heritability for weight in this herd
b. Using the heritability value that you calculated in part A, what weight of animals would you have to choose to get offspring that weigh 275 pounds (at 3 years of age)
a. Calculate the narrow-sense heritability for weight in this herd
b. Using the heritability value that you calculated in part A, what weight of animals would you have to choose to get offspring that weigh 275 pounds (at 3 years of age)
Unlock Deck
Unlock for access to all 53 flashcards in this deck.
Unlock Deck
k this deck
38
A QTL is a_________ where one or more genes affecting a quantitative trait are______
A) site in a cell, located
B) site in a chromosome, located
C) site in a cell, expressed
D) site in a chromosome, expressed
A) site in a cell, located
B) site in a chromosome, located
C) site in a cell, expressed
D) site in a chromosome, expressed
Unlock Deck
Unlock for access to all 53 flashcards in this deck.
Unlock Deck
k this deck
39
Two different varieties of potatoes both have the same mean weight of 1.5 pounds. One group has a very low variance, and the other has a much higher variance
a. Discuss the possible reasons for the differences in variance
b. If you were a potato farmer, would you rather raise a variety with a low or high variance Explain your answer from a practical point of view
c. If you were a potato breeder and you wanted to develop potatoes with a heavier weight, would you choose the variety with a low or high variance Explain your answer.
Unlock Deck
Unlock for access to all 53 flashcards in this deck.
Unlock Deck
k this deck
40
From an agricultural point of view, discuss the advantages and disadvantages of selective breeding. It is common for plant breeders to take two different, highly inbred strains, which are the product of many generations of selective breeding, and cross them to make hybrids. How does this approach overcome some of the disadvantages of selective breeding
Unlock Deck
Unlock for access to all 53 flashcards in this deck.
Unlock Deck
k this deck
41
To map QTLs, strains are crossed that differ with regard to
A) a quantitative trait
B) molecular markers
C) a quantitative trait and molecular markers
D) a quantitative trait and a discontinuous trait.
A) a quantitative trait
B) molecular markers
C) a quantitative trait and molecular markers
D) a quantitative trait and a discontinuous trait.
Unlock Deck
Unlock for access to all 53 flashcards in this deck.
Unlock Deck
k this deck
42
Give several examples of quantitative traits. How are these quantitative traits described within groups of individuals
Unlock Deck
Unlock for access to all 53 flashcards in this deck.
Unlock Deck
k this deck
43
In a wild strain of tomato plants, the phenotypic variance for tomato weight is 3.2 g 2. In another strain of highly inbred tomatoes raised under the same environmental conditions, the phenotypic variance is 2.2 g 2. With regard to the wild strain,
a. Estimate V G
b. What is h B 2
c. Assuming that all of the genetic variance is additive, what is h N 2 .
a. Estimate V G
b. What is h B 2
c. Assuming that all of the genetic variance is additive, what is h N 2 .
Unlock Deck
Unlock for access to all 53 flashcards in this deck.
Unlock Deck
k this deck
44
The trait of blood pressure in humans has a frequency distribution that is similar to a normal distribution. The following graph shows the ranges of blood pressures for a selected population of people. The red line depicts the frequency distribution of the systolic pressures for the entire population. Several individuals with high blood pressure were identified, and the blood pressures of their relatives were determined. This frequency distribution is depicted with a blue line. (Note: The blue line does not include the people who were identified with high blood pressure; it includes only their relatives.)
Unlock Deck
Unlock for access to all 53 flashcards in this deck.
Unlock Deck
k this deck
45
In a population of squirrels in North Carolina, the heritability for body weight is high. This means that
A) body weight is primarily controlled by genes
B) the environment has little influence on body weight
C) the variance in body weight is mostly due to genetic variation
D) both a and b are correct.
A) body weight is primarily controlled by genes
B) the environment has little influence on body weight
C) the variance in body weight is mostly due to genetic variation
D) both a and b are correct.
Unlock Deck
Unlock for access to all 53 flashcards in this deck.
Unlock Deck
k this deck
46
Here are data for height and weight among 10 male college students.
a. Calculate the correlation coefficients for this group
b. Is the correlation coefficient statistically significant Explain.
a. Calculate the correlation coefficients for this group
b. Is the correlation coefficient statistically significant Explain.
Unlock Deck
Unlock for access to all 53 flashcards in this deck.
Unlock Deck
k this deck
47
If an r value equals 0.5 and N = 4, would you conclude that a positive correlation is found between the two variables Explain your answer. What if N = 500
Unlock Deck
Unlock for access to all 53 flashcards in this deck.
Unlock Deck
k this deck
48
Many beautiful varieties of roses have been produced, particularly in the last few decades. These newer varieties often have very striking and showy flowers, making them desirable as horticultural specimens. However, breeders and novices alike have noticed that some of these newer varieties are not very fragrant compared with the older, more traditional varieties. From a genetic point of view, suggest an explanation why some of these newer varieties with superb flowers are not as fragrant.
Unlock Deck
Unlock for access to all 53 flashcards in this deck.
Unlock Deck
k this deck
49
If two or more different genotypes do not respond to environmental variation in the same way, this is an example of
A) a genotype-environment association
B) a genotype-environment interaction
C) the additive effects of alleles
D) both a and b.
A) a genotype-environment association
B) a genotype-environment interaction
C) the additive effects of alleles
D) both a and b.
Unlock Deck
Unlock for access to all 53 flashcards in this deck.
Unlock Deck
k this deck
50
Discuss why heritability is an important phenomenon in agriculture.
Unlock Deck
Unlock for access to all 53 flashcards in this deck.
Unlock Deck
k this deck
51
The average thorax length in a Drosophila population is 1.01 mm. You want to practice selective breeding to make larger Drosophila. To do so, you choose 10 parents (5 males and 5 females) of the following sizes: 0.97, 0.99, 1.05, 1.06, 1.03, 1.21, 1.22, 1.17, 1.19, and 1.20. You mate them and then analyze the thorax sizes of 30 offspring (half male and half female): 0.99, 1.15, 1.20, 1.33, 1.07, 1.11, 1.21, 0.94, 1.07, 1.11, 1.20, 1.01, 1.02, 1.05, 1.21, 1.22, 1.03, 0.99, 1.20, 1.10, 0.91, 0.94, 1.13, 1.14, 1.20, 0.89, 1.10, 1.04, 1.01, 1.26. Calculate the realized heritability in this group of flies.
Unlock Deck
Unlock for access to all 53 flashcards in this deck.
Unlock Deck
k this deck
52
In your own words, explain the meaning of the term heritability. Why is a heritability value valid only for a particular population of individuals raised in a particular environment
Unlock Deck
Unlock for access to all 53 flashcards in this deck.
Unlock Deck
k this deck
53
One way to estimate narrow-sense heritability for a given trait is to compare_____ for_______
A) variances, related pairs of individuals
B) correlation coefficients, related pairs of individuals
C) variances, unrelated pairs of individuals
D) correlation coefficients, unrelated pairs of individuals
A) variances, related pairs of individuals
B) correlation coefficients, related pairs of individuals
C) variances, unrelated pairs of individuals
D) correlation coefficients, unrelated pairs of individuals
Unlock Deck
Unlock for access to all 53 flashcards in this deck.
Unlock Deck
k this deck
Unlock Deck
Unlock for access to all 53 flashcards in this deck.


